![[Update] You can now send Prometheus metrics directly to CloudWatch using CloudWatch managed Prometheus collectors](https://images.ctfassets.net/ct0aopd36mqt/wp-thumbnail-d6a3bc85cad6419960fbda152152cd8c/ba5841cea06b96f4933878762028b090/amazon-cloudwatch?w=3840&fm=webp)
[Update] You can now send Prometheus metrics directly to CloudWatch using CloudWatch managed Prometheus collectors

This page has been translated by machine translation. View original
Introduction
Hello everyone, I'm Akaike.
Recently, Amazon CloudWatch received an update that allows you to send Prometheus metrics directly to CloudWatch using the Managed Prometheus collector.
Previously, delivering Prometheus metrics to CloudWatch required building and operating your own OTel Collector, so this looks very convenient.
So this time, I created both the traditional self-managed configuration and the new managed configuration using the Managed Prometheus collector on an actual AWS account, and compared them.
Update Overview
With this update, it is now possible to deliver directly to a CloudWatch dataset as a Prometheus metrics destination.
This means you can complete everything from Prometheus metrics collection to PromQL queries with CloudWatch alone, without needing to build a separate AMP workspace.
Here is a rough summary of the update:
- Prometheus-format metrics can be collected agentlessly from Amazon EKS, Amazon EC2, Amazon ECS, Amazon MSK, and Amazon OpenSearch Service workloads, and delivered to CloudWatch in OpenTelemetry format
- The service discovery method differs for each collection target
- EKS: Kubernetes service discovery
- ECS: DNS-based service discovery via AWS Cloud Map
- EC2: Direct instance specification via
static_configs - MSK / OpenSearch: Direct scraping of open monitoring endpoints
- Supported regions are all regions where the CloudWatch OTLP endpoint is available (excluding Asia Pacific - New Zealand)
- Pricing is collector hourly billing + standard CloudWatch OpenTelemetry metrics ingestion fees
Incidentally, the agentless collection feature itself called managed collector (collecting from EKS, MSK, EC2, and ECS as sources and delivering to an AMP workspace) had been available incrementally since November 2023.
Verification
So, I actually created both the self-managed and managed configurations on an AWS account and compared them.
Approach to Verification
I will create separate AWS resources for the self-managed and managed configurations using Terraform.
Since I wanted to get a feel for hands-on work, the agent installation and scraper creation themselves were done manually.
Self-Managed Configuration: Setting Up Your Own OTel Collector
The self-managed configuration follows the conventional setup, collecting metrics from a Prometheus exporter running on EC2 into CloudWatch.
A separate EC2 instance is prepared for the collector apart from the target, and the AWS Distro for OpenTelemetry (ADOT) Collector is installed there, with a config.yaml containing the scrape configuration and destination settings.
Terraform Code
The installation and configuration of Node Exporter and ADOT Collector are done manually afterward, so they are not included in Terraform.
Code
terraform {
  required_version = ">= 1.9"

  required_providers {
    aws = {
      source  = "hashicorp/aws"
      version = "~> 6.58"
    }
  }
}

provider "aws" {
  region = var.aws_region
}
variable "aws_region" {
  description = "AWS region to deploy resources into"
  type        = string
  default     = "ap-northeast-1"
}

variable "vpc_cidr" {
  description = "CIDR block for the Before-configuration VPC"
  type        = string
  default     = "10.10.0.0/16"
}

variable "public_subnet_cidr" {
  description = "CIDR block for the public subnet"
  type        = string
  default     = "10.10.0.0/24"
}

variable "instance_type" {
  description = "EC2 instance type for both the target and collector instances"
  type        = string
  default     = "t3.micro"
}
data "aws_availability_zones" "available" {
  state = "available"
}

data "aws_ssm_parameter" "al2023" {
  name = "/aws/service/ami-amazon-linux-latest/al2023-ami-kernel-default-x86_64"
}

# --- Networking ---

resource "aws_vpc" "this" {
  cidr_block           = var.vpc_cidr
  enable_dns_support   = true
  enable_dns_hostnames = true

  tags = {
    Name = "cw-prometheus-collector-before"
  }
}

resource "aws_internet_gateway" "this" {
  vpc_id = aws_vpc.this.id

  tags = {
    Name = "cw-prometheus-collector-before"
  }
}

resource "aws_subnet" "public" {
  vpc_id                  = aws_vpc.this.id
  cidr_block              = var.public_subnet_cidr
  availability_zone       = data.aws_availability_zones.available.names[0]
  map_public_ip_on_launch = true

  tags = {
    Name = "cw-prometheus-collector-before-public"
  }
}

resource "aws_route_table" "public" {
  vpc_id = aws_vpc.this.id

  route {
    cidr_block = "0.0.0.0/0"
    gateway_id = aws_internet_gateway.this.id
  }

  tags = {
    Name = "cw-prometheus-collector-before-public"
  }
}

resource "aws_route_table_association" "public" {
  subnet_id      = aws_subnet.public.id
  route_table_id = aws_route_table.public.id
}

# --- Security groups ---
# SSM Session Manager is reached over HTTPS via the internet gateway, so no
# inbound SSH rule is required on either security group.

resource "aws_security_group" "collector" {
  name        = "collector-sg"
  description = "ADOT collector instance - outbound only (SSM + CloudWatch OTLP)"
  vpc_id      = aws_vpc.this.id

  egress {
    description = "Allow all outbound"
    from_port   = 0
    to_port     = 0
    protocol    = "-1"
    cidr_blocks = ["0.0.0.0/0"]
  }

  tags = {
    Name = "collector-sg"
  }
}

resource "aws_security_group" "target" {
  name        = "target-sg"
  description = "Node exporter target, scraped by the collector instance"
  vpc_id      = aws_vpc.this.id

  egress {
    description = "Allow all outbound"
    from_port   = 0
    to_port     = 0
    protocol    = "-1"
    cidr_blocks = ["0.0.0.0/0"]
  }

  tags = {
    Name = "target-sg"
  }
}

resource "aws_security_group_rule" "target_ingress_from_collector" {
  type                     = "ingress"
  from_port                = 9100
  to_port                  = 9100
  protocol                 = "tcp"
  security_group_id        = aws_security_group.target.id
  source_security_group_id = aws_security_group.collector.id
  description              = "Allow Prometheus scrape from the collector instance"
}

# --- IAM ---

data "aws_iam_policy_document" "ec2_assume_role" {
  statement {
    actions = ["sts:AssumeRole"]

    principals {
      type        = "Service"
      identifiers = ["ec2.amazonaws.com"]
    }
  }
}

resource "aws_iam_role" "target" {
  name               = "cw-prometheus-collector-before-target"
  assume_role_policy = data.aws_iam_policy_document.ec2_assume_role.json
}

resource "aws_iam_role_policy_attachment" "target_ssm" {
  role       = aws_iam_role.target.name
  policy_arn = "arn:aws:iam::aws:policy/AmazonSSMManagedInstanceCore"
}

resource "aws_iam_instance_profile" "target" {
  name = "cw-prometheus-collector-before-target"
  role = aws_iam_role.target.name
}

resource "aws_iam_role" "collector" {
  name               = "cw-prometheus-collector-before-collector"
  assume_role_policy = data.aws_iam_policy_document.ec2_assume_role.json
}

resource "aws_iam_role_policy_attachment" "collector_ssm" {
  role       = aws_iam_role.collector.name
  policy_arn = "arn:aws:iam::aws:policy/AmazonSSMManagedInstanceCore"
}

data "aws_iam_policy_document" "collector_cloudwatch_otlp" {
  statement {
    actions   = ["cloudwatch:PutMetricData"]
    resources = ["*"]
  }
}

resource "aws_iam_role_policy" "collector_cloudwatch_otlp" {
  name   = "cloudwatch-otlp-put-metric-data"
  role   = aws_iam_role.collector.id
  policy = data.aws_iam_policy_document.collector_cloudwatch_otlp.json
}

resource "aws_iam_instance_profile" "collector" {
  name = "cw-prometheus-collector-before-collector"
  role = aws_iam_role.collector.name
}

# --- EC2 instances ---
# Node Exporter and the ADOT Collector are installed and configured manually
# after apply, over SSM Session Manager.

resource "aws_instance" "target" {
  ami                         = data.aws_ssm_parameter.al2023.value
  instance_type               = var.instance_type
  subnet_id                   = aws_subnet.public.id
  vpc_security_group_ids      = [aws_security_group.target.id]
  iam_instance_profile        = aws_iam_instance_profile.target.name
  associate_public_ip_address = true

  tags = {
    Name = "before-target"
  }
}

resource "aws_instance" "collector" {
  ami                         = data.aws_ssm_parameter.al2023.value
  instance_type               = var.instance_type
  subnet_id                   = aws_subnet.public.id
  vpc_security_group_ids      = [aws_security_group.collector.id]
  iam_instance_profile        = aws_iam_instance_profile.collector.name
  associate_public_ip_address = true

  tags = {
    Name = "before-collector"
  }
}
output "vpc_id" {
  value = aws_vpc.this.id
}

output "target_instance_id" {
  value = aws_instance.target.id
}

output "collector_instance_id" {
  value = aws_instance.collector.id
}

output "target_private_ip" {
  value = aws_instance.target.private_ip
}
Once the resources are created, connect to the target instance via SSM, and install and start Node Exporter.
sudo useradd --no-create-home --shell /usr/sbin/nologin node_exporter

cd /tmp
curl -LO https://github.com/prometheus/node_exporter/releases/download/v1.8.2/node_exporter-1.8.2.linux-amd64.tar.gz
tar xvf node_exporter-1.8.2.linux-amd64.tar.gz
sudo cp node_exporter-1.8.2.linux-amd64/node_exporter /usr/local/bin/
sudo chown node_exporter:node_exporter /usr/local/bin/node_exporter

sudo tee /etc/systemd/system/node_exporter.service <<'UNIT'
[Unit]
Description=Node Exporter
After=network.target

[Service]
User=node_exporter
ExecStart=/usr/local/bin/node_exporter

[Install]
WantedBy=multi-user.target
UNIT

sudo systemctl daemon-reload
sudo systemctl enable --now node_exporter

# Verify operation
curl -s http://localhost:9100/metrics | head
Next, install the ADOT Collector on the collector instance, and write the configuration to scrape Node Exporter and send to the CloudWatch OTLP endpoint with sigv4 signing.
cd /tmp
curl -LO https://aws-otel-collector.s3.amazonaws.com/amazon_linux/amd64/latest/aws-otel-collector.rpm
sudo rpm -Uvh ./aws-otel-collector.rpm

sudo mkdir -p /opt/aws/aws-otel-collector/etc
sudo tee /opt/aws/aws-otel-collector/etc/config.yaml <<CONFIG
receivers:
  prometheus:
    config:
      scrape_configs:
        - job_name: 'ec2-node-exporter'
          scrape_interval: 60s
          static_configs:
            - targets: ['<target-private-ip>:9100']

processors:
  batch:
    send_batch_size: 200
    timeout: 10s

exporters:
  otlphttp:
    metrics_endpoint: "https://monitoring.<region>.amazonaws.com/v1/metrics"
    auth:
      authenticator: sigv4auth

extensions:
  sigv4auth:
    service: "monitoring"
    region: "<region>"

service:
  extensions: [sigv4auth]
  pipelines:
    metrics:
      receivers: [prometheus]
      processors: [batch]
      exporters: [otlphttp]
CONFIG

sudo /opt/aws/aws-otel-collector/bin/aws-otel-collector-ctl -c /opt/aws/aws-otel-collector/etc/config.yaml -a start

# Check status
sudo /opt/aws/aws-otel-collector/bin/aws-otel-collector-ctl -a status
※ Replace the <XXX> values with actual values
Checking the Results
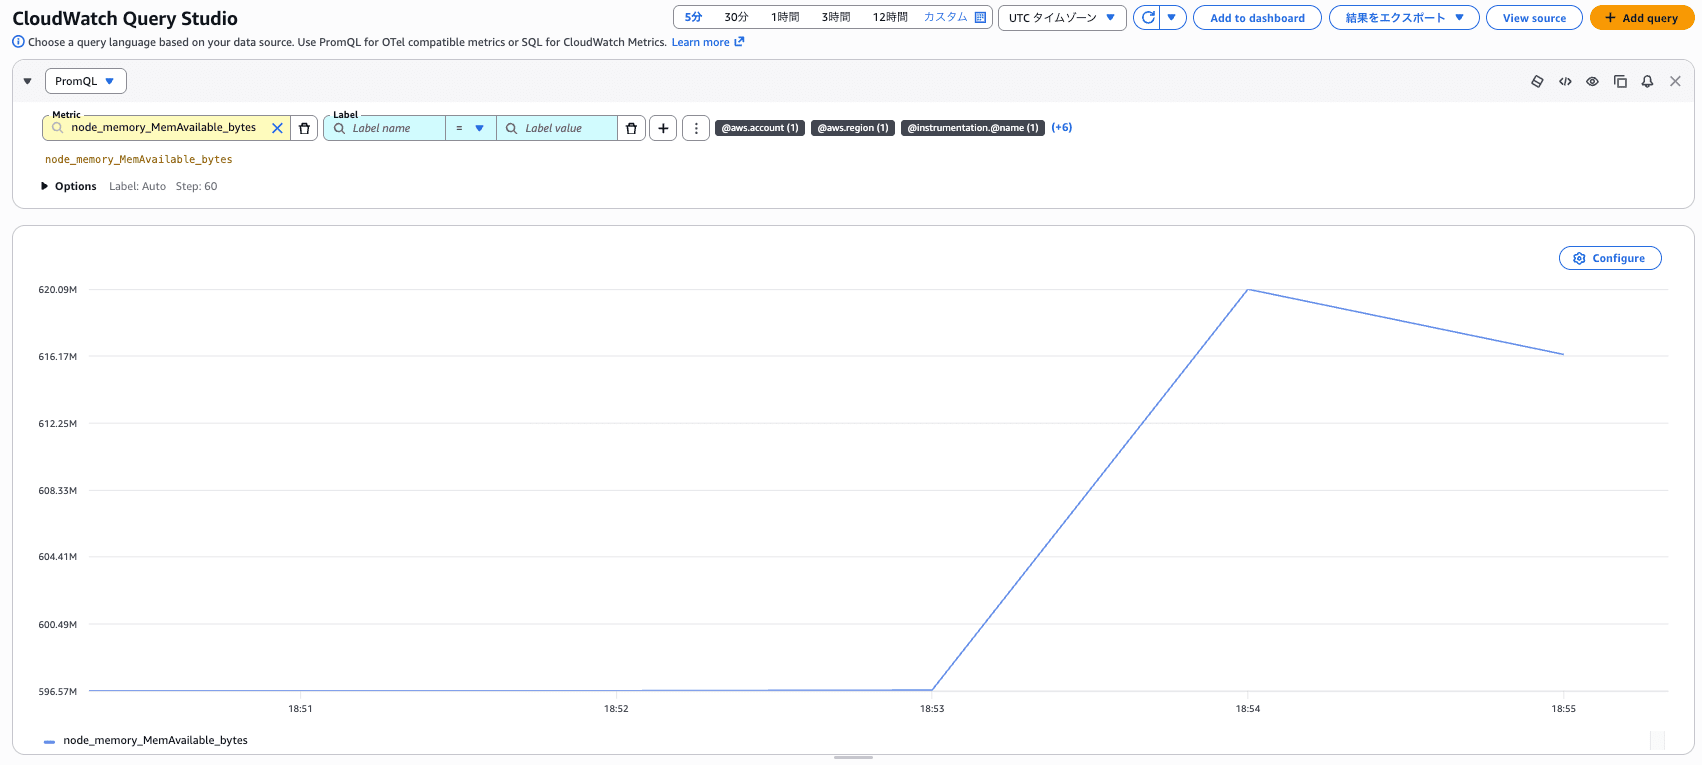
Opening CloudWatch Query Studio and checking with PromQL, the metrics exposed by Node Exporter are properly reaching CloudWatch.
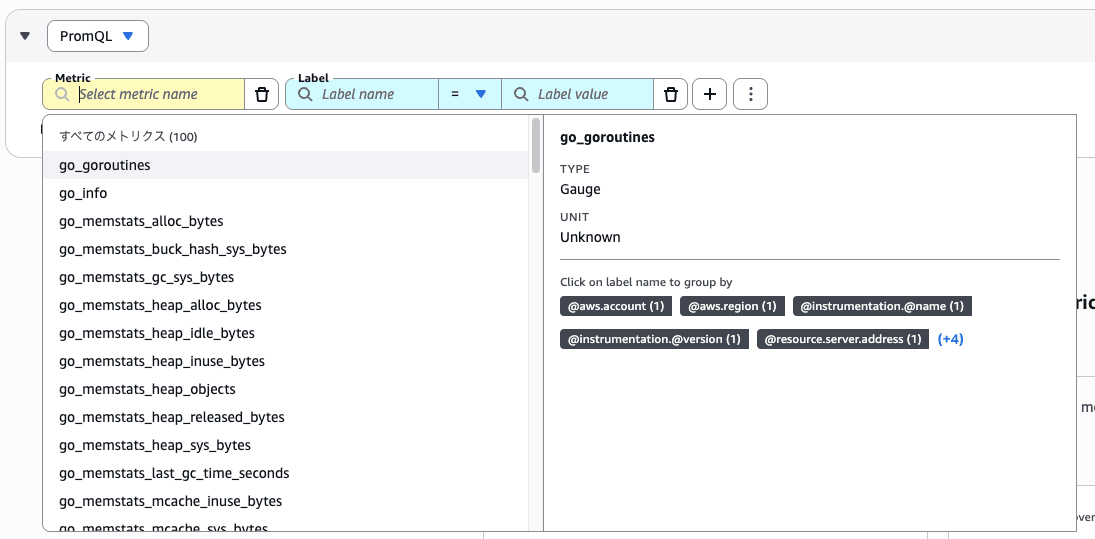
Incidentally, in CloudWatch PromQL, AWS-derived labels such as @aws.account and @aws.region are automatically added to metrics ingested via OTLP.
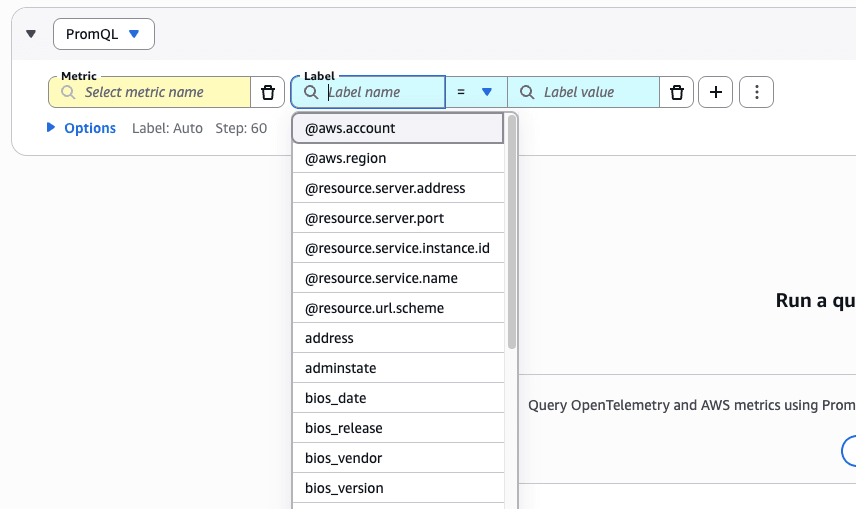
This is a mechanism called "AWS resource enrichment," which automatically embeds information such as account ID and region into collected metrics, allowing them to be used for filtering and grouping in PromQL.
Managed Configuration: Setting Up CloudWatch Managed Prometheus Collector
The managed configuration is one where the entire collector from the self-managed setup is entrusted to AWS.
You simply configure the scraper with the scrape settings — "what to scrape and how frequently" — and the VPC connection information, and AWS handles the provisioning, scaling, and collection processing.
Additionally, an ENI (Elastic Network Interface) is automatically created for each specified subnet, and scraping via the OTLP protocol is performed through that ENI.
Terraform Code
The differences from the self-managed configuration are that no instance for the collector is needed, and the ingress rule for target-sg is self-referencing.
Since the ENIs created by the managed collector also use the same target-sg, by setting the rule to "allow TCP 9100 from target-sg itself," there is no need to create a separate security group for the collector.
Also, the scraper itself (Managed Collector) is created using the AWS CLI rather than Terraform.
Code
terraform {
  required_version = ">= 1.9"

  required_providers {
    aws = {
      source  = "hashicorp/aws"
      version = "~> 6.58"
    }
  }
}

provider "aws" {
  region = var.aws_region
}
variable "aws_region" {
  description = "AWS region to deploy resources into"
  type        = string
  default     = "ap-northeast-1"
}

variable "vpc_cidr" {
  description = "CIDR block for the After-configuration VPC"
  type        = string
  default     = "10.20.0.0/16"
}

variable "instance_type" {
  description = "EC2 instance type for the target instance"
  type        = string
  default     = "t3.micro"
}
data "aws_availability_zones" "available" {
  state = "available"
}

data "aws_ssm_parameter" "al2023" {
  name = "/aws/service/ami-amazon-linux-latest/al2023-ami-kernel-default-x86_64"
}

data "aws_caller_identity" "current" {}

# --- Networking ---
# The managed collector's VPC source requires subnets in at least two
# different availability zones, so two public subnets are created even
# though only one of them hosts an EC2 instance.

resource "aws_vpc" "this" {
  cidr_block           = var.vpc_cidr
  enable_dns_support   = true
  enable_dns_hostnames = true

  tags = {
    Name = "cw-prometheus-collector-after"
  }
}

resource "aws_internet_gateway" "this" {
  vpc_id = aws_vpc.this.id

  tags = {
    Name = "cw-prometheus-collector-after"
  }
}

resource "aws_subnet" "public" {
  for_each = { for idx, az in slice(data.aws_availability_zones.available.names, 0, 2) : tostring(idx) => az }

  vpc_id                  = aws_vpc.this.id
  cidr_block              = cidrsubnet(var.vpc_cidr, 8, tonumber(each.key))
  availability_zone       = each.value
  map_public_ip_on_launch = true

  tags = {
    Name = "cw-prometheus-collector-after-public-${each.key}"
  }
}

resource "aws_route_table" "public" {
  vpc_id = aws_vpc.this.id

  route {
    cidr_block = "0.0.0.0/0"
    gateway_id = aws_internet_gateway.this.id
  }

  tags = {
    Name = "cw-prometheus-collector-after-public"
  }
}

resource "aws_route_table_association" "public" {
  for_each = aws_subnet.public

  subnet_id      = each.value.id
  route_table_id = aws_route_table.public.id
}

# --- Security group ---
# The managed collector creates its ENIs using this same security group, so
# the ingress rule below is self-referencing rather than pointing at a
# separate collector security group.

resource "aws_security_group" "target" {
  name        = "target-sg"
  description = "Node exporter target, also attached to the managed collector ENIs"
  vpc_id      = aws_vpc.this.id

  egress {
    description = "Allow all outbound"
    from_port   = 0
    to_port     = 0
    protocol    = "-1"
    cidr_blocks = ["0.0.0.0/0"]
  }

  tags = {
    Name = "target-sg"
  }
}

resource "aws_security_group_rule" "target_ingress_self" {
  type                     = "ingress"
  from_port                = 9100
  to_port                  = 9100
  protocol                 = "tcp"
  security_group_id        = aws_security_group.target.id
  source_security_group_id = aws_security_group.target.id
  description              = "Allow scrape from the managed collector ENIs (same security group)"
}

# --- IAM ---
# Only the target instance needs an IAM role you manage (for SSM). The
# managed collector's own execution role is created automatically by
# CreateScraper.

data "aws_iam_policy_document" "ec2_assume_role" {
  statement {
    actions = ["sts:AssumeRole"]

    principals {
      type        = "Service"
      identifiers = ["ec2.amazonaws.com"]
    }
  }
}

resource "aws_iam_role" "target" {
  name               = "cw-prometheus-collector-after-target"
  assume_role_policy = data.aws_iam_policy_document.ec2_assume_role.json
}

resource "aws_iam_role_policy_attachment" "target_ssm" {
  role       = aws_iam_role.target.name
  policy_arn = "arn:aws:iam::aws:policy/AmazonSSMManagedInstanceCore"
}

resource "aws_iam_instance_profile" "target" {
  name = "cw-prometheus-collector-after-target"
  role = aws_iam_role.target.name
}

# --- EC2 target instance ---
# Node Exporter is installed and configured manually after apply, over SSM
# Session Manager.

resource "aws_instance" "target" {
  ami                         = data.aws_ssm_parameter.al2023.value
  instance_type               = var.instance_type
  subnet_id                   = aws_subnet.public["0"].id
  vpc_security_group_ids      = [aws_security_group.target.id]
  iam_instance_profile        = aws_iam_instance_profile.target.name
  associate_public_ip_address = true

  tags = {
    Name = "after-target"
  }
}

# The CloudWatch managed Prometheus collector (scraper) itself is created with
# the AWS CLI, not Terraform. See README.md for the exact `aws amp
# create-scraper` command, built from the outputs below.
output "vpc_id" {
  value = aws_vpc.this.id
}

output "target_instance_id" {
  value = aws_instance.target.id
}

output "target_private_ip" {
  value = aws_instance.target.private_ip
}

# The following outputs feed directly into the `aws amp create-scraper`
# command.

output "public_subnet_ids" {
  value = [for s in aws_subnet.public : s.id]
}

output "target_security_group_id" {
  value = aws_security_group.target.id
}

output "account_id" {
  value = data.aws_caller_identity.current.account_id
}
Once the resources are created, connect to the target instance via SSM, then install and start Node Exporter.
sudo useradd --no-create-home --shell /usr/sbin/nologin node_exporter

cd /tmp
curl -LO https://github.com/prometheus/node_exporter/releases/download/v1.8.2/node_exporter-1.8.2.linux-amd64.tar.gz
tar xvf node_exporter-1.8.2.linux-amd64.tar.gz
sudo cp node_exporter-1.8.2.linux-amd64/node_exporter /usr/local/bin/
sudo chown node_exporter:node_exporter /usr/local/bin/node_exporter

sudo tee /etc/systemd/system/node_exporter.service <<'UNIT'
[Unit]
Description=Node Exporter
After=network.target

[Service]
User=node_exporter
ExecStart=/usr/local/bin/node_exporter

[Install]
WantedBy=multi-user.target
UNIT

sudo systemctl daemon-reload
sudo systemctl enable --now node_exporter

# Verify operation
curl -s http://localhost:9100/metrics | head
All that's left is to prepare the scrape configuration file and create the scraper using the AWS CLI.
global:
  scrape_interval: 60s

scrape_configs:
  - job_name: 'ec2-node-exporter'
    static_configs:
      - targets:
          - '<target private IP>:9100'
aws amp create-scraper \
  --alias "cw-prometheus-collector-after" \
  --source '{
    "vpcConfiguration": {
      "subnetIds": ["<subnet-id-1>", "<subnet-id-2>"],
      "securityGroupIds": ["<sg-id>"]
    }
  }' \
  --scrape-configuration configurationBlob=$(cat scrape-config.yaml | base64 -w 0) \
  --destination '{
    "cloudWatchConfiguration": {
      "datasetArn": "arn:aws:cloudwatch:<region>:<account-id>:dataset/default"
    }
  }'
※ Replace the <XXX> values with the actual values.
Note that immediately after creation, checking with describe-scraper showed the statusCode remaining as CREATING for a while.
aws amp describe-scraper --scraper-id <scraper-id> --query 'scraper.status'
{
    "statusCode": "CREATING"
}
After waiting about 5 to 10 minutes and checking again, it had switched to ACTIVE.
{
    "statusCode": "ACTIVE"
}
Checking in CloudWatch Query Studio, metrics are being received properly here as well.
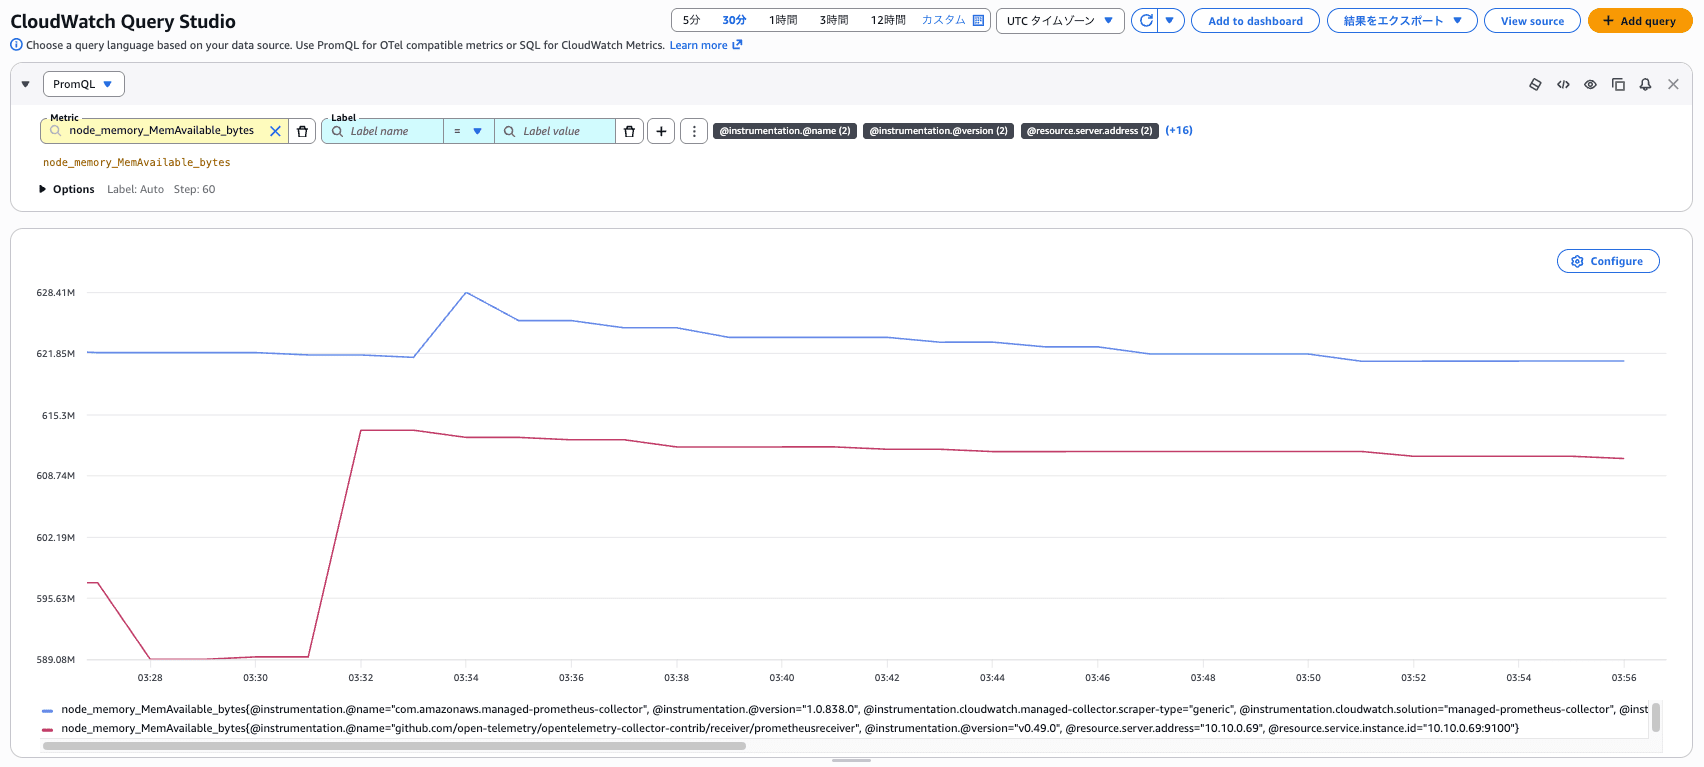
It also appears possible to distinguish the collection path using the @instrumentation.@name label.
github.com/open-telemetry/opentelemetry-collector-contrib/receiver/prometheusreceiver(v0.49.0)- Self-managed configuration side, data received from a self-hosted ADOT Collector
com.amazonaws.managed-prometheus-collector- Managed configuration side, data received from CloudWatch Managed Prometheus collector
Summary
Finally, here is a table summarizing what changed between the self-managed and managed configurations.
| Aspect | Self-managed configuration (self-hosted ADOT Collector) | Managed configuration (Managed Collector) |
|---|---|---|
| Collector | Managed by yourself | AWS-managed (scraped by managed collector) |
| Setup work | Package installation, creating config.yaml, starting and monitoring the process | Creating a scrape configuration file + one API call |
| Scaling & patch application | Handle yourself | Handled by AWS |
| Destination | CloudWatch OTLP endpoint (sigv4 signing) |
CloudWatch dataset (cloudWatchConfiguration) |
Closing
That wraps up my hands-on experience with Amazon CloudWatch managed Prometheus collectors.
Compared to before, it's convenient not having to manage the collector yourself.
I hope this serves as a useful reference for those considering how to collect Prometheus metrics.