![[アップデート] CloudWatch managed Prometheus collectorsでPrometheusメトリクスをCloudWatchへ直接送れるようになりました](https://images.ctfassets.net/ct0aopd36mqt/wp-thumbnail-d6a3bc85cad6419960fbda152152cd8c/ba5841cea06b96f4933878762028b090/amazon-cloudwatch?w=3840&fm=webp)
[アップデート] CloudWatch managed Prometheus collectorsでPrometheusメトリクスをCloudWatchへ直接送れるようになりました

はじめに
皆様こんにちは、あかいけです。
先日、Amazon CloudWatchにアップデートがあり、Managed Prometheus collectorを使ってPrometheusメトリクスをCloudWatchへ直接送れるようになりました。
従来はCloudWatchへPrometheusメトリクスを届けるには、自前でOTel Collectorを建てて運用する必要があったため、これは便利そうです。
というわけで今回は、この従来通りの自前構成と、新しく追加されたManaged Prometheus collectorを使うマネージド構成で、それぞれメトリクスを取らせて比較してみました。
アップデートの概要
今回のアップデートで、Prometheusメトリクスの配信先として CloudWatchのdatasetへ直接配信できる ようになりました。
そのためAMPワークスペースを別途構築しなくても、Prometheusメトリクスの収集からPromQLクエリまでCloudWatch単体で完結できます。
アップデート記事の内容はざっくり以下の通りです
- Amazon EKS、Amazon EC2、Amazon ECS、Amazon MSK、Amazon OpenSearch Serviceのワークロードから、エージェントレスにPrometheus形式のメトリクスを収集し、OpenTelemetry形式でCloudWatchへ配信できる
- 収集対象ごとにサービスディスカバリの方式が異なる
- EKS:Kubernetesのサービスディスカバリ
- ECS:AWS Cloud MapによるDNSベースのサービスディスカバリ
- EC2:
static_configsによるインスタンスの直接指定 - MSK・OpenSearch:オープンな監視エンドポイントへの直接スクレイプ
- 対応リージョンは、CloudWatch OTLPエンドポイントが利用可能な全リージョン(アジアパシフィック・ニュージーランドを除く)
- 料金はコレクターの時間課金 + 標準のCloudWatch OpenTelemetryメトリクス取り込み料金
ちなみに、マネージドコレクターというエージェントレスの収集機能自体(EKS・MSK・EC2・ECSをソースに、AMPワークスペースへ配信する形)は、2023年11月から段階的に提供されていました。
検証してみる
というわけで、実際にAWSアカウント上で自前構成とマネージド構成の両方を作って比較していきます。
検証の進め方
自前構成用・マネージド構成用に別々のAWSリソースをTerraformで作成します。
なお実際に手を動かした感触を確かめたかったので、エージェントのインストールやスクレイパーの作成そのものは手動で実施していきます。
自前構成:自前のOTel Collectorをセットアップ
自前構成はこれまで通りの構成で、EC2で動くPrometheus exporterのメトリクスをCloudWatchに取り込みます。
ターゲットとは別にコレクター用に別のEC2を用意し、そこにAWS Distro for OpenTelemetry(ADOT)Collectorをインストールして、スクレイプ設定と送信先設定を書いたconfig.yamlを配置します。
Terraformコード
Node ExporterとADOT Collectorのインストール・設定は、あとで手動で行うため、Terraformには含めていません。
コード
terraform {
  required_version = ">= 1.9"

  required_providers {
    aws = {
      source  = "hashicorp/aws"
      version = "~> 6.58"
    }
  }
}

provider "aws" {
  region = var.aws_region
}
variable "aws_region" {
  description = "AWS region to deploy resources into"
  type        = string
  default     = "ap-northeast-1"
}

variable "vpc_cidr" {
  description = "CIDR block for the Before-configuration VPC"
  type        = string
  default     = "10.10.0.0/16"
}

variable "public_subnet_cidr" {
  description = "CIDR block for the public subnet"
  type        = string
  default     = "10.10.0.0/24"
}

variable "instance_type" {
  description = "EC2 instance type for both the target and collector instances"
  type        = string
  default     = "t3.micro"
}
data "aws_availability_zones" "available" {
  state = "available"
}

data "aws_ssm_parameter" "al2023" {
  name = "/aws/service/ami-amazon-linux-latest/al2023-ami-kernel-default-x86_64"
}

# --- Networking ---

resource "aws_vpc" "this" {
  cidr_block           = var.vpc_cidr
  enable_dns_support   = true
  enable_dns_hostnames = true

  tags = {
    Name = "cw-prometheus-collector-before"
  }
}

resource "aws_internet_gateway" "this" {
  vpc_id = aws_vpc.this.id

  tags = {
    Name = "cw-prometheus-collector-before"
  }
}

resource "aws_subnet" "public" {
  vpc_id                  = aws_vpc.this.id
  cidr_block              = var.public_subnet_cidr
  availability_zone       = data.aws_availability_zones.available.names[0]
  map_public_ip_on_launch = true

  tags = {
    Name = "cw-prometheus-collector-before-public"
  }
}

resource "aws_route_table" "public" {
  vpc_id = aws_vpc.this.id

  route {
    cidr_block = "0.0.0.0/0"
    gateway_id = aws_internet_gateway.this.id
  }

  tags = {
    Name = "cw-prometheus-collector-before-public"
  }
}

resource "aws_route_table_association" "public" {
  subnet_id      = aws_subnet.public.id
  route_table_id = aws_route_table.public.id
}

# --- Security groups ---
# SSM Session Manager is reached over HTTPS via the internet gateway, so no
# inbound SSH rule is required on either security group.

resource "aws_security_group" "collector" {
  name        = "collector-sg"
  description = "ADOT collector instance - outbound only (SSM + CloudWatch OTLP)"
  vpc_id      = aws_vpc.this.id

  egress {
    description = "Allow all outbound"
    from_port   = 0
    to_port     = 0
    protocol    = "-1"
    cidr_blocks = ["0.0.0.0/0"]
  }

  tags = {
    Name = "collector-sg"
  }
}

resource "aws_security_group" "target" {
  name        = "target-sg"
  description = "Node exporter target, scraped by the collector instance"
  vpc_id      = aws_vpc.this.id

  egress {
    description = "Allow all outbound"
    from_port   = 0
    to_port     = 0
    protocol    = "-1"
    cidr_blocks = ["0.0.0.0/0"]
  }

  tags = {
    Name = "target-sg"
  }
}

resource "aws_security_group_rule" "target_ingress_from_collector" {
  type                     = "ingress"
  from_port                = 9100
  to_port                  = 9100
  protocol                 = "tcp"
  security_group_id        = aws_security_group.target.id
  source_security_group_id = aws_security_group.collector.id
  description              = "Allow Prometheus scrape from the collector instance"
}

# --- IAM ---

data "aws_iam_policy_document" "ec2_assume_role" {
  statement {
    actions = ["sts:AssumeRole"]

    principals {
      type        = "Service"
      identifiers = ["ec2.amazonaws.com"]
    }
  }
}

resource "aws_iam_role" "target" {
  name               = "cw-prometheus-collector-before-target"
  assume_role_policy = data.aws_iam_policy_document.ec2_assume_role.json
}

resource "aws_iam_role_policy_attachment" "target_ssm" {
  role       = aws_iam_role.target.name
  policy_arn = "arn:aws:iam::aws:policy/AmazonSSMManagedInstanceCore"
}

resource "aws_iam_instance_profile" "target" {
  name = "cw-prometheus-collector-before-target"
  role = aws_iam_role.target.name
}

resource "aws_iam_role" "collector" {
  name               = "cw-prometheus-collector-before-collector"
  assume_role_policy = data.aws_iam_policy_document.ec2_assume_role.json
}

resource "aws_iam_role_policy_attachment" "collector_ssm" {
  role       = aws_iam_role.collector.name
  policy_arn = "arn:aws:iam::aws:policy/AmazonSSMManagedInstanceCore"
}

data "aws_iam_policy_document" "collector_cloudwatch_otlp" {
  statement {
    actions   = ["cloudwatch:PutMetricData"]
    resources = ["*"]
  }
}

resource "aws_iam_role_policy" "collector_cloudwatch_otlp" {
  name   = "cloudwatch-otlp-put-metric-data"
  role   = aws_iam_role.collector.id
  policy = data.aws_iam_policy_document.collector_cloudwatch_otlp.json
}

resource "aws_iam_instance_profile" "collector" {
  name = "cw-prometheus-collector-before-collector"
  role = aws_iam_role.collector.name
}

# --- EC2 instances ---
# Node Exporter and the ADOT Collector are installed and configured manually
# after apply, over SSM Session Manager.

resource "aws_instance" "target" {
  ami                         = data.aws_ssm_parameter.al2023.value
  instance_type               = var.instance_type
  subnet_id                   = aws_subnet.public.id
  vpc_security_group_ids      = [aws_security_group.target.id]
  iam_instance_profile        = aws_iam_instance_profile.target.name
  associate_public_ip_address = true

  tags = {
    Name = "before-target"
  }
}

resource "aws_instance" "collector" {
  ami                         = data.aws_ssm_parameter.al2023.value
  instance_type               = var.instance_type
  subnet_id                   = aws_subnet.public.id
  vpc_security_group_ids      = [aws_security_group.collector.id]
  iam_instance_profile        = aws_iam_instance_profile.collector.name
  associate_public_ip_address = true

  tags = {
    Name = "before-collector"
  }
}
output "vpc_id" {
  value = aws_vpc.this.id
}

output "target_instance_id" {
  value = aws_instance.target.id
}

output "collector_instance_id" {
  value = aws_instance.collector.id
}

output "target_private_ip" {
  value = aws_instance.target.private_ip
}
リソースを作ったらターゲット用のインスタンスにSSM接続し、Node Exporterをインストールして起動します。
sudo useradd --no-create-home --shell /usr/sbin/nologin node_exporter

cd /tmp
curl -LO https://github.com/prometheus/node_exporter/releases/download/v1.8.2/node_exporter-1.8.2.linux-amd64.tar.gz
tar xvf node_exporter-1.8.2.linux-amd64.tar.gz
sudo cp node_exporter-1.8.2.linux-amd64/node_exporter /usr/local/bin/
sudo chown node_exporter:node_exporter /usr/local/bin/node_exporter

sudo tee /etc/systemd/system/node_exporter.service <<'UNIT'
[Unit]
Description=Node Exporter
After=network.target

[Service]
User=node_exporter
ExecStart=/usr/local/bin/node_exporter

[Install]
WantedBy=multi-user.target
UNIT

sudo systemctl daemon-reload
sudo systemctl enable --now node_exporter

# 動作確認
curl -s http://localhost:9100/metrics | head
続いて、コレクター用のインスタンスにADOT Collectorをインストールし、Node Exporterをスクレイプ→CloudWatch OTLPエンドポイントへsigv4署名付きで送信する設定を書きます。
cd /tmp
curl -LO https://aws-otel-collector.s3.amazonaws.com/amazon_linux/amd64/latest/aws-otel-collector.rpm
sudo rpm -Uvh ./aws-otel-collector.rpm

sudo mkdir -p /opt/aws/aws-otel-collector/etc
sudo tee /opt/aws/aws-otel-collector/etc/config.yaml <<CONFIG
receivers:
  prometheus:
    config:
      scrape_configs:
        - job_name: 'ec2-node-exporter'
          scrape_interval: 60s
          static_configs:
            - targets: ['<target-private-ip>:9100']

processors:
  batch:
    send_batch_size: 200
    timeout: 10s

exporters:
  otlphttp:
    metrics_endpoint: "https://monitoring.<region>.amazonaws.com/v1/metrics"
    auth:
      authenticator: sigv4auth

extensions:
  sigv4auth:
    service: "monitoring"
    region: "<region>"

service:
  extensions: [sigv4auth]
  pipelines:
    metrics:
      receivers: [prometheus]
      processors: [batch]
      exporters: [otlphttp]
CONFIG

sudo /opt/aws/aws-otel-collector/bin/aws-otel-collector-ctl -c /opt/aws/aws-otel-collector/etc/config.yaml -a start

# 状態確認
sudo /opt/aws/aws-otel-collector/bin/aws-otel-collector-ctl -a status
※ <XXX>の値は実際の値に置き換えてください
結果を確認する
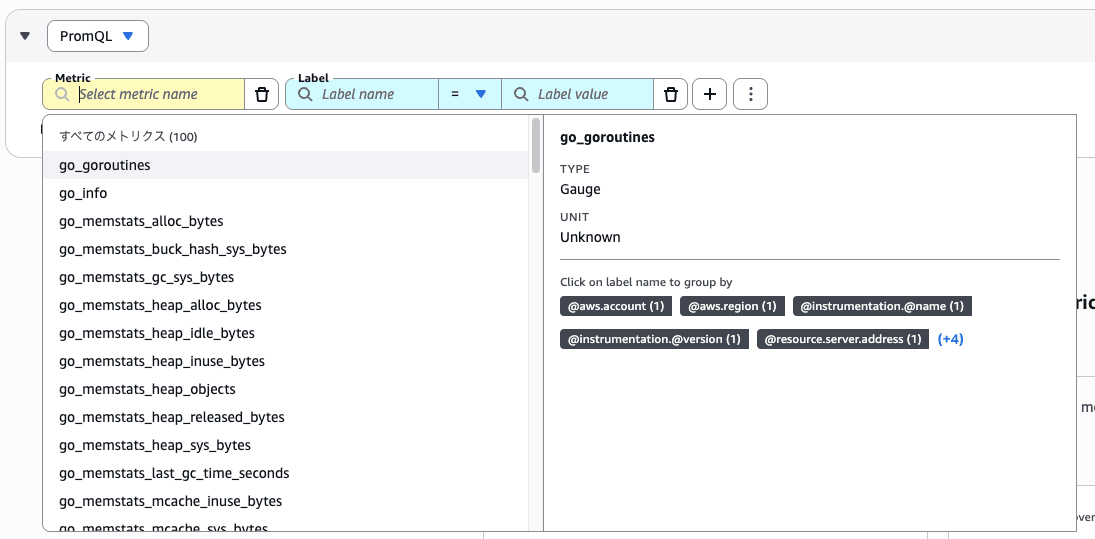
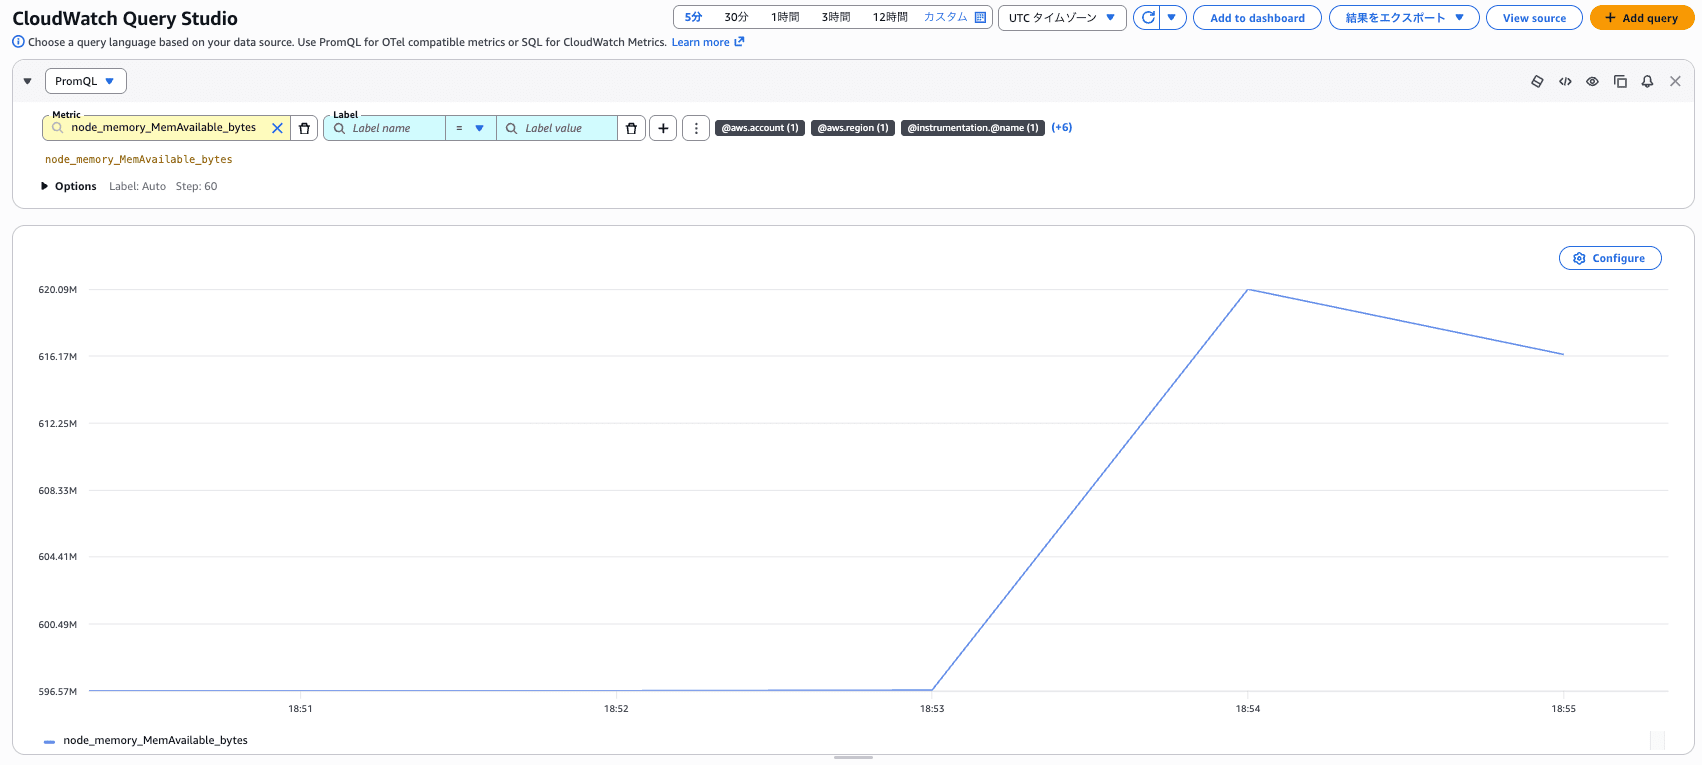
CloudWatch Query Studioを開き、PromQLで確認したところ、Node Exporterが公開するメトリクスがきちんとCloudWatchに届いています。
ちなみにCloudWatchのPromQLでは、OTLPで取り込んだメトリクスに@aws.accountや@aws.regionのようなAWS由来のラベルが自動で付与されます。
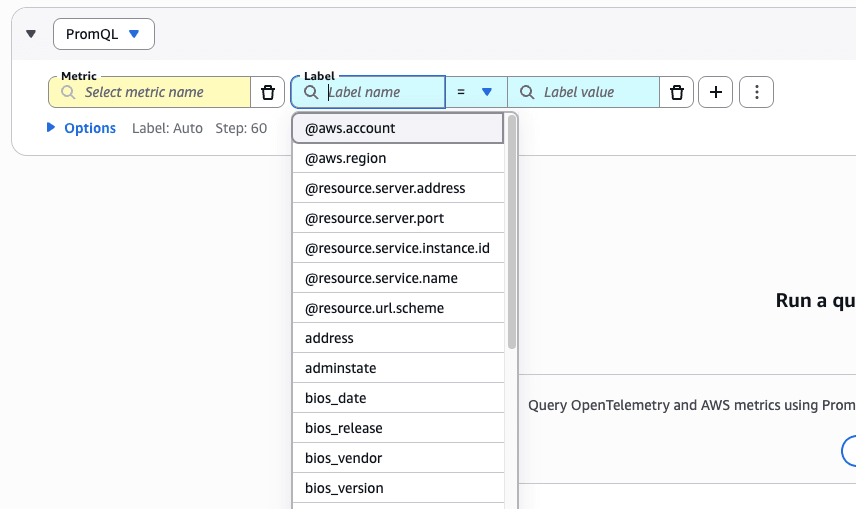
これは「AWS resource enrichment」と呼ばれる仕組みで、収集したメトリクスにアカウントIDやリージョンなどの情報を自動で埋め込んでくれるため、PromQLの絞り込みやグルーピングに使えます。
マネージド構成:CloudWatch Managed Prometheus collectorをセットアップ
マネージド構成は、自前構成のコレクターを丸ごとAWSに任せる構成です。
「どこを・どのくらいの頻度でスクレイプするか」というスクレイプ設定と、接続先のVPC情報をスクレイパーに設定するだけで、あとはAWSがプロビジョニング・スケーリング・収集処理を行ってくれます。
また指定したサブネットごとにENI(Elastic Network Interface)が自動で作られ、そのENI経由でOTLPプロトコルによるスクレイプが行われます。
Terraformコード
自前構成との違いはコレクター用のインスタンスが不要な点、またtarget-sgのingressルールが自己参照になっている点です。
マネージドコレクターが作るENIも同じtarget-sgを持つため、「target-sg自身からのTCP 9100を許可する」というルールにしておくことで、collector用のセキュリティグループを別途作らずに済んでいます。
またスクレイパー本体(Managed Collector)はTerraformではなく、AWS CLIで作成します。
コード
terraform {
  required_version = ">= 1.9"

  required_providers {
    aws = {
      source  = "hashicorp/aws"
      version = "~> 6.58"
    }
  }
}

provider "aws" {
  region = var.aws_region
}
variable "aws_region" {
  description = "AWS region to deploy resources into"
  type        = string
  default     = "ap-northeast-1"
}

variable "vpc_cidr" {
  description = "CIDR block for the After-configuration VPC"
  type        = string
  default     = "10.20.0.0/16"
}

variable "instance_type" {
  description = "EC2 instance type for the target instance"
  type        = string
  default     = "t3.micro"
}
data "aws_availability_zones" "available" {
  state = "available"
}

data "aws_ssm_parameter" "al2023" {
  name = "/aws/service/ami-amazon-linux-latest/al2023-ami-kernel-default-x86_64"
}

data "aws_caller_identity" "current" {}

# --- Networking ---
# The managed collector's VPC source requires subnets in at least two
# different availability zones, so two public subnets are created even
# though only one of them hosts an EC2 instance.

resource "aws_vpc" "this" {
  cidr_block           = var.vpc_cidr
  enable_dns_support   = true
  enable_dns_hostnames = true

  tags = {
    Name = "cw-prometheus-collector-after"
  }
}

resource "aws_internet_gateway" "this" {
  vpc_id = aws_vpc.this.id

  tags = {
    Name = "cw-prometheus-collector-after"
  }
}

resource "aws_subnet" "public" {
  for_each = { for idx, az in slice(data.aws_availability_zones.available.names, 0, 2) : tostring(idx) => az }

  vpc_id                  = aws_vpc.this.id
  cidr_block              = cidrsubnet(var.vpc_cidr, 8, tonumber(each.key))
  availability_zone       = each.value
  map_public_ip_on_launch = true

  tags = {
    Name = "cw-prometheus-collector-after-public-${each.key}"
  }
}

resource "aws_route_table" "public" {
  vpc_id = aws_vpc.this.id

  route {
    cidr_block = "0.0.0.0/0"
    gateway_id = aws_internet_gateway.this.id
  }

  tags = {
    Name = "cw-prometheus-collector-after-public"
  }
}

resource "aws_route_table_association" "public" {
  for_each = aws_subnet.public

  subnet_id      = each.value.id
  route_table_id = aws_route_table.public.id
}

# --- Security group ---
# The managed collector creates its ENIs using this same security group, so
# the ingress rule below is self-referencing rather than pointing at a
# separate collector security group.

resource "aws_security_group" "target" {
  name        = "target-sg"
  description = "Node exporter target, also attached to the managed collector ENIs"
  vpc_id      = aws_vpc.this.id

  egress {
    description = "Allow all outbound"
    from_port   = 0
    to_port     = 0
    protocol    = "-1"
    cidr_blocks = ["0.0.0.0/0"]
  }

  tags = {
    Name = "target-sg"
  }
}

resource "aws_security_group_rule" "target_ingress_self" {
  type                     = "ingress"
  from_port                = 9100
  to_port                  = 9100
  protocol                 = "tcp"
  security_group_id        = aws_security_group.target.id
  source_security_group_id = aws_security_group.target.id
  description              = "Allow scrape from the managed collector ENIs (same security group)"
}

# --- IAM ---
# Only the target instance needs an IAM role you manage (for SSM). The
# managed collector's own execution role is created automatically by
# CreateScraper.

data "aws_iam_policy_document" "ec2_assume_role" {
  statement {
    actions = ["sts:AssumeRole"]

    principals {
      type        = "Service"
      identifiers = ["ec2.amazonaws.com"]
    }
  }
}

resource "aws_iam_role" "target" {
  name               = "cw-prometheus-collector-after-target"
  assume_role_policy = data.aws_iam_policy_document.ec2_assume_role.json
}

resource "aws_iam_role_policy_attachment" "target_ssm" {
  role       = aws_iam_role.target.name
  policy_arn = "arn:aws:iam::aws:policy/AmazonSSMManagedInstanceCore"
}

resource "aws_iam_instance_profile" "target" {
  name = "cw-prometheus-collector-after-target"
  role = aws_iam_role.target.name
}

# --- EC2 target instance ---
# Node Exporter is installed and configured manually after apply, over SSM
# Session Manager.

resource "aws_instance" "target" {
  ami                         = data.aws_ssm_parameter.al2023.value
  instance_type               = var.instance_type
  subnet_id                   = aws_subnet.public["0"].id
  vpc_security_group_ids      = [aws_security_group.target.id]
  iam_instance_profile        = aws_iam_instance_profile.target.name
  associate_public_ip_address = true

  tags = {
    Name = "after-target"
  }
}

# The CloudWatch managed Prometheus collector (scraper) itself is created with
# the AWS CLI, not Terraform. See README.md for the exact `aws amp
# create-scraper` command, built from the outputs below.
output "vpc_id" {
  value = aws_vpc.this.id
}

output "target_instance_id" {
  value = aws_instance.target.id
}

output "target_private_ip" {
  value = aws_instance.target.private_ip
}

# The following outputs feed directly into the `aws amp create-scraper`
# command.

output "public_subnet_ids" {
  value = [for s in aws_subnet.public : s.id]
}

output "target_security_group_id" {
  value = aws_security_group.target.id
}

output "account_id" {
  value = data.aws_caller_identity.current.account_id
}
リソースを作ったらターゲット用のインスタンスにSSM接続し、Node Exporterをインストールして起動します。
sudo useradd --no-create-home --shell /usr/sbin/nologin node_exporter

cd /tmp
curl -LO https://github.com/prometheus/node_exporter/releases/download/v1.8.2/node_exporter-1.8.2.linux-amd64.tar.gz
tar xvf node_exporter-1.8.2.linux-amd64.tar.gz
sudo cp node_exporter-1.8.2.linux-amd64/node_exporter /usr/local/bin/
sudo chown node_exporter:node_exporter /usr/local/bin/node_exporter

sudo tee /etc/systemd/system/node_exporter.service <<'UNIT'
[Unit]
Description=Node Exporter
After=network.target

[Service]
User=node_exporter
ExecStart=/usr/local/bin/node_exporter

[Install]
WantedBy=multi-user.target
UNIT

sudo systemctl daemon-reload
sudo systemctl enable --now node_exporter

# 動作確認
curl -s http://localhost:9100/metrics | head
あとはスクレイプ設定ファイルを用意してAWS CLIでスクレイパーを作るだけです。
global:
  scrape_interval: 60s

scrape_configs:
  - job_name: 'ec2-node-exporter'
    static_configs:
      - targets:
          - '<targetのプライベートIP>:9100'
aws amp create-scraper \
  --alias "cw-prometheus-collector-after" \
  --source '{
    "vpcConfiguration": {
      "subnetIds": ["<subnet-id-1>", "<subnet-id-2>"],
      "securityGroupIds": ["<sg-id>"]
    }
  }' \
  --scrape-configuration configurationBlob=$(cat scrape-config.yaml | base64 -w 0) \
  --destination '{
    "cloudWatchConfiguration": {
      "datasetArn": "arn:aws:cloudwatch:<region>:<account-id>:dataset/default"
    }
  }'
※ <XXX>の値は実際の値に置き換えてください
なお作成直後はdescribe-scraperで確認するとstatusCodeがCREATINGのままで、少し時間がかかりました。
aws amp describe-scraper --scraper-id <scraper-id> --query 'scraper.status'
{
    "statusCode": "CREATING"
}
その後5分〜10分ほど待って再度確認すると、ACTIVEに切り替わっていました。
{
    "statusCode": "ACTIVE"
}
CloudWatch Query Studioで確認すると、こちらもきちんとメトリクスが届いています。
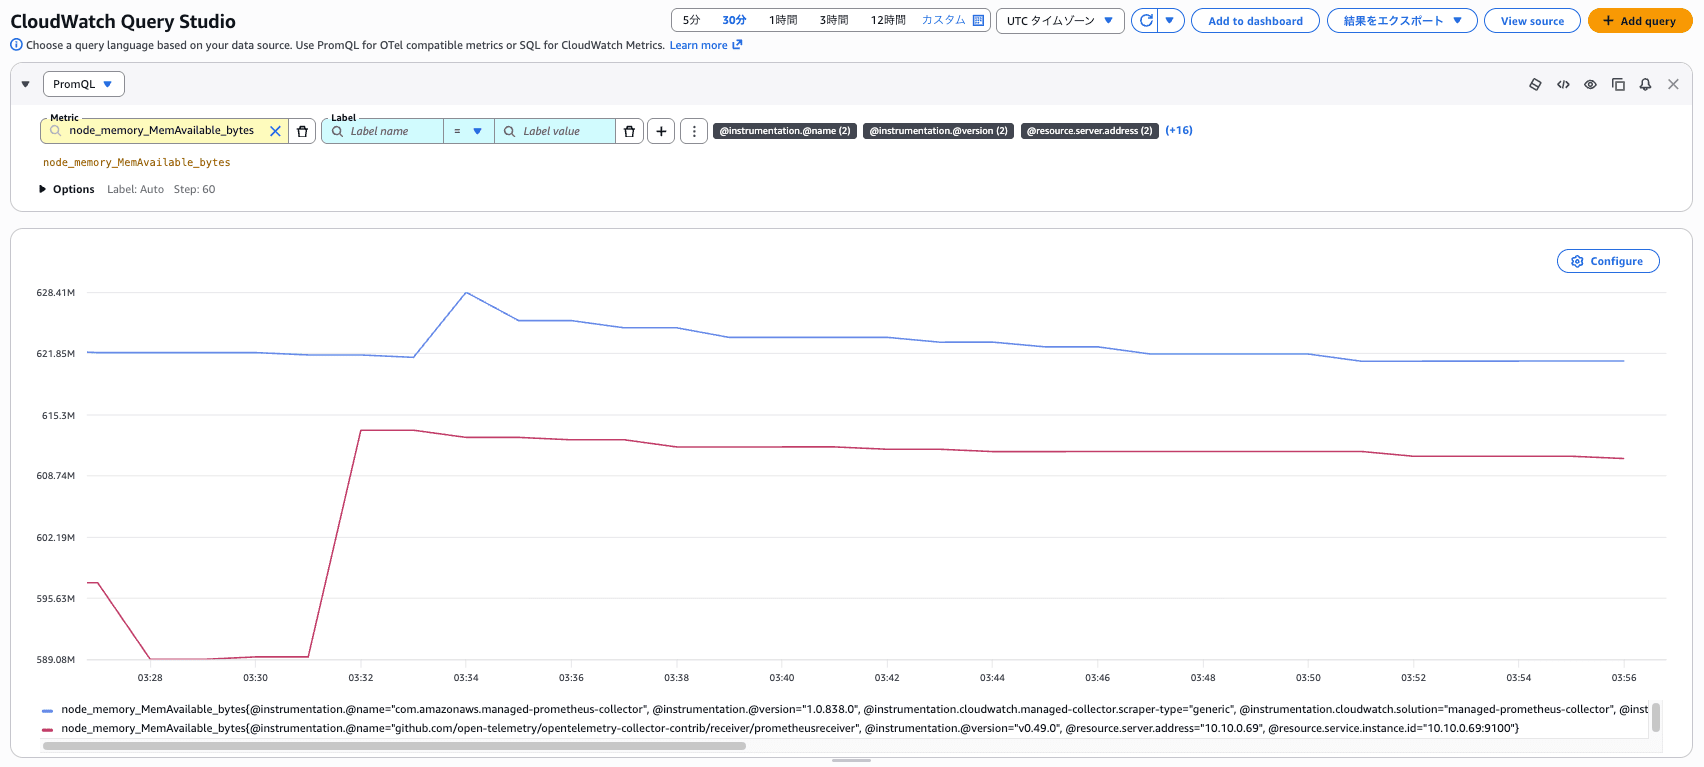
また@instrumentation.@nameラベルで収集経路も判別できそうです。
github.com/open-telemetry/opentelemetry-collector-contrib/receiver/prometheusreceiver(v0.49.0)- 自前構成側、自前で建てたADOT Collectorから届いたデータ
com.amazonaws.managed-prometheus-collector- マネージド構成側、CloudWatch Managed Prometheus collectorから届いたデータ
まとめ
最後に、自前構成とマネージド構成で何が変わったかを表にまとめます。
| 観点 | 自前構成(自前ADOT Collector) | マネージド構成(Managed Collector) |
|---|---|---|
| コレクター | 自前で管理する | AWS管理(マネージドコレクターがスクレイプ) |
| セットアップ作業 | パッケージインストール、config.yaml作成、プロセス起動・監視 | スクレイプ設定ファイル作成 + API呼び出し1回 |
| スケーリング・パッチ適用 | 自分で対応 | AWSが対応 |
| 配信先 | CloudWatch OTLPエンドポイント(sigv4署名) |
CloudWatch dataset(cloudWatchConfiguration) |
さいごに
以上、Amazon CloudWatch managed Prometheus collectorsを実際に試してみた話でした。
従来に比べて自前でコレクターを管理しなくてもいいのは便利でいいですね。
Prometheusメトリクスの収集方法を検討している方の参考になれば幸いです。