
I Tried Out the Performance Monitor in Amazon CloudWatch Network Monitoring

This page has been translated by machine translation. View original
Introduction
On 2026-11-18, the Performance Monitor for Amazon CloudWatch Network Monitoring was announced.
With the Performance Monitor, you can check whether the AWS network your workloads traverse is healthy, using the console screens or CloudWatch metrics, without installing any software such as an agent. The outputs are per-path latency, impact score, and traffic volume within a VPC. In this article, I created a monitor with the AWS CLI and checked the values in order: the console screen, CloudWatch metrics, and the TOP_PATHS query. I then injected latency into an EC2 instance and checked how the monitor reacted.
Test environment
| Item | Details |
|---|---|
| Region | ap-northeast-1 |
| AWS CLI | aws-cli/2.41.1 |
| VPC | Default VPC (172.31.0.0/16) |
| EC2 | t4g.micro × 2 (Amazon Linux 2023 arm64), one each in ap-northeast-1a and 1c |
| AZ name to AZ ID mapping | 1a = apne1-az4, 1c = apne1-az1 |
| Security group | Default (allows all traffic within the same group) |
| Command execution | SSM Run Command (root) |
Supported Regions can be checked in the following documentation.
So that paths would appear, I sent traffic between the two EC2 instances and from each EC2 instance to S3. On both instances, I ran the following script with the other instance's private IP as the argument.
traffic.sh
#!/bin/bash
# usage: traffic.sh <peer-private-ip>
# Run on both instances. Starts TCP(8080)/UDP(9999) servers and a loop that sends traffic to the peer and to S3.
PEER=$1
mkdir -p /tmp/www && dd if=/dev/urandom of=/tmp/www/blob bs=1M count=5 status=none
cat > /tmp/udp_echo.py <<'PY'
import socket
s=socket.socket(socket.AF_INET,socket.SOCK_DGRAM); s.bind(("0.0.0.0",9999))
while True:
    d,a=s.recvfrom(2048); s.sendto(d,a)
PY
cat > /tmp/udp_send.py <<'PY'
import socket,sys
s=socket.socket(socket.AF_INET,socket.SOCK_DGRAM); s.settimeout(1)
for i in range(20):
    s.sendto(b"x"*400,(sys.argv[1],9999))
    try: s.recvfrom(2048)
    except Exception: pass
PY
cat > /tmp/loop.sh <<LOOP
#!/bin/bash
while true; do
  ping -c 3 -s 512 $PEER >/dev/null 2>&1
  curl -s -m 20 -o /dev/null http://$PEER:8080/blob
  python3 /tmp/udp_send.py $PEER
  curl -s -m 10 -o /dev/null https://s3.ap-northeast-1.amazonaws.com/
  sleep 5
done
LOOP
chmod +x /tmp/loop.sh
systemd-run --unit=pm-http --working-directory=/tmp/www python3 -m http.server 8080
systemd-run --unit=pm-udp python3 /tmp/udp_echo.py
systemd-run --unit=pm-loop /tmp/loop.sh
During 17:49 to 18:38, when I sent only ICMP echo (ping), no data points had appeared as of the retrieval at 19:17. When I sent only UDP, they did appear. To get path data, you need to send traffic other than ping.
Creating the monitor
Creation command
Pass the VPC ARN as JSON to --targets.
aws networkflowmonitor create-performance-monitor --monitor-name pm-verify-monitor --targets '[{"type":"AWS::EC2::VPC","identifier":"arn:aws:ec2:ap-northeast-1:111122223333:vpc/vpc-0a1b2c3d4e5f67890"}]'
{
    "monitorArn": "arn:aws:networkflowmonitor:ap-northeast-1:111122223333:performancemonitor/pm-verify-monitor",
    "monitorStatus": "PENDING",
    "monitorType": "VPC"
}
When I created the first monitor, the service-linked role AWSServiceRoleForNetworkFlowMonitor and a scope were created automatically. The scope covers only my own account and ap-northeast-1.
Initialization timeline
This is the timeline from running the creation command until the first data point could be retrieved. I had been sending traffic since about 30 seconds before creating the monitor.
| Time | Event |
|---|---|
| 17:19:28 | Ran the creation command (PENDING, createdAt is 17:19:30) |
| 17:19:30 | Service-linked role AWSServiceRoleForNetworkFlowMonitor created (CreateDate) |
| 17:34:35 | ACTIVE (modifiedAt) |
| 17:37:07 | list-metrics returns 0 series |
| 17:38:08 | list-metrics returns 35 series |
| 17:38:33 | get-metric-data retrieved 5 points for 17:20–17:24 |
The monitor became ACTIVE about 15 minutes after the creation command was run. Series appeared in list-metrics between 17 minutes 39 seconds and 18 minutes 40 seconds after the creation command was run. All of these times are values from a single observation.
The initialization documentation says that creating the initial topology and completing initialization can take 20 to 30 minutes. The time until ACTIVE was shorter than this description.
Data point publication timing
The first data points retrievable with get-metric-data (Period 60) at 17:38:33 were the 5 points for 17:20–17:24. After that, when I retrieved data about every 100 seconds, data points increased in batches of 5 points (5 minutes' worth). In the retrievals from 17:38 to 18:07, the difference between the retrieval time and the timestamp of the latest data point was about 13 to 18 minutes.
Console screen
This is the screen of the monitor created at 22:00 for the latency test described later. At the top of the Overview tab, the overall "AWS network health impact level" of the monitor ("Normal") and the monitoring status ("Active") are shown. In the network path list below, the columns are network path, path type (inter-AZ, AZ-S3, inter-Region, AWS service, internet), network health impact, P95 latency, traffic volume, bytes in, bytes out, VPC, and account.
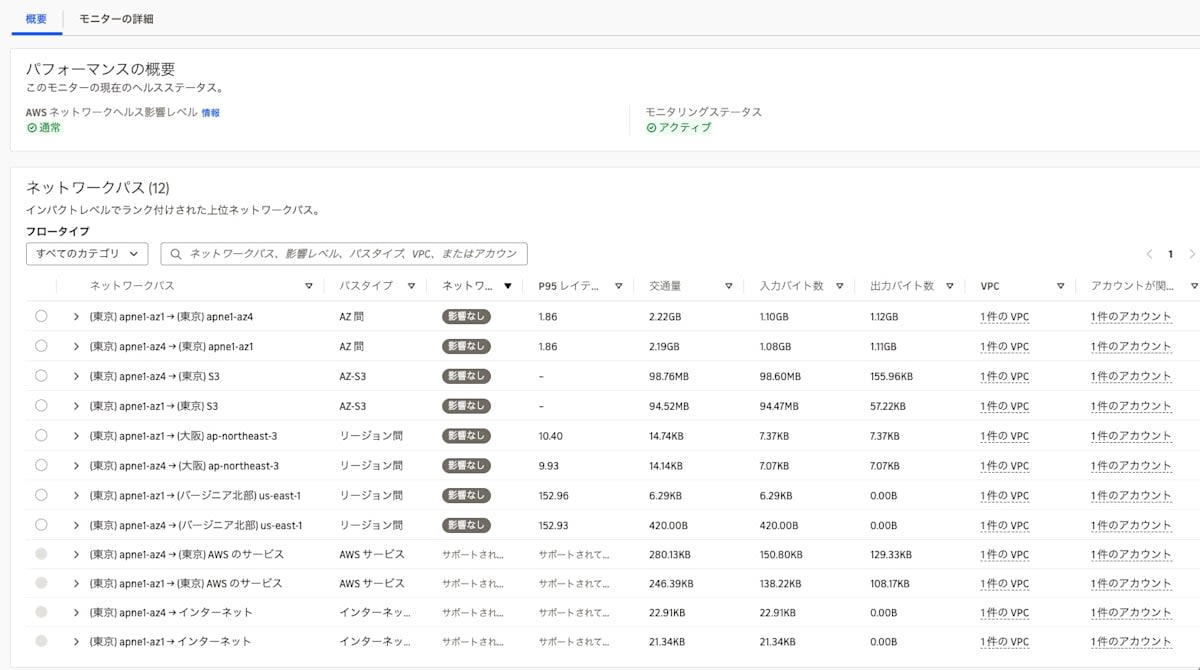
The inter-AZ path had a P95 latency of 1.86 and an impact of "No impact". By comparing the bytes in and bytes out on the screen with the cumulative totals of CloudWatch BytesIn and BytesOut, I estimated that this screen showed data up to around 22:24.
CloudWatch metrics
Dimensions
aws cloudwatch list-metrics --namespace AWS/NetworkFlowMonitor
Here is an excerpt of one BytesIn element from the Metrics in the response.
{
    "Namespace": "AWS/NetworkFlowMonitor",
    "MetricName": "BytesIn",
    "Dimensions": [
        {
            "Name": "RemoteLocation",
            "Value": "apne1-az1"
        },
        {
            "Name": "LocalLocation",
            "Value": "apne1-az4"
        },
        {
            "Name": "MonitorId",
            "Value": "pm-verify-monitor"
        }
    ]
}
In all series, there were three dimensions: MonitorId, LocalLocation, and RemoteLocation. AZ values are recorded as AZ IDs (apne1-az4), not AZ names (ap-northeast-1a). The mapping to AZ names is in the table in "Test environment". There is no subnet dimension; subnet-level information is obtained from subnet_paths in TOP_PATHS.
Metrics by path type
Summarizing the results of list-metrics run at 19:17 (58 series) by type of RemoteLocation gives the following.
| Type of RemoteLocation | Metrics that appeared |
|---|---|
| Other AZ, other Regions (ap-northeast-3, us-east-1, us-east-2, eu-west-2) | ImpactScore, RoundTripTimeMs, RoundTripTimeP95Ms, BytesIn, BytesOut |
| Other Region (us-gov-west-1) | ImpactScore, BytesIn, BytesOut |
| Services in the same Region (ap-northeast-1) | ImpactScore, BytesIn, BytesOut |
| Internet | BytesIn, BytesOut |
In TOP_PATHS, S3 and EC2 are split into separate rows by remote_service_type. CloudWatch dimensions have nothing corresponding to remote_service_type, and the RemoteLocation for paths to S3 is also ap-northeast-1. To see values for S3 only, use TOP_PATHS.
TOP_PATHS query
Running the query
A query is run with three commands: start, check status, and get results.
aws networkflowmonitor start-query-performance-monitor --monitor-name pm-verify-monitor --query-type TOP_PATHS --start-time 2026-11-19T08:07:26Z --end-time 2026-11-19T08:37:26Z
aws networkflowmonitor get-query-status-performance-monitor --monitor-name pm-verify-monitor --query-id <queryId>
aws networkflowmonitor get-query-results-performance-monitor --monitor-name pm-verify-monitor --query-id <queryId>
The status check response is as follows.
{
    "status": "SUCCEEDED"
}
The times specified in the command are in UTC, corresponding to 17:07–17:37 (JST). This query was run at 17:37:26 and returned 11 rows. The first query right after ACTIVE (17:36:49) had a status of SUCCEEDED, but its data was empty. Since status alone does not tell you whether results exist, check the number of rows in data.
Response columns
The fields in the response are the following 14 columns.
local_az_id
local_region
remote_az_id
remote_region
remote_service_type
flow_type
bytes_in
bytes_out
traffic_volume
impact_score
impact_level
rtt_ms_avg
rtt_ms_p95
subnet_paths
The types in fields are bigint, double, and so on, but the values in data are returned as strings. subnet_paths is a JSON string containing the local-side and remote-side subnets, byte counts, and impact_score.
Path types
Here are 5 rows originating from apne1-az4 from the response of the 17:37:26 query (the 6 rows originating from apne1-az1 are omitted). "None" in the table means null.
| flow_type | Destination | bytes_in | bytes_out | impact_score | rtt_ms_avg / rtt_ms_p95 |
|---|---|---|---|---|---|
| INTER_AZ | apne1-az1 | 206692699 | 215625015 | 0.0 | 1.659 / 1.863 |
| AZ_S3 | S3 | 252176 | 60012 | 0.0 | None |
| INTER_REGION | ap-northeast-3 | 1444 | 1444 | 0.0 | 8.838 / 9.968 |
| AZ_OTHER_SERVICE | EC2 | 19599 | 16441 | None | None |
| INTERNET | None | 3249 | 0 | None | None |
Reaction when latency is injected
To see whether ImpactScore and RoundTripTimeMs react to latency, I injected latency inside the EC2 guest OS and sent traffic.
How latency was applied
I created the monitor at 22:00:07 and sent traffic mixing TCP, UDP, and ICMP between the EC2 instances. I used a script based on traffic.sh with the curl to S3 removed and a step added to record the ping RTT.
I applied tc netem delay only to traffic from the 1a EC2 instance destined for the IP of the 1c EC2 instance. The times at which the delay was changed are as follows.
| Time | Delay |
|---|---|
| 22:31:09 | Start at 10 ms. Increase by 10 ms every minute |
| 23:00:09 | 300 ms |
| 23:01:09 | 0 ms |
| 23:11:09 | 1000 ms |
| 23:21:09 | Remove the delay and stop the traffic |
Delay configuration commands
On the 1a EC2 instance, I ran these with PEER set to the private IP of the 1c EC2 instance. Only traffic destined for the peer IP goes through band 3, which has netem attached.
dnf install -y iproute-tc
modprobe sch_netem
IF=$(ip -o route get $PEER | sed -n 's/.* dev \([^ ]*\).*/\1/p')
tc qdisc add dev $IF root handle 1: prio bands 3 priomap 0 0 0 0 0 0 0 0 0 0 0 0 0 0 0 0
tc qdisc add dev $IF parent 1:3 handle 30: netem delay 0ms limit 5000
tc filter add dev $IF protocol ip parent 1:0 prio 3 u32 match ip dst $PEER/32 flowid 1:3
The commands to change and remove the delay are as follows.
tc qdisc change dev $IF parent 1:3 handle 30: netem delay 10ms limit 5000
tc qdisc del dev $IF root
The average RTT of the ping from 1a to 1c (5 packets per minute) was around 1.7 ms with no delay, 11.7 ms to 301.7 ms while the delay was increasing, around 1.7 ms during the 0 ms period, and 1001.7 ms during the 1000 ms period. Packet loss was 0% at all points, so the delay took effect as configured.
Monitor reaction
I summarized the values for the apne1-az4 → apne1-az1 path for each delay interval. Period is 60, covering 81 points from 22:00 to 23:20. ImpactScore and RoundTripTimeP95Ms were retrieved as Maximum and RoundTripTimeMs as Average, and the table shows the range of values within each interval. BytesIn was retrieved as Sum, and the table shows the per-minute average within each interval.
| Interval (JST) | Delay | ImpactScore | RoundTripTimeMs | RoundTripTimeP95Ms | BytesIn (per minute) |
|---|---|---|---|---|---|
| 22:00–22:30 | None | 0.0 | 1.656–1.658 | 1.853–1.861 | 43,582,175 |
| 22:31–23:00 | 10 → 300 ms | 0.0 | 1.657 | 1.852–1.861 | 29,143,225 |
| 23:01–23:10 | 0 ms | 0.0 | 1.657 | 1.852–1.856 | 41,856,409 |
| 23:11–23:20 | 1000 ms | 0.0 | 1.657 | 1.855–1.857 | 19,068,985 |
The RTT of the in-guest ping moved from 1.7 ms to 1001.7 ms, but the monitor's RoundTripTimeMs stayed around 1.657 ms, and ImpactScore was 0.0 at all 81 points. BytesIn dropped in intervals with large delay and recovered once the delay was removed. Since the sending loop waits for responses, the traffic volume per minute seems to have decreased because of the delay.
An ImpactScore of 0.0 indicates no impact (None). The unit of RoundTripTimeMs and RoundTripTimeP95Ms is milliseconds, and BytesIn is bytes per minute. The definition of each metric is in the following documentation.
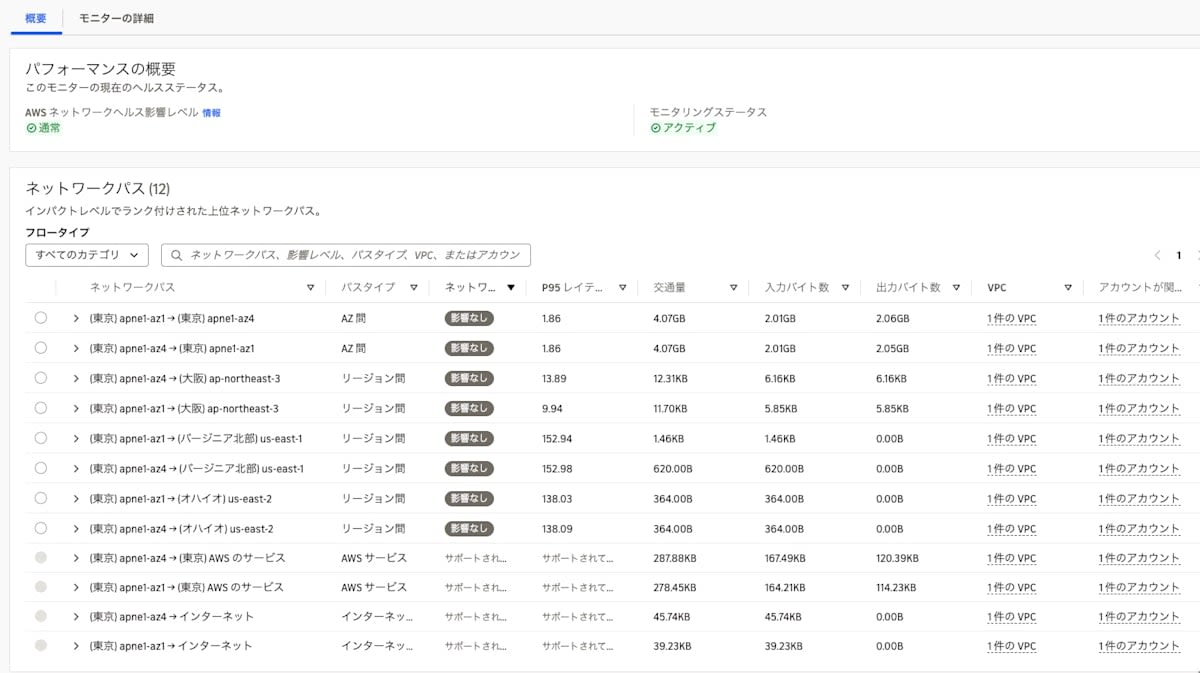
There was also no change on the console screen. The following screen shows data up to around 22:50, which includes the time period from 22:31 when delay of 10–200 ms was being injected. I estimated the point in time shown by comparing the bytes in and bytes out on the screen with the CloudWatch cumulative totals. The inter-AZ path still had a P95 latency of 1.86 and an impact of "No impact".
What is measured
The documentation states that the Performance Monitor measures path health using AWS infrastructure telemetry. Packet loss and latency are evaluated from infrastructure-layer data.
The latency injected inside the guest OS appeared in neither ImpactScore nor RoundTripTimeMs, so it appears to be outside the scope of this measurement. According to the announcement, isolating issues on the application side when the path is healthy is the role of the flow monitor, which installs an agent on EC2 or EKS.
Summary
Just by creating a monitor with a VPC specified, I confirmed that per-path values appear on the console screen and in metrics in the CloudWatch AWS/NetworkFlowMonitor namespace, without any agent.
I could not cause degradation on the AWS network side this time, so I have not confirmed whether ImpactScore rises, but according to the announcement, a path that suddenly degrades gets a high ImpactScore.
If you want to determine whether application latency is caused by degradation of an AWS network path, try the Performance Monitor in Network Monitoring.