Check token usage from the terminal with /usage added in Codex CLI 0.140.0
This page has been translated by machine translation. View original
Hey there! I'm Yuji Nishimura from the Operations Division!
The /usage command, which lets you check token usage from within the TUI, was added in v0.140.0 of OpenAI Codex CLI. Until now, you had to open the OpenAI dashboard in a browser, but now you can check it without leaving the TUI. I tried the /usage command without arguments as well as the 3 subcommands daily / weekly / cumulative, so here's a summary.
What is /usage
/usage is a slash command added to the Codex CLI TUI in PR #27925.
When entered, it asynchronously fetches activity data from the API and displays graphs and summary statistics above the composer. A temporary card is shown while loading, and it does not interfere with streaming responses or other processes.
Trying It Out
Environment
- Codex CLI rust-v0.140.0
- macOS (Apple Silicon)
1. Checking the overview with /usage
Launch the TUI with codex, type /usage in the composer, and press Enter.
The screen displayed after loading is divided into two sections.
Summary Statistics (4 items)
| Item | Content |
|---|---|
| Lifetime | Total lifetime token count |
| Peak | Daily maximum token count |
| Streak | Current consecutive days of use (also shows best record. e.g.: 12d (best 54d)) |
| Longest task | Longest task duration |
Activity Graph
Data for the past 52 weeks is displayed in the same format as GitHub's contributions graph (the so-called "grass"). Days with higher usage appear as darker colored cells. A color palette adapted to the terminal's light/dark theme is used, resulting in colors that are easy to see against the background color.
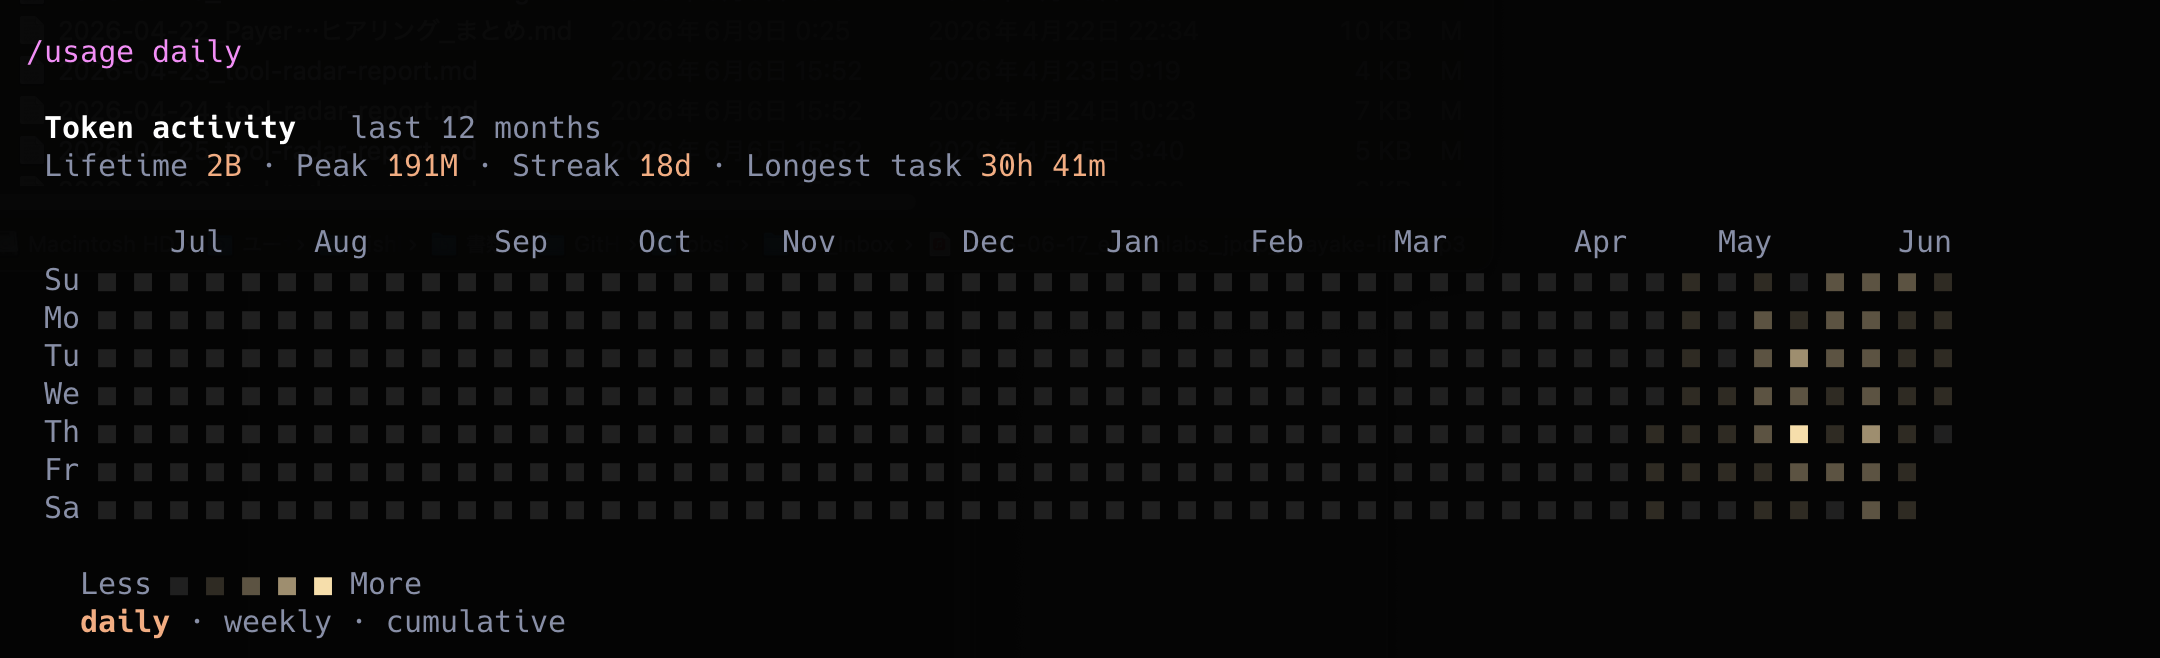
2. Viewing the heatmap with /usage daily
Entering /usage daily displays a heatmap with 7 rows × 52 columns. The vertical axis shows days of the week (Su / Mo / Tu / We / Th / Fr / Sa), the horizontal axis shows weeks, and the display is the same as /usage without arguments.
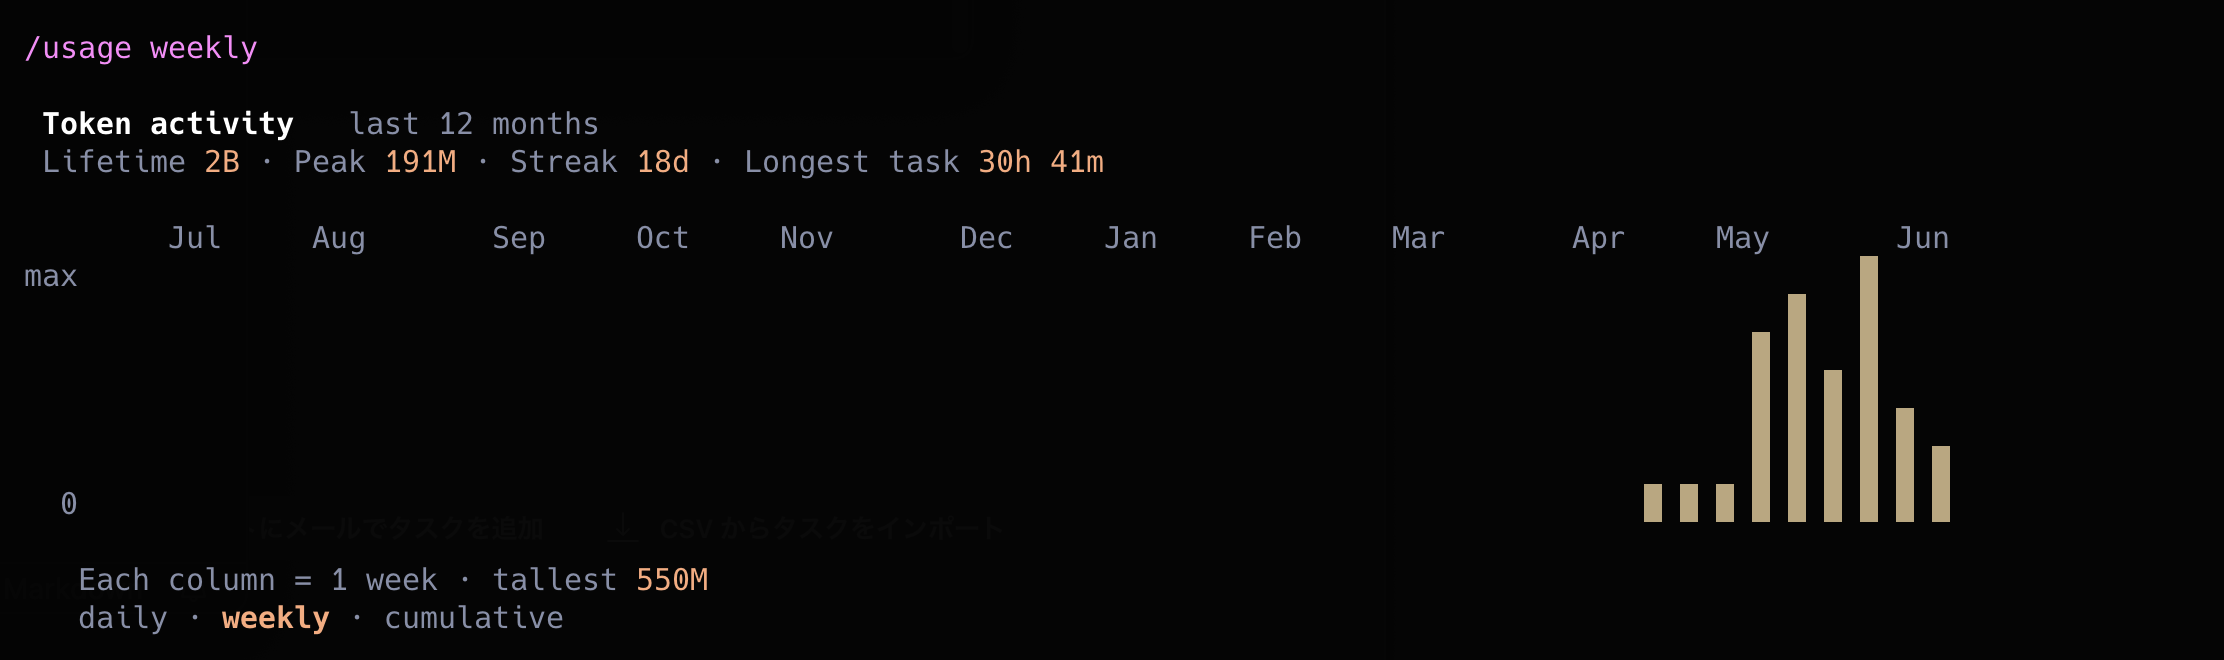
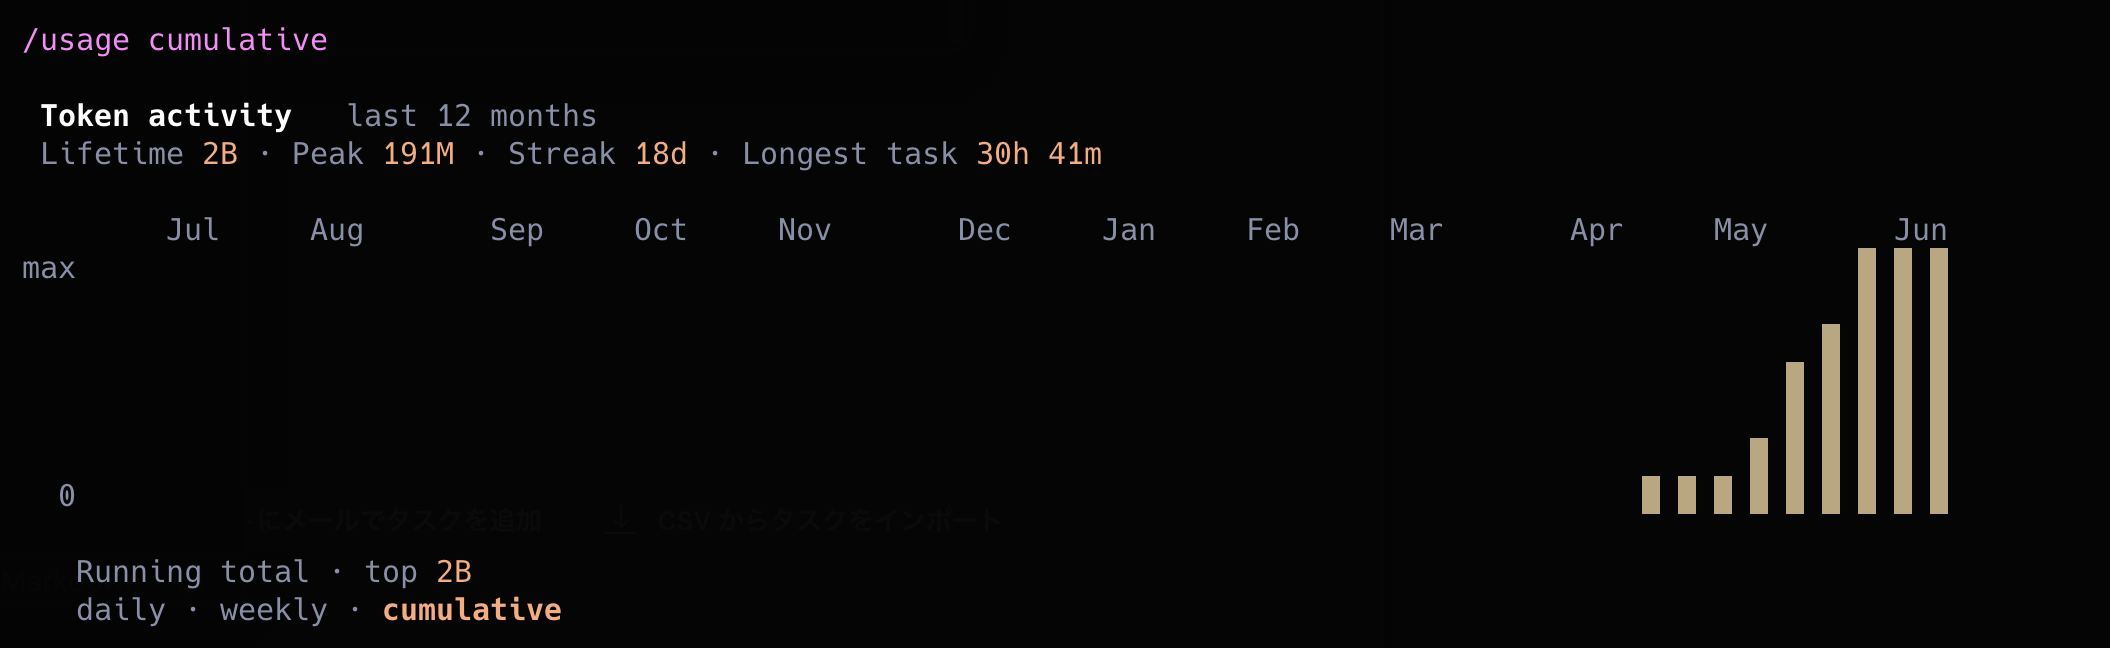
3. /usage weekly and /usage cumulative
/usage weekly displays a weekly bar chart, and /usage cumulative displays a cumulative bar chart.
| Command | Display Format |
|---|---|
/usage (= /usage daily) |
Day-of-week heatmap for 52 weeks |
/usage weekly |
Weekly bar chart |
/usage cumulative |
Cumulative bar chart |
If you want to roughly grasp trends with weekly summaries, /usage weekly seems suitable, and if you want to see the overall picture of usage accumulating, /usage cumulative seems like the better fit.
Impressions After Trying It
Being able to check token usage trends without leaving the terminal is convenient when using Codex as your main tool. The Streak feature, much like GitHub's contributions graph, is designed to give you a sense of "keeping it going," and I found it interesting as a way to visualize usage habits.
Summary
I tried the /usage command in Codex CLI 0.140.0.
- Typing
/usagewithin a TUI session displays an activity graph for the past 52 weeks along with 4 statistics: Lifetime, Peak, Streak, and Longest task - The graph format can be switched using 3 subcommands:
/usage daily,/usage weekly, and/usage cumulative - You can fully understand usage trends directly from the terminal
I hope this is helpful to someone.
Reference Links: