
I tried creating a dashboard from Athena dbt models using dbt Charts

This page has been translated by machine translation. View original
Introduction
I'm Kasama from the Data Business Division.
dbt Charts is a tool that allows you to write dashboards in YAML within a dbt project. It connects to Athena via a dbt profile. In this article, I'd like to use the dbt Charts CLI (dct) to create an order status dashboard from an Amazon Athena + Iceberg dbt project.
Prerequisites
What is dbt Charts?
dbt Charts is a tool for writing dashboards in YAML within a dbt project. A single YAML file is called a board, and you define queries, charts, and layouts in a board. dct reads the board, executes SQL, and dct serve displays it in a browser.
Requirements for using Athena with dct (CLI)
There are two ways for dct to connect to a database.
| Method | Where to write connection settings | Example supported databases |
|---|---|---|
| Direct | Write connection settings such as type: postgres in dbt_charts.yml |
Postgres, Snowflake, BigQuery, Redshift, DuckDB |
| dbt_profile | dbt's profiles.yml. Write only type: dbt_profile and the profile name in dbt_charts.yml |
Athena, SQL Server, ClickHouse, Spark |
With direct connection, the connection settings are fully contained in dbt_charts.yml. With dbt_profile, you can use the connection settings from the profiles.yml already used by dbt. On the Sources page of the web documentation, the connection method for Athena is listed as type: dbt_profile, and the installation is listed as dbt-charts[athena].
The requirements for using Athena with dct are as follows.
| Item | Details |
|---|---|
| Connection | Write type: dbt_profile in dbt_charts.yml |
| Installation | Install with dbt-charts[athena]. The extra athena adds dbt-athena>=1.10,<2.0. |
Test Environment
We use dbt-charts (dct) version 0.9.1, which is the latest release as of October 12, 2026. The list of releases can be found on GitHub.
| Item | Value |
|---|---|
| dbt-charts (dct) | 0.9.1 |
| dbt-core | 1.12.5 |
| dbt-athena | 1.11.1 |
| Region | ap-northeast-1 |
Architecture
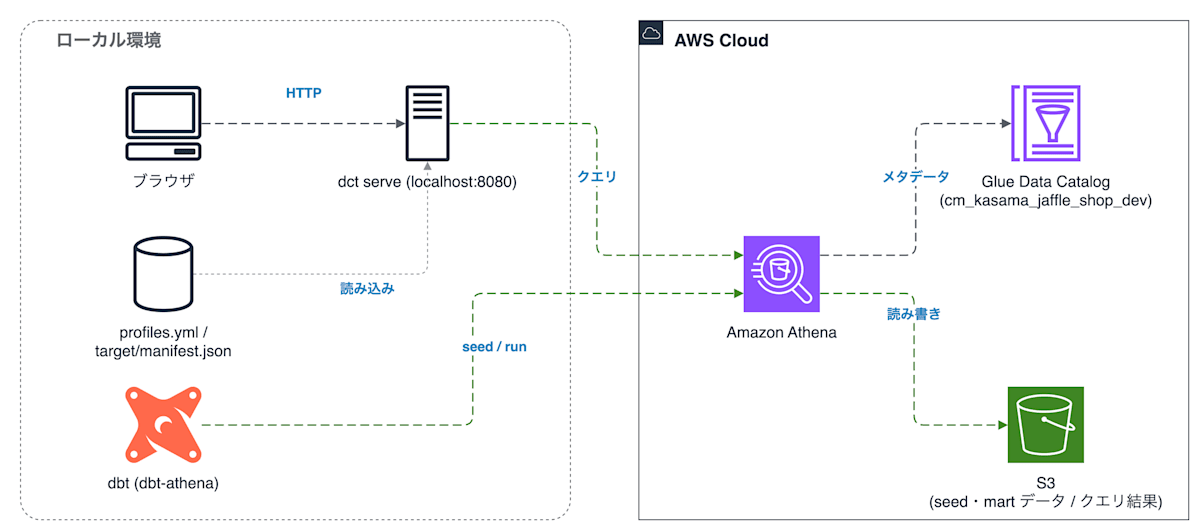
Both dbt and dct are run locally, with roles divided as follows.
- dbt (
dbt build)- Runs seeds and models on Athena, creating tables and views
- Table definitions are saved in Glue Data Catalog, and data is saved in S3
- Generates
target/manifest.json
- dct (dbt Charts)
- Connects to Athena using dbt's
profiles.yml - Reads
target/manifest.jsonand replacesref()in board SQL with table names - Executes SELECT statements written in the board on Athena and turns the results retrieved from tables created by dbt into charts
- Displays the board in a browser with
dct serve
- Connects to Athena using dbt's
The sample data is based on jaffle_shop, published by dbt Labs for dbt demos. jaffle_shop contains customer and order data for a fictional e-commerce site. For this article, we kept the same column structure but reduced the number of rows, and included it as seeds (CSV) in the dbt project.
The dbt models create staging views from seeds, and then create Iceberg tables in the mart from staging.
| mart | Description | Rows |
|---|---|---|
order_status_summary |
Number of orders by status | 5 |
customer_orders |
Number of orders, first order date, last order date per customer | 10 |
dct displays one board to check order status on a single screen. The board lists total order count, daily order count, count by status, and an order list by customer. Table joins are handled in the dbt mart, so the board SQL only reads from order_status_summary, customer_orders, and stg_orders.
Implementation
The implementation code is stored on GitHub.
73_dbt_charts_athena/
├── cfn/
│   └── datastore.yaml              # S3 bucket and Glue Database
├── docs/
│   └── architecture.drawio         # Architecture diagram
└── dbt/
    ├── pyproject.toml              # dbt-core and dbt-athena version pinning
    ├── dbt_project.yml
    ├── profiles.yml                # Profile shared by dbt and dct
    ├── dbt_charts.yml              # dct source definition
    ├── seeds/
    │   ├── raw_customers.csv
    │   └── raw_orders.csv
    ├── models/
    │   ├── staging/
    │   │   ├── stg_customers.sql
    │   │   └── stg_orders.sql
    │   └── marts/
    │       ├── order_status_summary.sql
    │       └── customer_orders.sql
    └── charts/
        └── order_overview.yml      # dct board
CloudFormation
datastore.yaml defines the S3 bucket and Glue Database. The S3 bucket stores seed and mart data, as well as Athena query results. The Glue Database is used as the dbt schema.
dbt
profiles.yml is read by both dbt and dct. The bucket name is received from the environment variable DBT_S3_BUCKET. s3_staging_dir is where Athena query results are saved, and s3_data_dir is where dbt saves table data. They are separated within the same bucket as athena-results/ and data/. Since dbt creates tables and views in the Glue Database specified in schema, it should match the Glue Database name created in CloudFormation.
In dbt_project.yml, the mart is configured as an Iceberg table (materialized: table). Since dbt-athena uses RENAME when creating Iceberg tables, the S3 path for the table needs to be different each time. Therefore, s3_data_naming in profiles.yml is set to schema_table_unique, making the path unique per execution like data/<schema_name>/<table_name>/<UUID>/.
dbt Charts
dbt_charts.yml is placed at the root of the dbt project and defines the source that dct connects to. When type: dbt_profile is specified, dct uses the profile and target from profiles.yml to connect to Athena. profiles_dir is a relative path from the dbt project. Since profiles.yml is placed directly under the dbt project in this case, . is specified.
For ref() such as {{ ref('order_status_summary') }} in SQL, dct reads target/manifest.json and replaces them with relation names. dct reads ref() calls as strings and looks up the table name from the manifest.
The manifest is generated by dbt parse or dbt build. If you use ref() without a manifest, dct validate will output a warning (WARN-DBT-MANIFEST-MISSING) and succeed. dct render cannot replace ref() with table names and will fail with an error (ERR-DBT-MANIFEST-MISSING). You need to generate the manifest with dbt before running dct.
Deployment
Clone the repository
Clone the sample repository and navigate to the 73_dbt_charts_athena directory. All subsequent commands are run from this directory as the base.
git clone https://github.com/cm-yoshikikasama/blog_code.git
cd blog_code/73_dbt_charts_athena
Create the CloudFormation stack
Create the S3 bucket and Glue Database, then retrieve the bucket name from the Outputs.
aws cloudformation deploy \
  --profile <your-profile> \
  --region ap-northeast-1 \
  --stack-name cm-kasama-dbt-charts-athena \
  --template-file cfn/datastore.yaml

aws cloudformation describe-stacks \
  --profile <your-profile> \
  --region ap-northeast-1 \
  --stack-name cm-kasama-dbt-charts-athena \
  --query 'Stacks[0].Outputs'
Install dct and dbt
Install dct with the Athena extra as dbt-charts[athena]. Adding the extra also installs dbt-athena. Pin the dbt version in dbt/pyproject.toml and install it into a virtual environment for the dbt project using uv sync.
uv tool install 'dbt-charts[athena]'
cd dbt
uv sync
Set credentials and bucket name as environment variables
Set the bucket name retrieved from the stack Outputs to DBT_S3_BUCKET, which is referenced by profiles.yml. Specify the AWS profile used by dbt and dct with AWS_PROFILE.
export AWS_PROFILE=<your-profile>
export DBT_S3_BUCKET=<your-bucket>
Trying it out
dbt build
Build everything from seed to mart.
uv run dbt build --profiles-dir .
1 of 6 OK loaded seed file cm_kasama_jaffle_shop_dev.raw_customers ............. [INSERT 10 in 7.10s]
2 of 6 OK loaded seed file cm_kasama_jaffle_shop_dev.raw_orders ................ [INSERT 20 in 8.18s]
3 of 6 OK created sql view model cm_kasama_jaffle_shop_dev.stg_customers ....... [OK -1 in 1.95s]
4 of 6 OK created sql view model cm_kasama_jaffle_shop_dev.stg_orders .......... [OK -1 in 1.92s]
5 of 6 OK created sql table model cm_kasama_jaffle_shop_dev.customer_orders .... [OK 10 in 8.47s]
6 of 6 OK created sql table model cm_kasama_jaffle_shop_dev.order_status_summary  [OK 5 in 8.59s]
Done. PASS=6 WARN=0 ERROR=0 SKIP=0 NO-OP=0 REUSED=0 TOTAL=6
All 6 items from seed to mart were created successfully.
Verify the connection and board
Use dct query to verify the connection to Athena, and dct validate to validate the board YAML. Both are run from the dbt directory.
dct query athena 'SELECT 1'
dct validate charts/
_col0
1

1 rows
✓ charts/order_overview.yml OK
Check with text format while editing
While editing the board, use --format text to check aggregation results. --format text outputs the values, row counts, and value ranges for each chart.
dct render charts/order_overview.yml --format text
# Order Status

## Order Status_row0

### kpi_orders (kpi)
- value: 20

### kpi_customers (kpi)
- value: 10

## Order Status_row1

### Daily Order Count (line)
- x: order_date, y: order_count
- 18 rows | order_count: 1–2

### Count by Status (bar)
- x: status, y: order_count
- 5 rows | status: completed, placed, return_pending, returned, shipped | order_count: 1–9

## Orders by Customer (table)
- columns: Customer Name, Order Count, First Order Date, Last Order Date
- showing first 3 of 10 rows
| customer_name | order_count | first_order_date | last_order_date |
| --- | --- | --- | --- |
| Frank R. | 2 | 2018-01-11 | 2018-01-19 |
| Henry W. | 2 | 2018-01-12 | 2018-01-20 |
| Jennifer F. | 2 | 2018-01-04 | 2018-01-17 |
- 10 rows
The total order count of 20 and customer count of 10 matched the number of rows in the seeds.
With --format terminal, which draws charts in the terminal, the x-axis labels of the bar chart for count by status were misaligned. Only 4 labels appeared for 5 bars, and "completed" was displayed under the bar with height 9 (placed). Use --format text for verifying values.
   ┌───────────────────────────────────────────────────────────────┐
9.0┤███████████                                                    │
7.5┤███████████  ███████████                                       │
6.0┤███████████  ███████████                                       │
3.0┤███████████  ███████████                                       │
1.5┤███████████  ███████████  ███████████  ███████████  ███████████│
0.0┤███████████  ███████████  ███████████  ███████████  ███████████│
   └─────┬────────────┬────────────┬────────────┬──────────────────┘
    completed    returned   return_pending   shipped
Display in browser with dct serve
dbt Charts is designed to be viewed via the dct serve URL or the hosted dbt Charts Cloud URL. In this case, we serve it locally with dct serve.
dct serve --port 8080
The board file path corresponds to the URL, so charts/order_overview.yml is displayed at http://localhost:8080/order_overview/. Opening it in a browser shows the following screen.
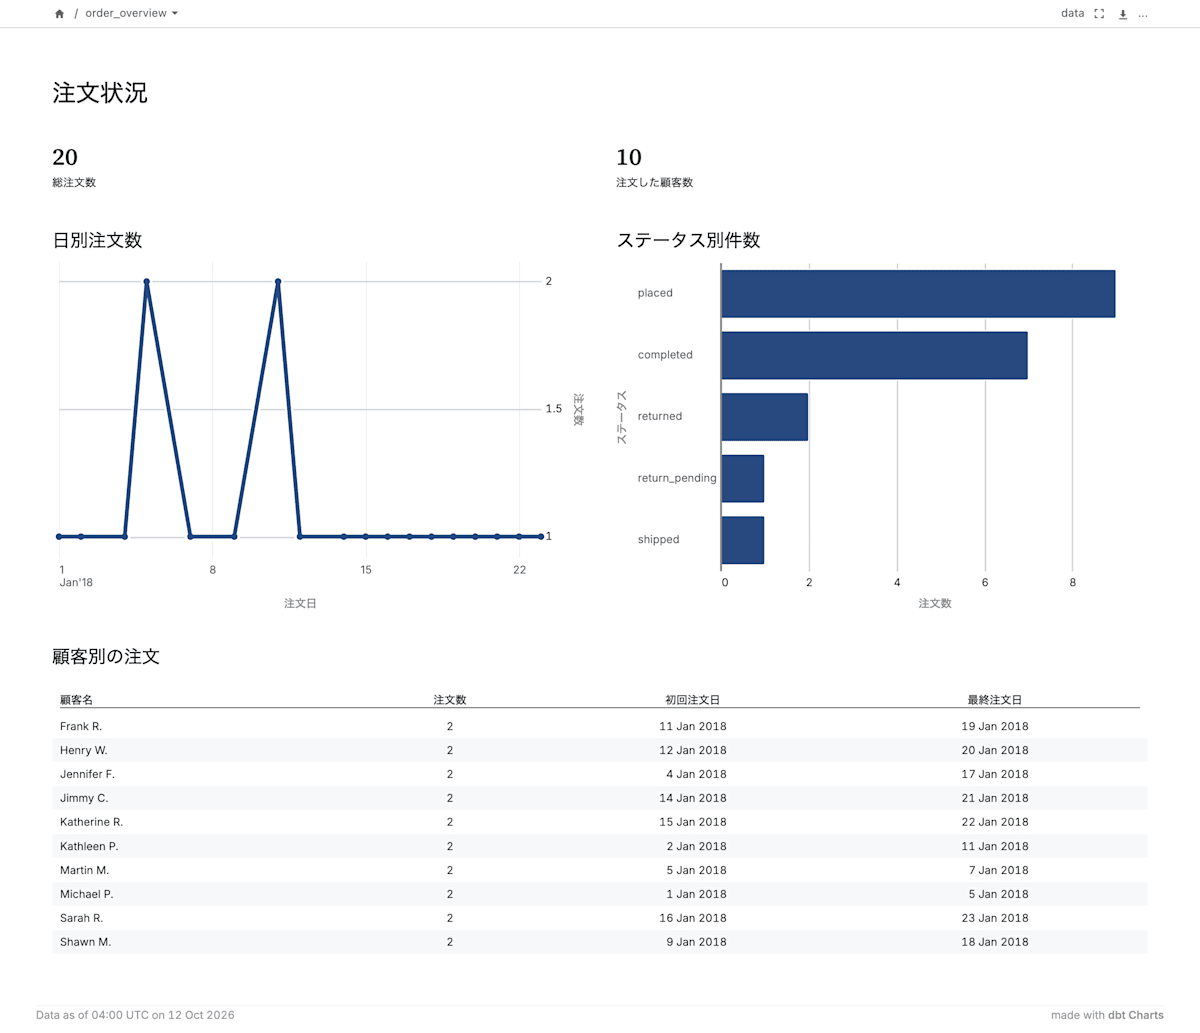
The board for checking order status on a single screen was displayed in the browser. The first row shows total orders and customer count, the second row shows a line chart of daily orders and a horizontal bar chart of count by status, and the third row shows an order list by customer.
Export HTML for sharing
To share the board as a file, export it with --format html.
dct render charts/order_overview.yml --format html
renders/order_overview.html is output. This HTML embeds the data at the time of rendering, and the displayed data remains fixed at that point. Other output formats include svg, png, pdf, terminal, json, text, text-data, yaml, and data.
Conclusion
We connected dbt Charts' dct to an Athena + Iceberg dbt project via dbt_profile and displayed an order status board using dct serve. Since the board is placed as YAML within the dbt project and references marts via ref(), you can manage models and dashboards in the same repository and review them via pull requests. This can be useful in projects building a data platform with dbt and Athena, such as when you want to verify aggregation results as a chart during model development, or when you need to confirm numbers with stakeholders before introducing a BI tool. If you want to update data regularly, one approach would be to set up a job in CI that runs dbt build followed by dct render --format html, then shares the exported HTML. I hope this is helpful for someone.