
dbt Charts で Snowflake 上の dbt モデルを YAML だけでダッシュボード化してみた

かわばたです。
dbt Labs は 2026年9月14日、dbt Charts をオープンソースソフトウェア(OSS)として公開しました。ボードの構成を 1 つの YAML ファイルで宣言し、SQL もその YAML 内に記述する仕組みです。
本記事では、Snowflake 上の jaffle_shop を題材に dbt Charts の CLI(dct)を導入し、ボードの作成から serve での表示までを検証します。
dbt Charts とは
YAML でボードを宣言する
dbt Charts は、ダッシュボードを YAML で宣言する言語と、それを描画する CLI dct のセットです。dbt Charts ではダッシュボードを「ボード」と呼ぶため、本記事でも以降は「ボード」と表記します。
SQL で「何を表示するか」を記述し、YAML で「どのように表示するか」を宣言します。ボードの主な構成要素は、次の 4 つです。
variables: フィルタ用の UI(セレクトボックスや日付範囲)queries: SQL。Jinja が使え、{{ ref('orders') }}で dbt モデルを参照できるcharts: クエリの列をx/y/colorなどのチャネル(視覚要素への割り当て先)に対応付ける- レイアウト:
rows/cols/grid/tabs
dct 0.7.1 には、validate(検証)、render(SVG・PNG・HTML などへの出力)、serve(ローカルサーバー)などのサブコマンドがあります。
dbt プロジェクトとの関係
公式ドキュメントによると、dbt Charts は dbt なしでも動きます。dbt プロジェクトに同居させた場合は、dbt コマンドを起動するのではなく、既存の設定ファイルを読み取って動きます。対象は dbt_project.yml、profiles.yml、target/manifest.json の 3 つで、接続情報と ref() の解決に使います。
dbt Charts の使い方と今回の構成(公式ドキュメントの記載を整理)
| 構成 | dbt プロジェクト | manifest.json | ref() |
接続情報 |
|---|---|---|---|---|
| 単独で使う | 不要 | 不要 | 使えない | 接続情報またはデータソースを dbt_charts.yml に直接定義 |
| dbt プロジェクトに同居 | あり | 必要 | 使える | profiles.yml または直接接続の設定 |
| 今回の構成 | jaffle_shop | dbt Core 1.12 で生成 | 使える | profiles.yml の trial ターゲット |
本記事の範囲
dbt Labs は OSS の言語と同時に、ホスティング・権限管理・チャット UI を備えた dbt Charts Cloud(dbtCharts.com、public beta)も公開しています。本記事が扱うのは OSS の dct CLI だけです。
Claude Code に dct の skills を入れてチャットでボードを作る検証は、次回の記事で扱います。
前提条件
検証環境
| 項目 | 値 |
|---|---|
| OS | Windows 11(PowerShell) |
| Python 環境管理 | uv 0.11.6 |
| dbt(モデルの build 用) | dbt Core 1.12.0 + dbt-snowflake 1.12.0 |
| dbt Charts | 0.7.1(Python 3.12.11) |
| Snowflake | trial アカウント(Enterprise Edition、AWS 東京リージョン) |
| Snowflake の接続ロール | ACCOUNTADMIN(検証用) |
| dbt プロジェクト | jaffle_shop |
- 公式ドキュメントの要件は Python 3.10 以上です
- Snowflake に接続するには
dbt-charts[snowflake]の extra が必要です
検証を簡単にするため ACCOUNTADMIN で接続していますが、公式ドキュメントは dbt Charts 用に SELECT 権限だけを持つロールを勧めています。実運用では、対象スキーマの SELECT 権限だけを持つ専用のロールとユーザーを作ってください。
事前準備
dct を隔離環境にインストールする
公式ドキュメントが推奨する uv tool install で導入します。
uv tool install --python 3.12 "dbt-charts[snowflake]"
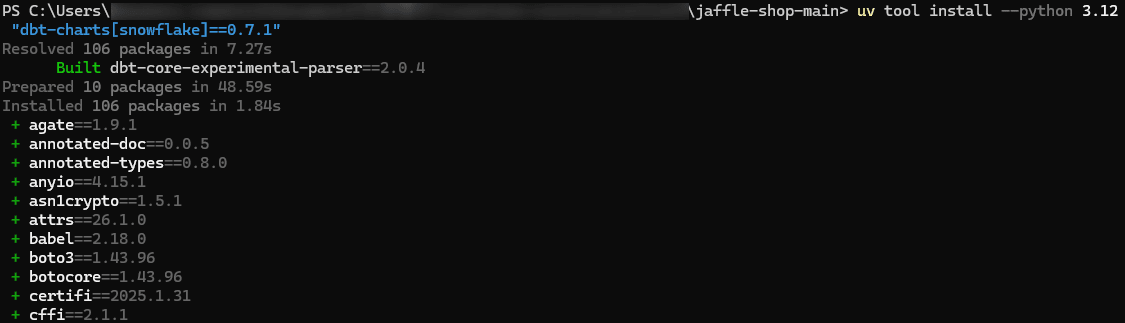
dct は ~/.local/bin に shim が置かれ、本体は uv の tool 用ディレクトリに隔離されます。
dct --version

公式ドキュメントによると、dbt Charts が使う Python アダプターは dbt Core 1.x に依存します。そのため、dbt v2(Fusion)を含む Python 環境に dbt Charts を同居させると、依存解決によって dbt v2 が dbt Core 1.x に置き換わる可能性があります。
jaffle_shop の seed と build を実行する
jaffle_shop の seed と build は dbt Core で実行します。<repo> はリポジトリのパスに置き換えてください。今回は dbt Core を venv(CoCo\.venv)に入れているので、その dbt.exe を指定しています。
$DBT = "<repo>\CoCo\.venv\Scripts\dbt.exe"
snow sql -c trial -q "create database if not exists JAFFLE_SHOP_DB"
& $DBT deps  --profile jaffle_shop --target trial --project-dir .
& $DBT seed  --profile jaffle_shop --target trial --project-dir . --full-refresh --vars "{load_source_data: true}"
& $DBT build --profile jaffle_shop --target trial --project-dir .
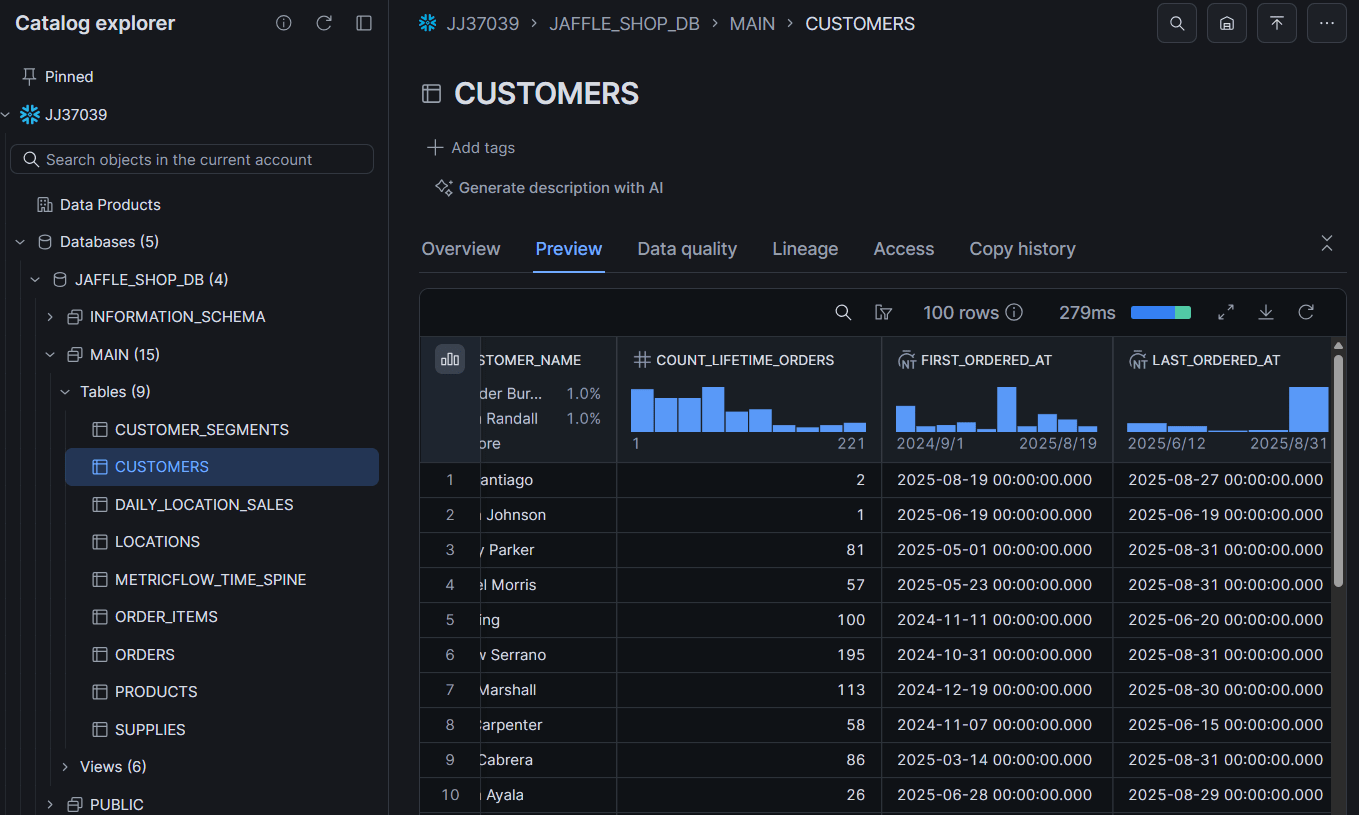
下記のとおり Snowflake にデータが入っていることが確認できました。
dct init でひな形を作る
dbt プロジェクトのルートで dct init を実行します。今回は CLI の検証が目的なので、skills・MCP・エディタ拡張の導入はオプション無しの設定としました。
dct init --yes --no-skills --no-mcp --no-vscode --no-cursor --project-dir .
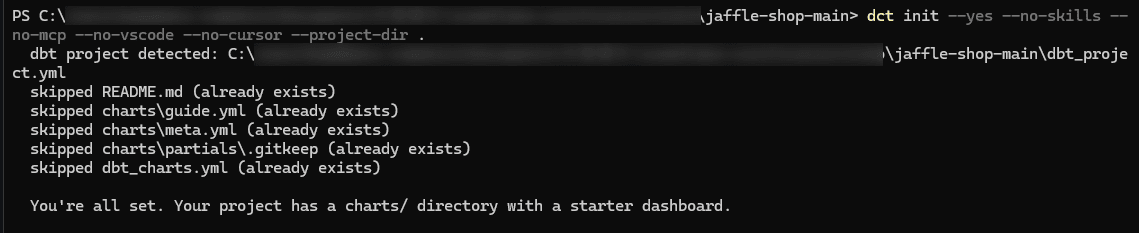
生成した dbt_charts.yml は、全行がコメントのひな形でした。接続先は sources: に自分で定義します。jaffle_shop の dbt_project.yml は profile: default のままなので、profile 名を明示しました。
# dbt_charts.yml
sources:
  jaffle:
    type: dbt_profile
    profile: jaffle_shop
    target: trial

server:
  port: 8943

execution:
  max_query_duration_seconds: 60
type: dbt_profile は profiles.yml の接続情報を参照するため、dbt_charts.yml 自体に認証情報は入りません。認証情報を持つ profiles.yml は Git の管理対象から外してください。公式ドキュメントには、接続設定に環境変数(env_var())を使う方法も記載されています。
試してみた
guide ボードを表示する
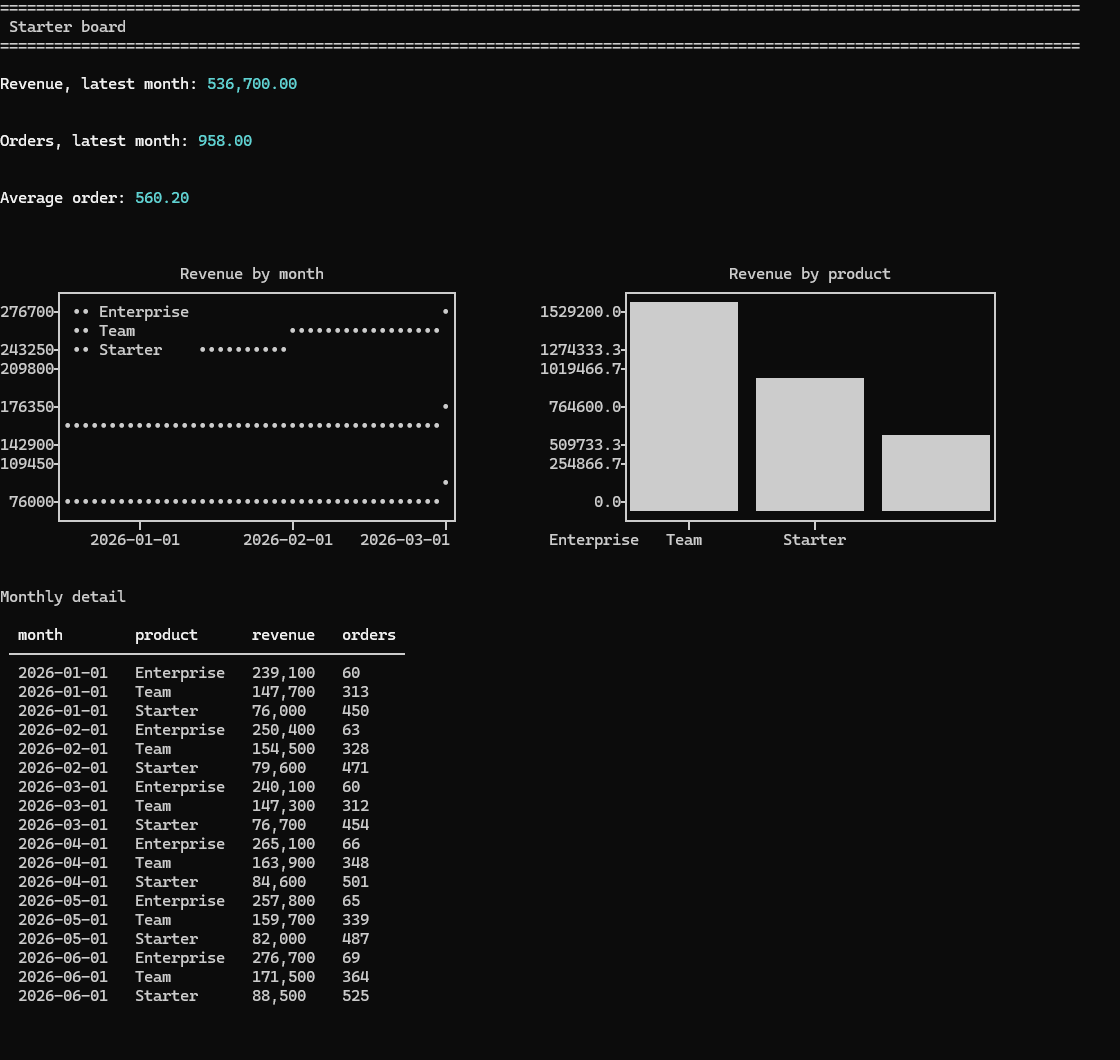
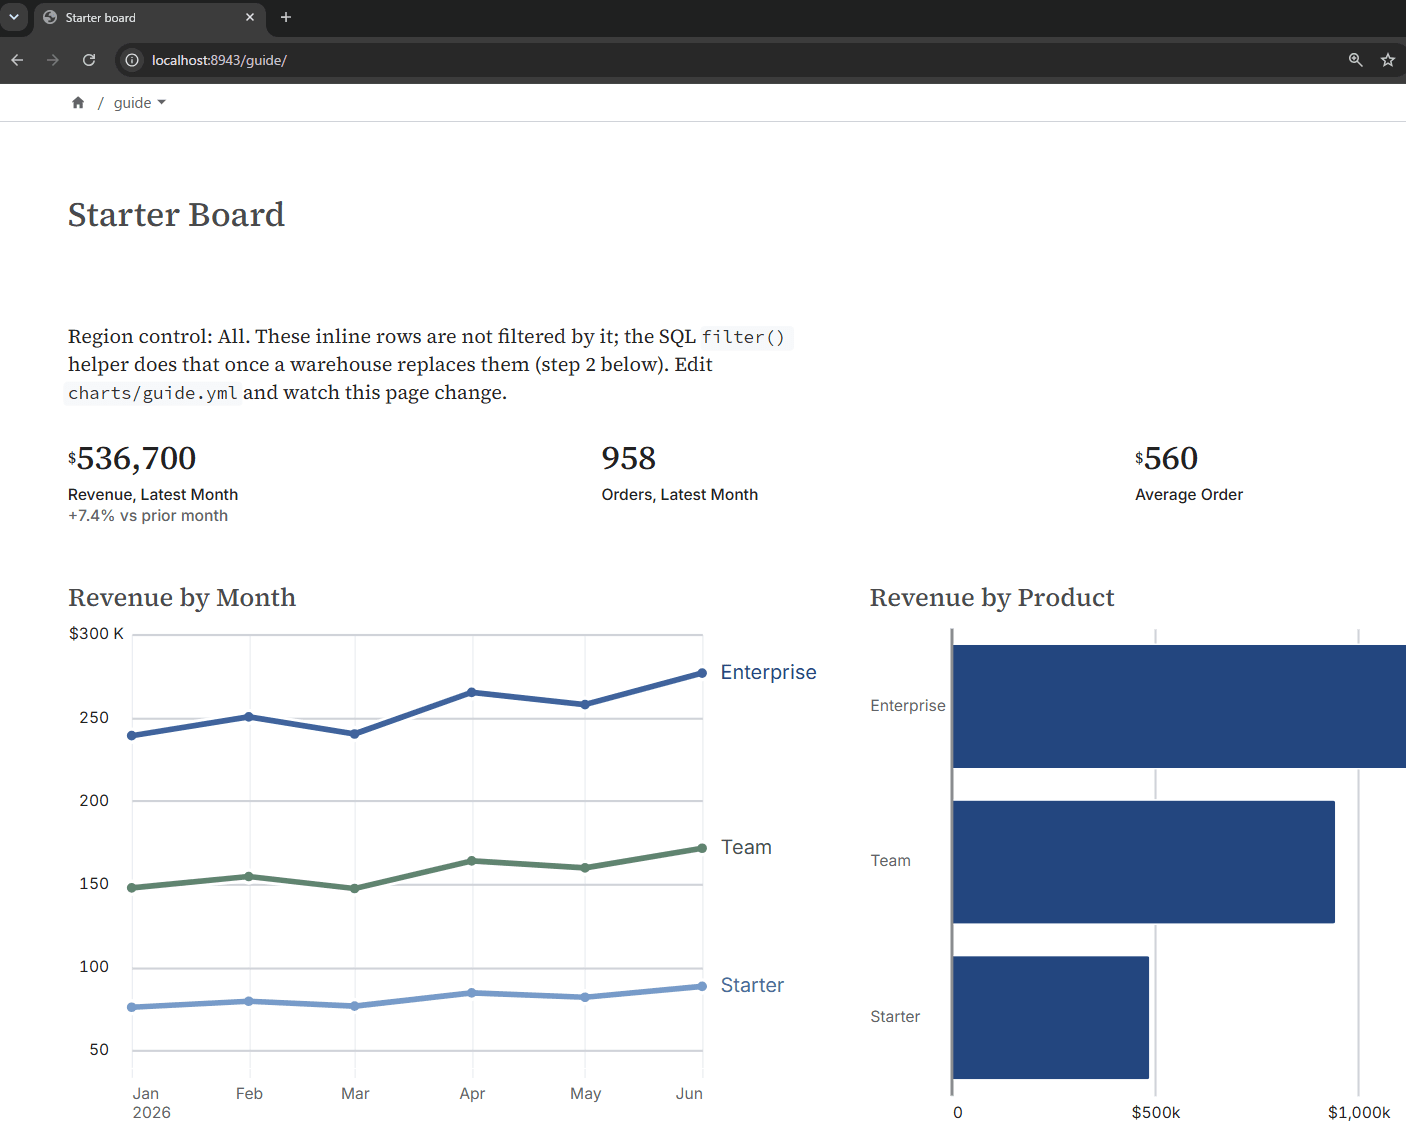
dbt Charts の dct init が作る charts/guide.yml は、データを YAML 内に持つサンプルボードです。Snowflake に接続する前に動作を確認できます。
dct validate charts/guide.yml
dct render charts/guide.yml --format png --output renders\guide.png
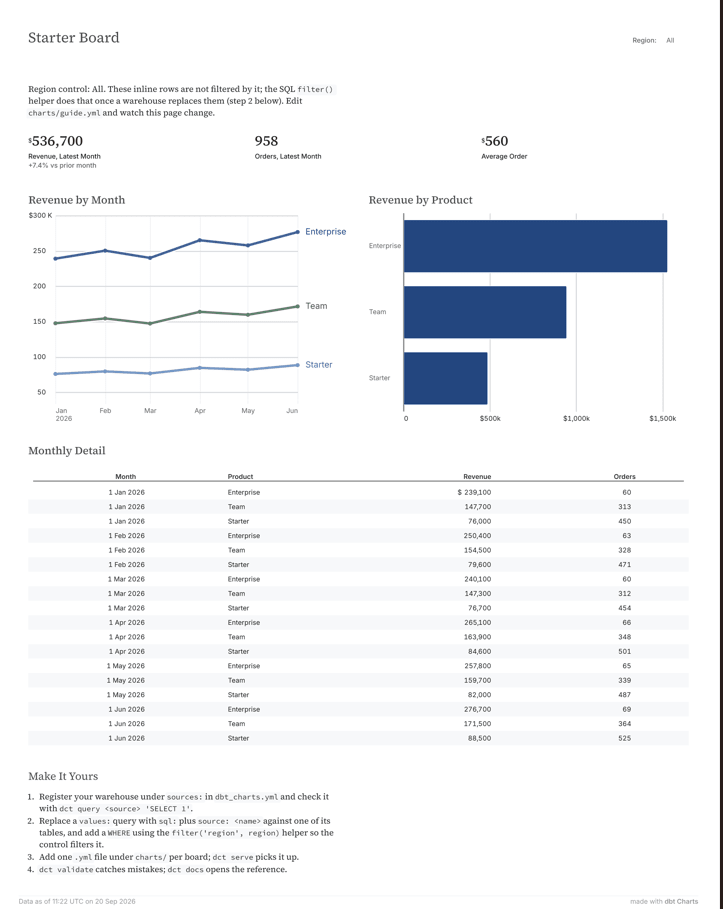
--format terminal を指定すると、同じボードをターミナルに描画します。
dct render charts/guide.yml --format terminal
ブラウザで見る場合は dct serve を使います。ポートは dbt_charts.yml の server.port に従います。
dct serve --host localhost
--host localhost は、アクセスをローカルマシンに限定する指定です。dbt Charts の dct serve --help には、認証に関するオプションがありません。--host 0.0.0.0 などを指定するとネットワーク上の他の端末からアクセスできるため、機密データを扱う環境では公開しないでください。
http://localhost:8943/guide/ を開くとボードが表示されます。
Snowflake の dbt モデルを ref() で参照する
Snowflake への接続と SQL の実行は、dct query で確認できます。第 1 引数は dbt_charts.yml の source 名です。
dct query jaffle "select count(*) as orders from JAFFLE_SHOP_DB.MAIN.ORDERS"

KPI とグラフを YAML で定義する
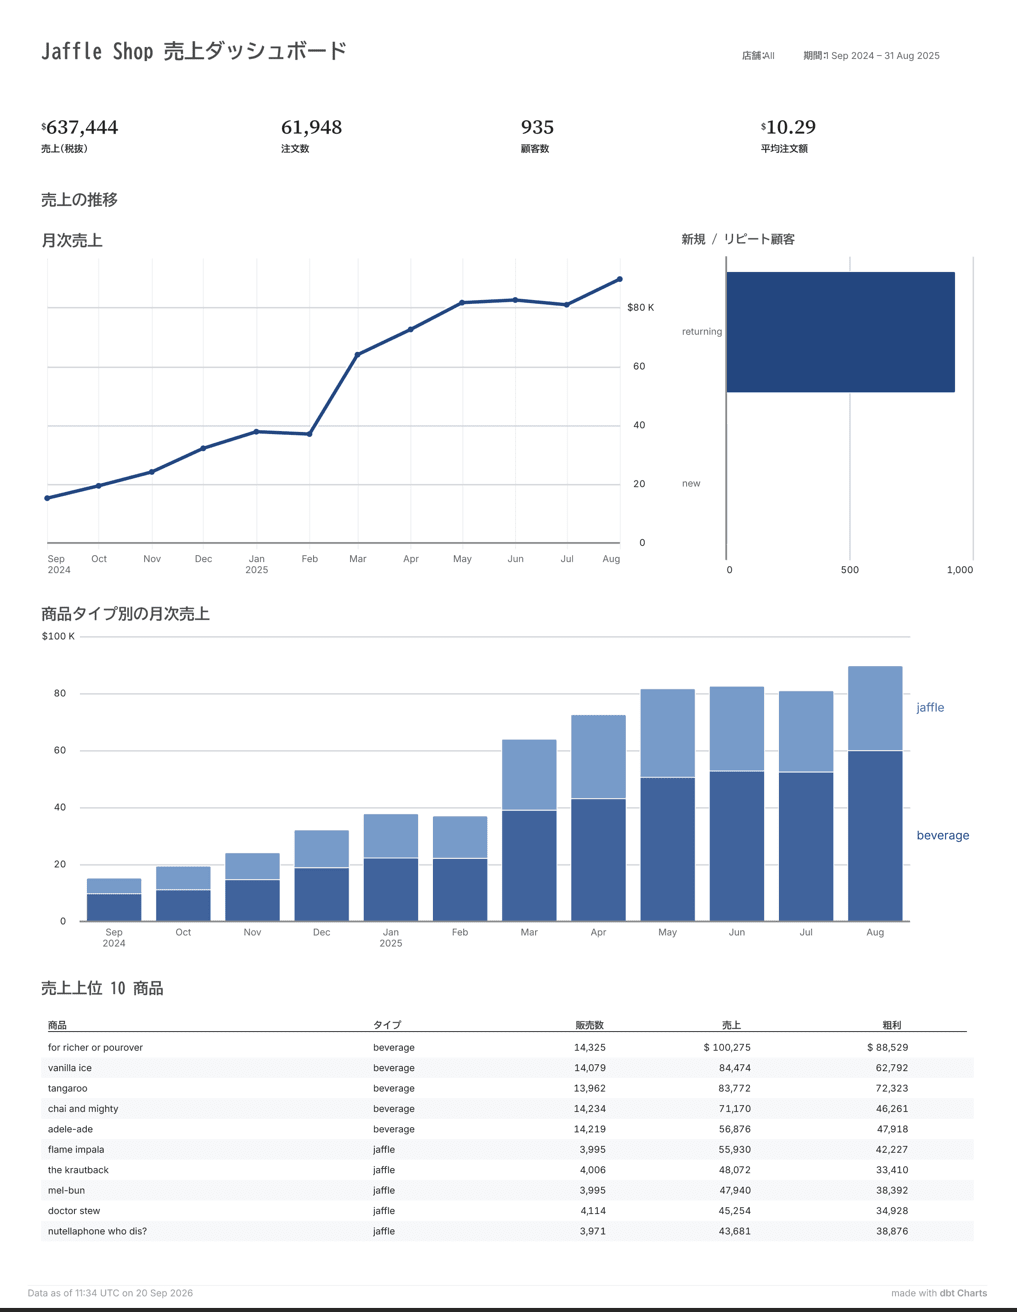
jaffle_shop の marts モデルを使い、売上のボードを charts/jaffle_overview.yml に書きました。
yamlで定義する
title: Jaffle Shop 売上ダッシュボード
notes: >
  jaffle_shop の marts モデル (orders / order_items / products / locations / customers) を
  ref() で参照するボード。location と period の 2 つの変数で絞り込む。
  金額は税抜 (orders.subtotal / order_items.product_price) でそろえている。

source: jaffle

variables:
  location:
    input: select
    label: 店舗
    options:
      query: location_options
      column: location_name
  period:
    input: daterange
    label: 期間
    default: ["2024-09-01", "2025-08-31"]

queries:
  location_options: |
    select location_name
    from {{ ref('locations') }}
    order by location_name

  kpis: |
    select
        sum(o.subtotal)                          as revenue,
        count(*)                                 as orders,
        count(distinct o.customer_id)            as customers,
        sum(o.subtotal) / nullif(count(*), 0)    as avg_order_value
    from {{ ref('orders') }} as o
    join {{ ref('locations') }} as l
        on o.location_id = l.location_id
    where {{ filter('l.location_name', location) }}
      and {{ filter_date_range('o.ordered_at', period) }}

  monthly_revenue: |
    select
        date_trunc('month', o.ordered_at)::date as month,
        sum(o.subtotal)                         as revenue,
        count(*)                                as orders
    from {{ ref('orders') }} as o
    join {{ ref('locations') }} as l
        on o.location_id = l.location_id
    where {{ filter('l.location_name', location) }}
      and {{ filter_date_range('o.ordered_at', period) }}
    group by 1
    order by 1

  revenue_by_type: |
    select
        date_trunc('month', o.ordered_at)::date  as month,
        p.product_type                           as product_type,
        sum(oi.product_price)                    as revenue
    from {{ ref('order_items') }} as oi
    join {{ ref('products') }} as p
        on oi.product_id = p.product_id
    join {{ ref('orders') }} as o
        on oi.order_id = o.order_id
    join {{ ref('locations') }} as l
        on o.location_id = l.location_id
    where {{ filter('l.location_name', location) }}
      and {{ filter_date_range('o.ordered_at', period) }}
    group by 1, 2
    order by 1, 2

  customer_mix: |
    select
        customer_type,
        count(*) as customers
    from {{ ref('customers') }}
    where customer_type is not null
    group by 1
    order by 1

  top_products: |
    select
        p.product_name                              as product_name,
        p.product_type                              as product_type,
        count(*)                                    as items_sold,
        sum(oi.product_price)                       as revenue,
        sum(oi.product_price) - sum(oi.supply_cost) as gross_profit
    from {{ ref('order_items') }} as oi
    join {{ ref('products') }} as p
        on oi.product_id = p.product_id
    where {{ filter_date_range('oi.ordered_at', period) }}
    group by 1, 2
    order by revenue desc
    limit 10

charts:
  kpi_revenue:
    type: kpi
    query: queries.kpis
    label: 売上(税抜)
    value: revenue
    style:
      value:
        format: currency_whole

  kpi_orders:
    type: kpi
    query: queries.kpis
    label: 注文数
    value: orders
    style:
      value:
        format: integer

  kpi_customers:
    type: kpi
    query: queries.kpis
    label: 顧客数
    value: customers
    style:
      value:
        format: integer

  kpi_aov:
    type: kpi
    query: queries.kpis
    label: 平均注文額
    value: avg_order_value
    style:
      value:
        format: currency_full

  revenue_trend:
    type: line
    query: queries.monthly_revenue
    title: 月次売上
    x: month
    y: revenue
    style:
      number_format: currency

  customer_mix:
    type: bar
    query: queries.customer_mix
    title: 新規 / リピート顧客
    x: customer_type
    y: customers

  revenue_by_type:
    type: bar
    query: queries.revenue_by_type
    title: 商品タイプ別の月次売上
    x: month
    y: revenue
    color: product_type
    style:
      orientation: vertical
      stack: zero
      number_format: currency

  top_products:
    type: table
    query: queries.top_products
    title: 売上上位 10 商品
    style:
      columns:
        product_name:
          label: 商品
        product_type:
          label: タイプ
        items_sold:
          label: 販売数
          format: integer
        revenue:
          label: 売上
          format: currency_whole
        gross_profit:
          label: 粗利
          format: currency_whole

rows:
  - cols: [kpi_revenue, kpi_orders, kpi_customers, kpi_aov]
  - title: 売上の推移
    grid:
      columns: 24
      items:
        - item: revenue_trend
          width: 16
        - item: customer_mix
          width: 8
  - revenue_by_type
  - top_products
金額は税抜でそろえました。KPI と月次推移では注文単位の orders.subtotal を、商品タイプ別では明細単位の order_items.product_price を使っています。
1 つの注文に複数の商品明細があるため、商品タイプ別の集計だけは order_items を参照しています。
jaffle_shop の orders.yml には 2 つのテストがあります。order_total = subtotal + tax_paid と order_items_subtotal = subtotal です。これにより両者の合計が一致し、税抜売上として同じ基準で比較できます。
変数名は jaffle_shop のモデル名 locations に合わせて location とし、表示ラベルは「店舗」にしています。locations は店舗を表すモデルです。
記法はオフラインでも dct docs cheatsheet や dct docs charts で確認できます。
# Snowflake でクエリを実行し、結果を PNG に描画して保存する
dct render charts/jaffle_overview.yml --format png --output renders\jaffle_overview.png

# 出力した PNG を開く
start renders\jaffle_overview.png
Snowflake の QUERY_HISTORY で確認する
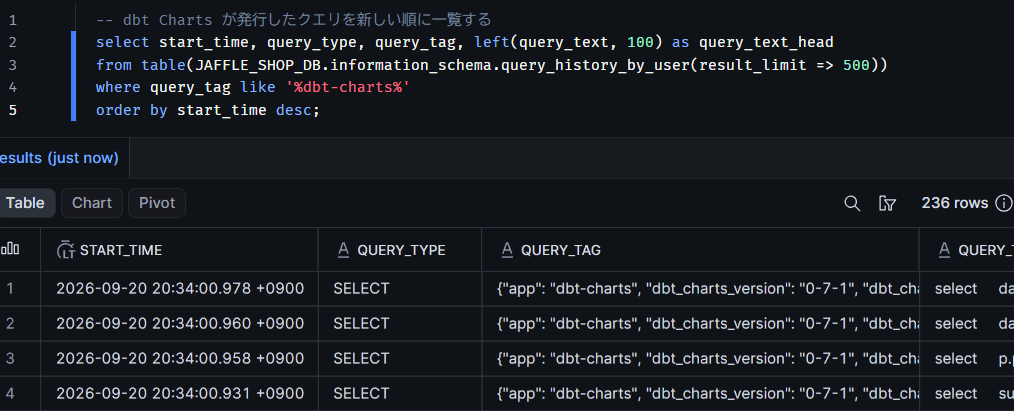
公式ドキュメントによると、dbt Charts が発行するクエリには app=dbt-charts などの属性が付きます。Snowflake では、app・dbt Charts のバージョン・surface の 3 項目が QUERY_TAG に JSON 形式で設定されます。ボード名やクエリ名などの追加情報はクエリのコメントに付与されるとされています。また、接続側で query_tag を設定済みの場合、dbt Charts はその値を上書きしないとされています。
Snowsight で次を実行して確認しました。
-- dbt Charts が発行したクエリを新しい順に一覧する
select start_time, query_type, query_tag, left(query_text, 100) as query_text_head
from table(JAFFLE_SHOP_DB.information_schema.query_history_by_user(result_limit => 500))
where query_tag like '%dbt-charts%'
order by start_time desc;
最後に
dbt Charts では、ボードを YAML 1 ファイルで宣言し可視化ですることができました。
現時点では dbt Semantic Layer は未対応ですが、dbt-labs/dbt-charts#1 で計画中なので期待したいですね!
この記事が何かの参考になれば幸いです!