
I tried creating a dashboard from dbt models on Snowflake using only YAML with dbt Charts

This page has been translated by machine translation. View original
kawabata here.
dbt Labs released dbt Charts as open source software (OSS) on September 14, 2026. The board configuration is declared in a single YAML file, with SQL also written inside that YAML.
In this article, we'll use jaffle_shop on Snowflake as a subject to introduce the dbt Charts CLI (dct) and verify the process from board creation to display with serve.
What is dbt Charts
Declaring boards with YAML
dbt Charts is a set of a language for declaring dashboards in YAML and a CLI dct that renders them. In dbt Charts, dashboards are called "boards," so this article will use "board" going forward.
SQL describes "what to display" and YAML declares "how to display it." The main components of a board are the following 4:
variables: UI for filtering (select boxes and date ranges)queries: SQL. Jinja can be used, and dbt models can be referenced with{{ ref('orders') }}charts: Maps query columns to channels (assignment destinations for visual elements) such asx/y/color- Layout:
rows/cols/grid/tabs
dct 0.7.1 has subcommands such as validate, render (output to SVG, PNG, HTML, etc.), and serve (local server).
Relationship with dbt projects
According to the official documentation, dbt Charts works without dbt. When co-located with a dbt project, it reads existing configuration files rather than launching dbt commands. The targets are dbt_project.yml, profiles.yml, and target/manifest.json, which are used for connection information and resolving ref().
How to use dbt Charts and the configuration for this article (organized from official documentation)
| Configuration | dbt project | manifest.json | ref() |
Connection info |
|---|---|---|---|---|
| Used standalone | Not required | Not required | Cannot be used | Define connection info or data source directly in dbt_charts.yml |
| Co-located with dbt project | Present | Required | Can be used | profiles.yml or direct connection settings |
| This article's configuration | jaffle_shop | Generated with dbt Core 1.12 | Can be used | trial target in profiles.yml |
Scope of this article
dbt Labs released dbt Charts Cloud (dbtCharts.com, public beta) simultaneously with the OSS language, featuring hosting, permission management, and a chat UI. This article only covers the OSS dct CLI.
Verification of creating boards via chat by adding dbt Charts skills to Claude Code will be covered in the next article.
Prerequisites
Verification environment
| Item | Value |
|---|---|
| OS | Windows 11 (PowerShell) |
| Python environment management | uv 0.11.6 |
| dbt (for building models) | dbt Core 1.12.0 + dbt-snowflake 1.12.0 |
| dbt Charts | 0.7.1 (Python 3.12.11) |
| Snowflake | Trial account (Enterprise Edition, AWS Tokyo region) |
| Snowflake connection role | ACCOUNTADMIN (for verification) |
| dbt project | jaffle_shop |
- The official documentation requires Python 3.10 or higher
- The
dbt-charts[snowflake]extra is required to connect to Snowflake
We're connecting with ACCOUNTADMIN to simplify verification, but the official documentation recommends a role with only SELECT permissions for dbt Charts. In production, please create a dedicated role and user with only SELECT permissions for the target schema.
Preparation
Installing dct in an isolated environment
Install using uv tool install as recommended by the official documentation.
uv tool install --python 3.12 "dbt-charts[snowflake]"
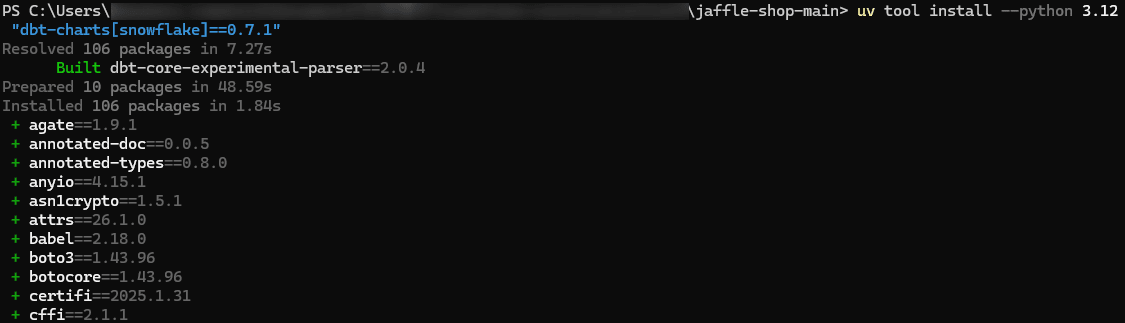
dct places a shim in ~/.local/bin, with the actual package isolated in uv's tool directory.
dct --version

According to the official documentation, the Python adapter used by dbt Charts depends on dbt Core 1.x. Therefore, if dbt Charts is co-located in a Python environment that includes dbt v2 (Fusion), dependency resolution may replace dbt v2 with dbt Core 1.x.
Running jaffle_shop seed and build
Run seed and build for jaffle_shop with dbt Core. Replace <repo> with the path to your repository. In this case, dbt Core is installed in a venv (CoCo\.venv), so we specify that dbt.exe.
$DBT = "<repo>\CoCo\.venv\Scripts\dbt.exe"
snow sql -c trial -q "create database if not exists JAFFLE_SHOP_DB"
& $DBT deps  --profile jaffle_shop --target trial --project-dir .
& $DBT seed  --profile jaffle_shop --target trial --project-dir . --full-refresh --vars "{load_source_data: true}"
& $DBT build --profile jaffle_shop --target trial --project-dir .
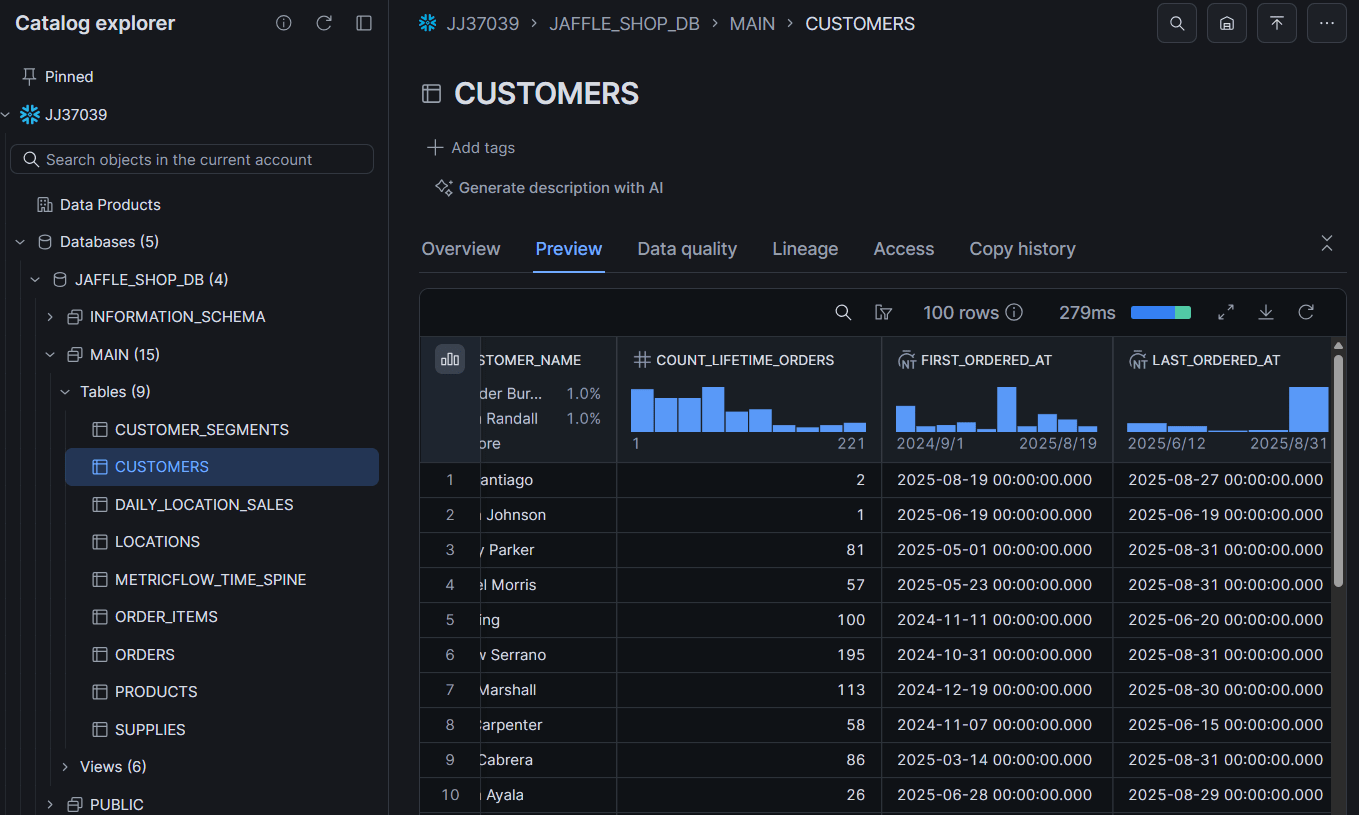
We confirmed that data was loaded into Snowflake as shown below.
Creating a template with dct init
Run dct init at the root of the dbt project. Since the goal is to verify the CLI, we set the options to skip skills, MCP, and editor extension installation.
dct init --yes --no-skills --no-mcp --no-vscode --no-cursor --project-dir .
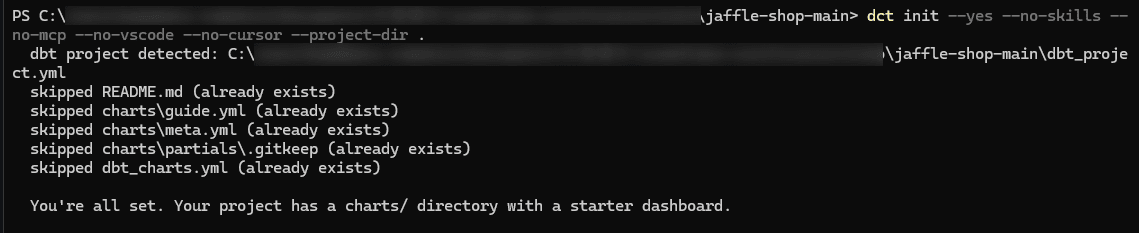
The generated dbt_charts.yml was a template with all lines commented out. You define the connection destination yourself under sources:. Since jaffle_shop's dbt_project.yml still has profile: default, we explicitly specified the profile name.
# dbt_charts.yml
sources:
  jaffle:
    type: dbt_profile
    profile: jaffle_shop
    target: trial

server:
  port: 8943

execution:
  max_query_duration_seconds: 60
Since type: dbt_profile references connection information from profiles.yml, no authentication information is stored in dbt_charts.yml itself. Please exclude profiles.yml, which contains authentication information, from Git management. The official documentation also describes how to use environment variables (env_var()) for connection settings.
Trying it out
Displaying the guide board
The charts/guide.yml created by dbt Charts' dct init is a sample board that holds data within the YAML itself. You can verify operation before connecting to Snowflake.
dct validate charts/guide.yml
dct render charts/guide.yml --format png --output renders\guide.png
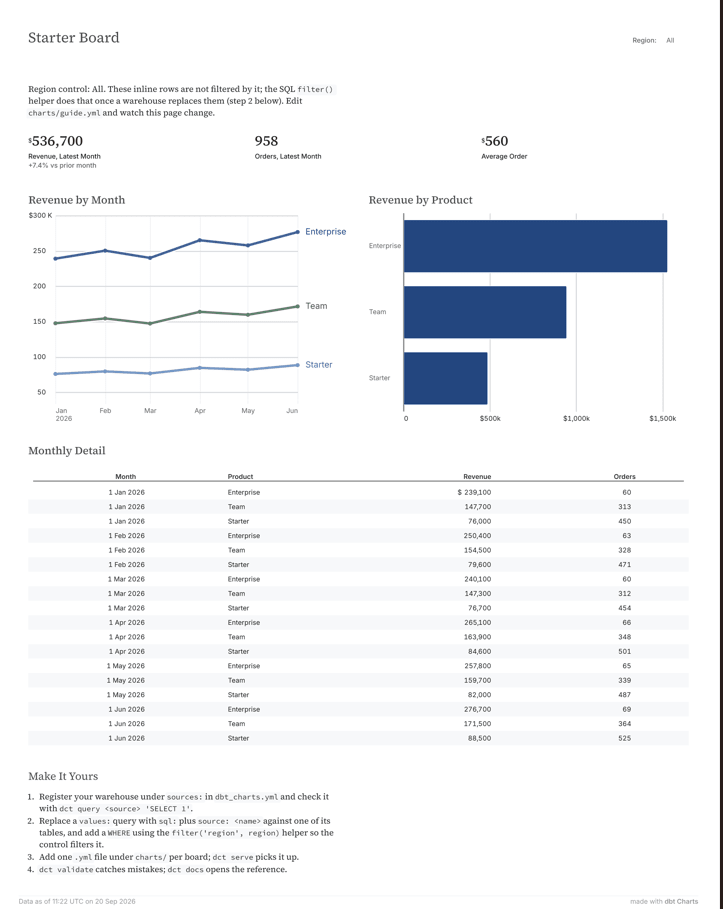
Specifying --format terminal renders the same board in the terminal.
dct render charts/guide.yml --format terminal
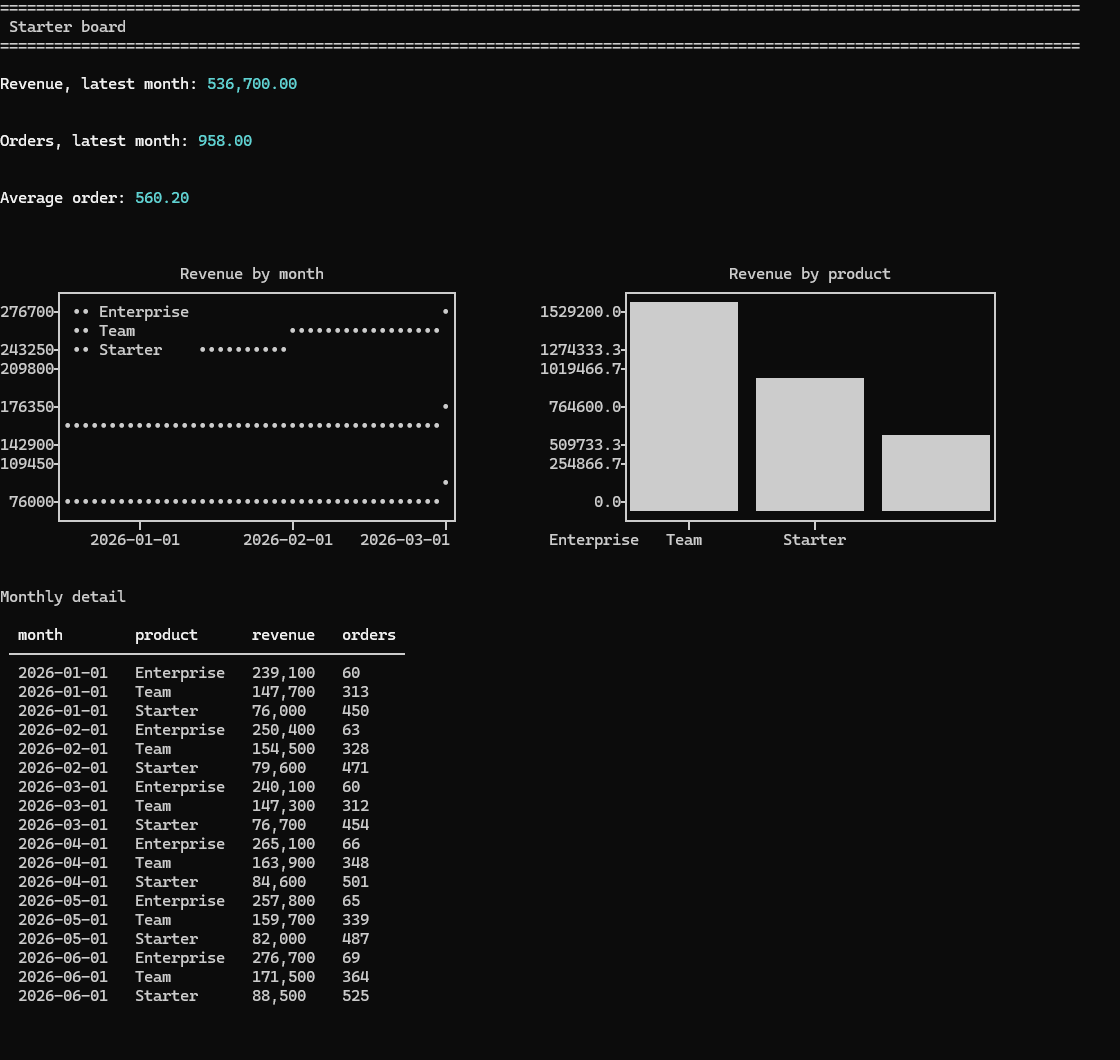
Use dct serve to view in a browser. The port follows server.port in dbt_charts.yml.
dct serve --host localhost
--host localhost limits access to the local machine. The dct serve --help in dbt Charts has no options related to authentication. Specifying --host 0.0.0.0 or similar allows access from other devices on the network, so please do not expose this in environments handling sensitive data.
Opening http://localhost:8943/guide/ displays the board.
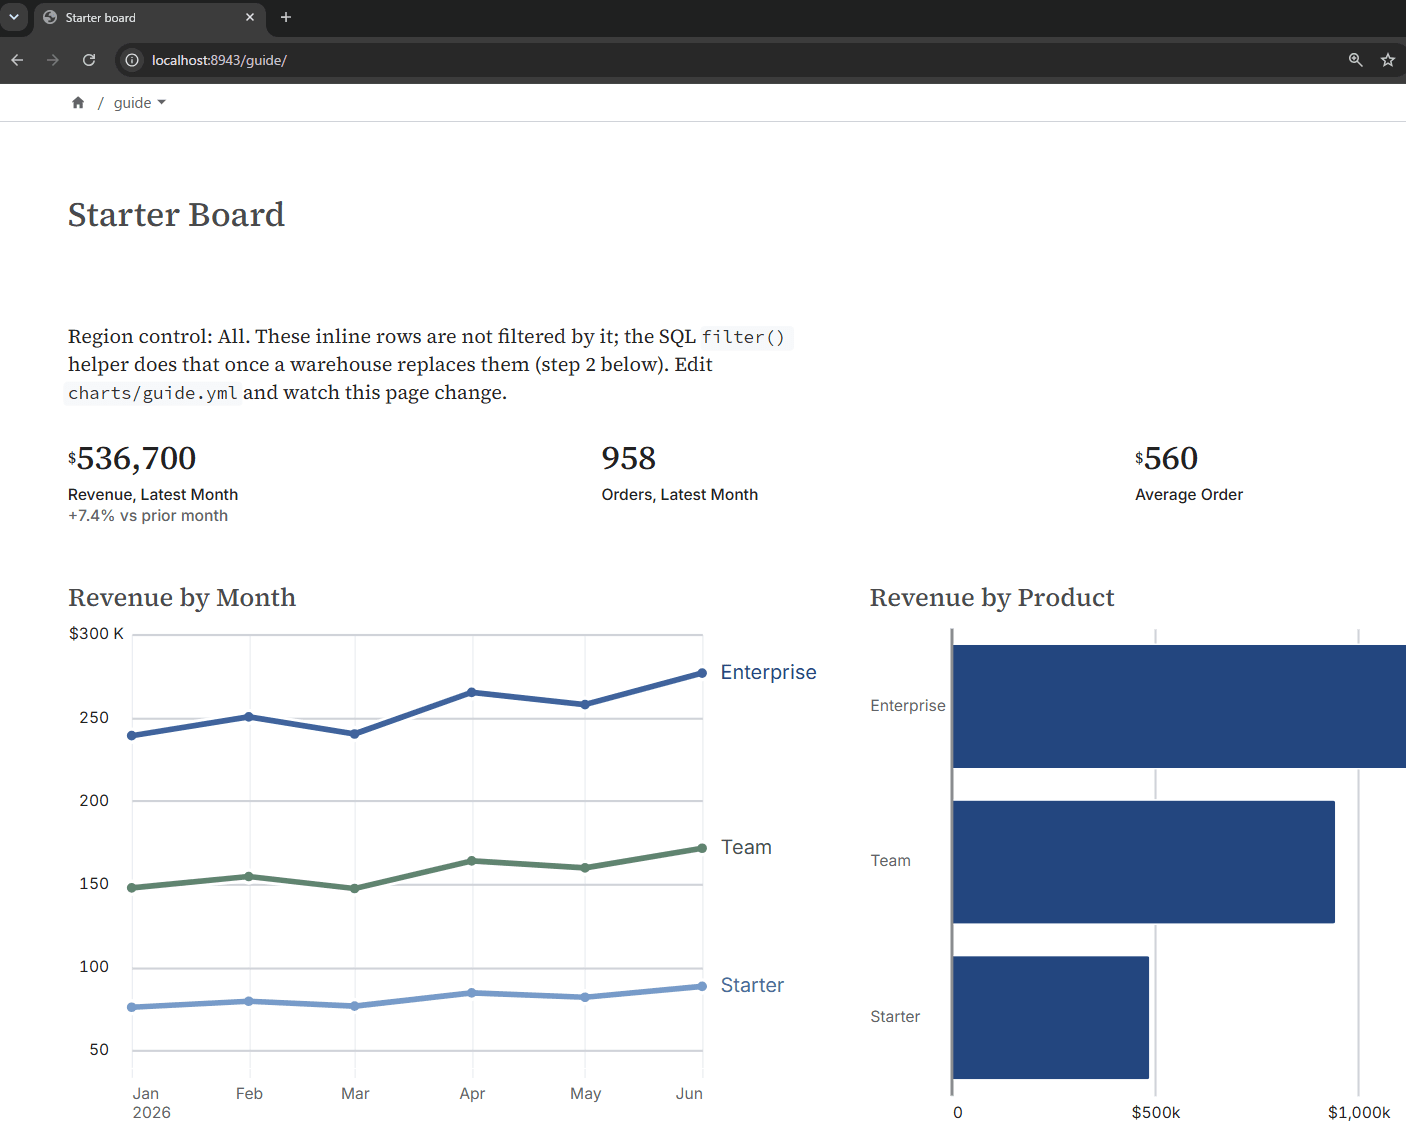
Referencing dbt models in Snowflake with ref()
You can verify connection to Snowflake and SQL execution with dct query. The first argument is the source name in dbt_charts.yml.
dct query jaffle "select count(*) as orders from JAFFLE_SHOP_DB.MAIN.ORDERS"

Defining KPIs and charts in YAML
Using jaffle_shop's marts models, we wrote a sales board in charts/jaffle_overview.yml.
Define in yaml
title: Jaffle Shop Sales Dashboard
notes: >
  A board that references jaffle_shop's marts models (orders / order_items / products / locations / customers)
  using ref(). Filter by two variables: location and period.
  Amounts are pre-tax (orders.subtotal / order_items.product_price).

source: jaffle

variables:
  location:
    input: select
    label: Location
    options:
      query: location_options
      column: location_name
  period:
    input: daterange
    label: Period
    default: ["2024-09-01", "2025-08-31"]

queries:
  location_options: |
    select location_name
    from {{ ref('locations') }}
    order by location_name

  kpis: |
    select
        sum(o.subtotal)                          as revenue,
        count(*)                                 as orders,
        count(distinct o.customer_id)            as customers,
        sum(o.subtotal) / nullif(count(*), 0)    as avg_order_value
    from {{ ref('orders') }} as o
    join {{ ref('locations') }} as l
        on o.location_id = l.location_id
    where {{ filter('l.location_name', location) }}
      and {{ filter_date_range('o.ordered_at', period) }}

  monthly_revenue: |
    select
        date_trunc('month', o.ordered_at)::date as month,
        sum(o.subtotal)                         as revenue,
        count(*)                                as orders
    from {{ ref('orders') }} as o
    join {{ ref('locations') }} as l
        on o.location_id = l.location_id
    where {{ filter('l.location_name', location) }}
      and {{ filter_date_range('o.ordered_at', period) }}
    group by 1
    order by 1

  revenue_by_type: |
    select
        date_trunc('month', o.ordered_at)::date  as month,
        p.product_type                           as product_type,
        sum(oi.product_price)                    as revenue
    from {{ ref('order_items') }} as oi
    join {{ ref('products') }} as p
        on oi.product_id = p.product_id
    join {{ ref('orders') }} as o
        on oi.order_id = o.order_id
    join {{ ref('locations') }} as l
        on o.location_id = l.location_id
    where {{ filter('l.location_name', location) }}
      and {{ filter_date_range('o.ordered_at', period) }}
    group by 1, 2
    order by 1, 2

  customer_mix: |
    select
        customer_type,
        count(*) as customers
    from {{ ref('customers') }}
    where customer_type is not null
    group by 1
    order by 1

  top_products: |
    select
        p.product_name                              as product_name,
        p.product_type                              as product_type,
        count(*)                                    as items_sold,
        sum(oi.product_price)                       as revenue,
        sum(oi.product_price) - sum(oi.supply_cost) as gross_profit
    from {{ ref('order_items') }} as oi
    join {{ ref('products') }} as p
        on oi.product_id = p.product_id
    where {{ filter_date_range('oi.ordered_at', period) }}
    group by 1, 2
    order by revenue desc
    limit 10

charts:
  kpi_revenue:
    type: kpi
    query: queries.kpis
    label: Revenue (pre-tax)
    value: revenue
    style:
      value:
        format: currency_whole

  kpi_orders:
    type: kpi
    query: queries.kpis
    label: Orders
    value: orders
    style:
      value:
        format: integer

  kpi_customers:
    type: kpi
    query: queries.kpis
    label: Customers
    value: customers
    style:
      value:
        format: integer

  kpi_aov:
    type: kpi
    query: queries.kpis
    label: Average Order Value
    value: avg_order_value
    style:
      value:
        format: currency_full

  revenue_trend:
    type: line
    query: queries.monthly_revenue
    title: Monthly Revenue
    x: month
    y: revenue
    style:
      number_format: currency

  customer_mix:
    type: bar
    query: queries.customer_mix
    title: New / Repeat Customers
    x: customer_type
    y: customers

  revenue_by_type:
    type: bar
    query: queries.revenue_by_type
    title: Monthly Revenue by Product Type
    x: month
    y: revenue
    color: product_type
    style:
      orientation: vertical
      stack: zero
      number_format: currency

  top_products:
    type: table
    query: queries.top_products
    title: Top 10 Products by Revenue
    style:
      columns:
        product_name:
          label: Product
        product_type:
          label: Type
        items_sold:
          label: Units Sold
          format: integer
        revenue:
          label: Revenue
          format: currency_whole
        gross_profit:
          label: Gross Profit
          format: currency_whole

rows:
  - cols: [kpi_revenue, kpi_orders, kpi_customers, kpi_aov]
  - title: Revenue Trends
    grid:
      columns: 24
      items:
        - item: revenue_trend
          width: 16
        - item: customer_mix
          width: 8
  - revenue_by_type
  - top_products
Amounts are aligned to pre-tax. KPIs and monthly trends use orders.subtotal at the order level, while revenue by product type uses order_items.product_price at the line item level.
Since one order can have multiple line items, only the revenue by product type aggregation references order_items.
jaffle_shop's orders.yml has two tests: order_total = subtotal + tax_paid and order_items_subtotal = subtotal. This ensures that the totals match, allowing comparison on the same basis as pre-tax revenue.
The variable name is location to match jaffle_shop's model name locations, with the display label set to "Location." locations is the model representing stores.
Syntax can be checked offline with dct docs cheatsheet or dct docs charts.
# Execute queries in Snowflake, render results to PNG, and save
dct render charts/jaffle_overview.yml --format png --output renders\jaffle_overview.png

# Open the output PNG
start renders\jaffle_overview.png
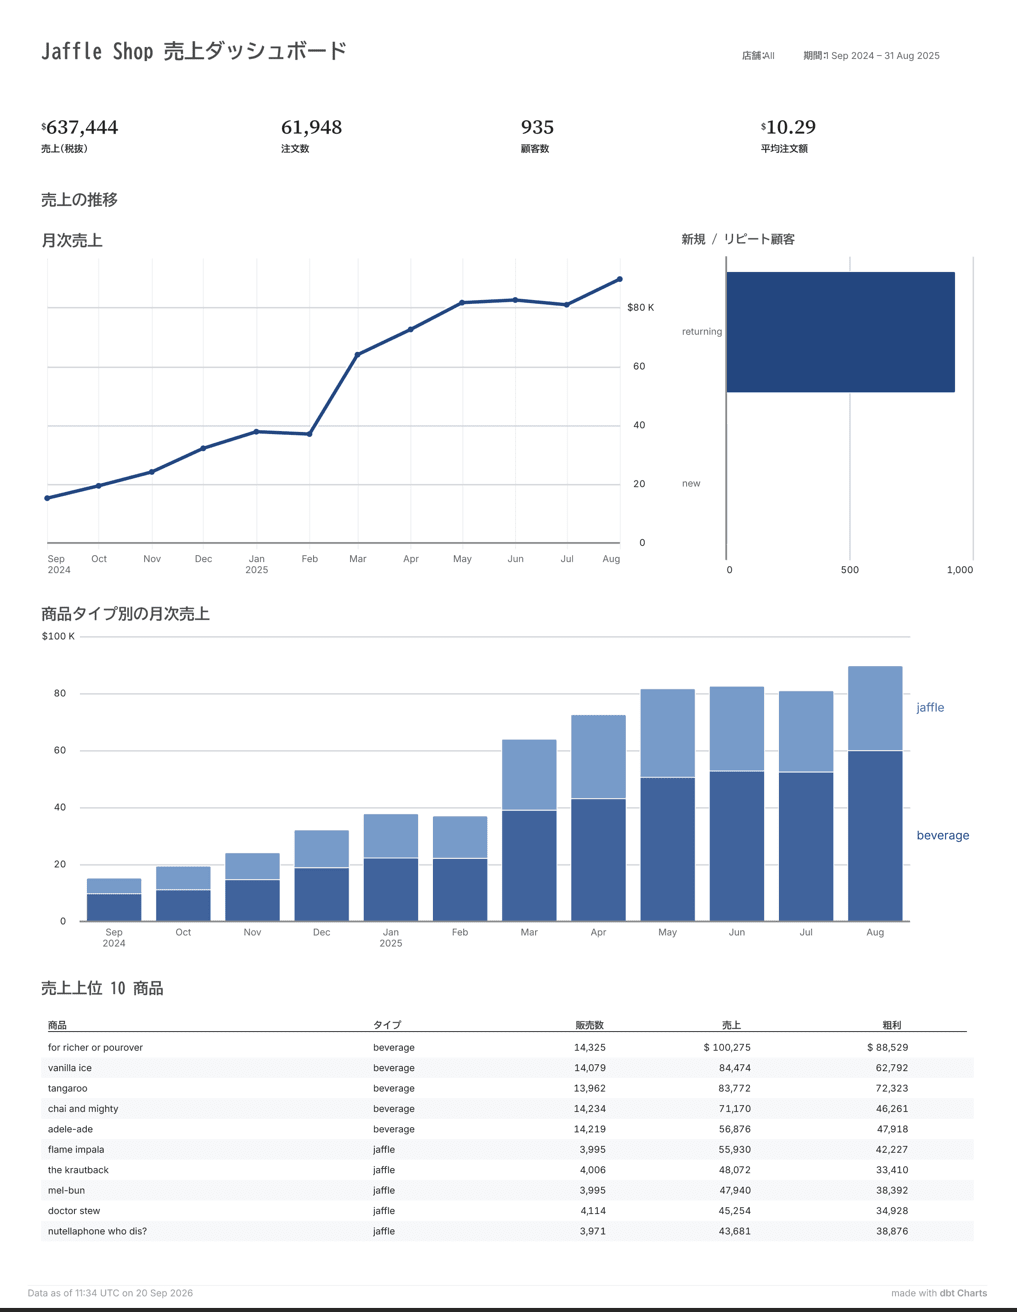
Verifying with Snowflake's QUERY_HISTORY
According to the official documentation, queries issued by dbt Charts have attributes such as app=dbt-charts attached. In Snowflake, three items—app, dbt Charts version, and surface—are set in JSON format in QUERY_TAG. Additional information such as board name and query name is said to be attached as comments in the query. Also, if query_tag is already set on the connection side, dbt Charts reportedly does not overwrite that value.
We verified by running the following in Snowsight.
-- List queries issued by dbt Charts in reverse chronological order
select start_time, query_type, query_tag, left(query_text, 100) as query_text_head
from table(JAFFLE_SHOP_DB.information_schema.query_history_by_user(result_limit => 500))
where query_tag like '%dbt-charts%'
order by start_time desc;
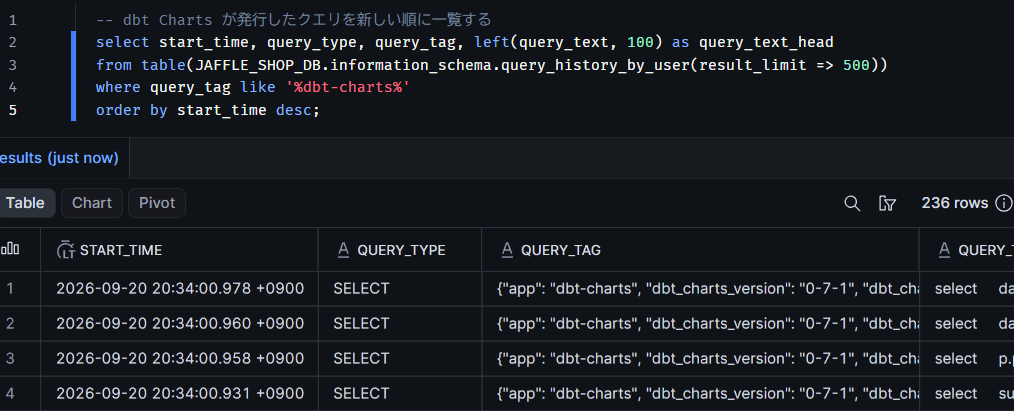
Closing thoughts
With dbt Charts, we were able to declare and visualize boards in a single YAML file.
dbt Semantic Layer is not yet supported at this point, but it's being planned in dbt-labs/dbt-charts#1, so I'm looking forward to it!
I hope this article is helpful to someone!