Tried running DeepSeek V4 Flash-0731 on a single DGX Spark with llama.cpp

This page has been translated by machine translation. View original
Introduction
Hello, I'm Morishige from Classmethod's Manufacturing Business Technology Department.
The official version of DeepSeek V4 Flash was released on July 31. It's an update called 0731 that replaces the preview version, and Unsloth's GGUF was also published on the same day. I was curious whether a 284B model could run on a single DGX Spark at hand, so I immediately verified it from multiple approaches.
Actually, back in May, I wrote an article about running the same DeepSeek V4 Flash on DGX Spark. However, at that time llama.cpp didn't support V4, and the only option was to use DwarfStar 4, an inference engine written specifically for DeepSeek V4 by antirez. The article ended with "When DeepSeek releases an updated version of V4 Flash, I'd like to try again."
Both of those homework assignments have now been completed. An updated version has been released, and llama.cpp also added DeepSeek V4 support at the end of June. The next question then becomes: "How much difference is there when running a model that previously only worked with a dedicated engine on a general-purpose runner?"
To give the conclusion first, both 2-bit and 3-bit fit on a single DGX Spark, and llama.cpp outperformed the dedicated engine in speed. However, startup time was the opposite — llama.cpp took 6.5 minutes while DwarfStar 4 took 17 seconds, a 22x difference. The result was that what you choose depends on whether you keep it running persistently or only start it when needed.
This article introduces the results of running Unsloth's GGUF on a single DGX Spark and comparing it against the dedicated engine from four angles: memory, speed, long-form text, and quality. I hope it resonates with people trying to run 284B on a 128GB-class machine.
What Changed in 0731
DeepSeek-V4-Flash-0731 is the official release replacing the preview version, and the model architecture is the same as DeepSeek-V4-Flash-DSpark. This means the speculative decoding module is included from the start. Parameters are 284B, of which 13B are active. The license is MIT, and it claims a 1M context.
I'll quote the benchmarks published by the official team. These are values published by DeepSeek, not something I measured myself.
| Benchmark | V4-Flash-0731 | V4-Flash (Preview) | V4-Pro (Preview) | GLM-5.2 | Opus-4.8 |
|---|---|---|---|---|---|
| Terminal Bench 2.1 | 82.7 | 61.8 | 72.1 | 81.0 | 85.0 |
| NL2Repo | 54.2 | 39.4 | 38.5 | 48.9 | 69.7 |
| Cybergym | 76.7 | 38.7 | 52.7 | — | 83.1 |
| DeepSWE | 54.4 | 7.3 | 12.8 | 46.2 | 58.0 |
| Toolathlon-Verified | 70.3 | 49.7 | 55.9 | 59.9 | 76.2 |
| Agents' Last Exam | 25.2 | 15.8 | 16.5 | 23.8 | 25.7 |
| AutomationBench Public | 25.1 | 10.8 | 12.8 | 12.9 | 27.2 |
The improvement from preview is dramatic. DeepSWE went from 7.3 to 54.4, and Cybergym from 38.7 to 76.7. This is consistent with the claim that agentic capabilities were trained while keeping the same architecture. It surpasses GLM-5.2 in many categories, while falling short of Opus-4.8 in all categories.
There's one thing to be careful about when reading this. Code-related tasks were measured using an evaluation framework called "minimal mode of DeepSeek Harness," which has not been released yet. This means there is currently no way for third parties to reproduce these scores. I also chose not to chase this down, and instead focused on observing behavior, speed, and quality on my own setup.
How llama.cpp Came to Support DeepSeek V4
In the May article, I wrote that "integration into llama.cpp is struggling." When I looked into what happened after that, I found it had been merged into the main branch at the end of June.
| PR | Date | Content | Status |
|---|---|---|---|
| #24162 | 2026-06-29 | DeepSeek V4 core support (25 files / +4,698 lines) | Merged ✅ |
| #25414 | 2026-07-22 | Chat template fix for DeepSeek4 | Merged ✅ |
| #25945 | 2026-07-22 | Fix representative op for APE tensor in arch | Merged ✅ |
| #25871 | 2026-07-31 | Force unified K and V cache type, enable FA if V is quantized | Merged ✅ |
| #26398 | 2026-08-01 | Add chat template for 0731 | Open 🟡 |
| #25642 | 2026-07-14 | NextN/MTP speculative decoding | Closed ❌ |
| #25683 | 2026-07-15 | DSpark speculator support | Closed ❌ |
My local clone was stuck at b9538 from June 6, so when I grepped src/llama-arch.cpp, there were 0 hits for deepseek4. After upgrading to b10216, which was the latest at the time of verification, it changed to 2 hits, with corresponding table entries for LLM_ARCH_DEEPSEEK4 and "deepseek4" added. There's also a dedicated implementation file src/models/deepseek4.cpp with 1,203 lines, making it clear this wasn't a half-hearted effort.
The bottom two rows are notable. They're not waiting to be merged — both are closed. This means speculative decoding has not been merged into the llama.cpp main branch. DwarfStar 4 has it as a standard feature, so the same model ends up with different available features depending on which engine you use.
The build itself went through smoothly. With the combination of aarch64 and CUDA 13.0, no warnings or errors.
cmake -B build-cuda -DGGML_CUDA=ON -DCMAKE_CUDA_ARCHITECTURES=121 \
      -DCMAKE_BUILD_TYPE=Release -DLLAMA_CURL=ON
cmake --build build-cuda -j"$(nproc)" --target llama-server llama-cli llama-bench
It took 150 seconds. I kept the existing build/ and separated it into build-cuda/, so if things went wrong I could fall back to the original binaries.
There were also 3 months' worth of changes on the DwarfStar 4 side. In the May article I wrote that you could build it with a single make, but now running plain make just outputs a list of targets and exits.
DS4 build targets:
  make cuda-spark          Build CUDA for DGX Spark / GB10
  make cuda-generic        Build CUDA for a generic local CUDA GPU
  make strix-halo          Build ROCm for Strix Halo / gfx1151
  ...
  make dspark-verify-depth Run DSpark speculative verification smoke if support GGUF is present
DGX Spark and GB10 now have a dedicated target called cuda-spark. Three months ago it relied on automatic detection with -arch=native, so this is a quietly welcome change. The build took 54 seconds, and the number of generated binaries increased from 3 to 5.
Can 284B Fit in 128GB?
At the time of writing, Unsloth distributes 13 types of quantizations. I'm listing file sizes as actually measured from the HF API. Note that Unsloth has also announced "adding even smaller quantizations," so this list will grow. If something below 1-bit becomes available, that would open up options for machines with less memory.
| Quantization | GB (10^9) | GiB | Shards | Outlook on single DGX Spark |
|---|---|---|---|---|
| UD-IQ1_S | 82.5 | 76.9 | 3 | Comfortable |
| UD-IQ2_M | 90.9 | 84.7 | 3 | Verified in this test |
| UD-Q2_K_XL | 96.8 | 90.2 | 3 | Fits |
| UD-IQ3_XXS | 104.2 | 97.1 | 4 | Verified in this test |
| UD-IQ3_S | 116.1 | 108.1 | 4 | Almost no room for KV |
| UD-Q3_K_XL | 128.2 | 119.4 | 4 | Not possible |
| UD-Q4_K_XL | 155.1 | 144.4 | 5 | Not possible |
| UD-Q8_K_XL | 161.9 | 150.8 | 5 | Not possible |
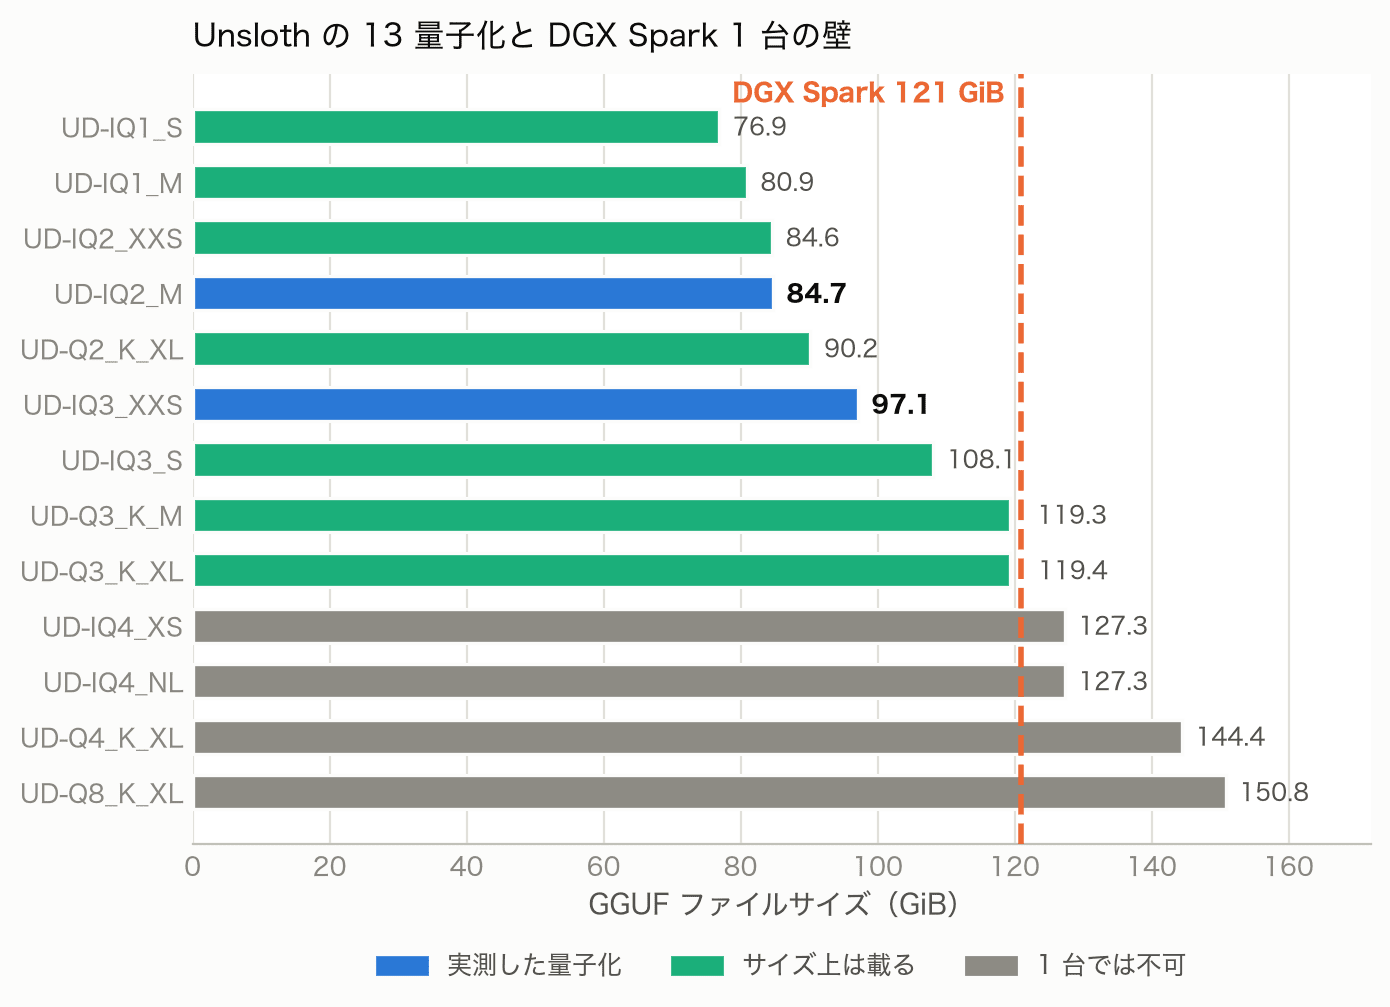
The 13 types listed in GiB with a dashed line at 121 GiB. Blue are the 2 that were actually measured this time, green fit within the size limit, gray don't fit on one unit. Up to UD-IQ3_S at 108.1 GiB falls inside the line, but there's no margin left for KV and context.
I hit a snag here. Unsloth's documentation listed the required memory for 3-bit as 110–135 GB, and since DGX Spark has 128GB I thought it might be tight.
It was a unit mix-up. Both this table and the file sizes use GB in units of 10^9 bytes, but the 121 returned by free -g is in GiB. Converting to GB gives about 130 GB, so 104.2 GB for 3-bit fits. Unsloth itself lists UD-IQ3_XXS as recommended for 128GB machines in their tutorials.
So I tried actually booting UD-IQ2_M (2-bit) and UD-IQ3_XXS (3-bit) on real hardware.
| Item | UD-IQ2_M (84.7 GiB) | UD-IQ3_XXS (97.1 GiB) |
|---|---|---|
| Time to load completion | 6 min 21 sec | 6 min 30 sec |
| GPU allocated | 86,534 MiB | 100,470 MiB |
| System used | 89–91 GB | 102 GB |
| Available remaining | 30–32 GB | 18 GB |
The load time is measured externally until /health returns 200. There's some roughness here due to a 15-second polling interval.
Both loaded successfully. Even with 3-bit, 18 GB of headroom remains. KV and context will sit on top of this, so how far we can extend long-form text is covered in the next section.
What catches the eye in this table is actually the load time. Six and a half minutes. DwarfStar 4 measured in May loaded weights of a similar class in 26 seconds, so there's a 14x gap.
To investigate the cause, I traced the process during loading and found cumulative reads bloated to 116 GiB, which is 1.37x the model itself. Read speed was 1.7 GB per 20 seconds, roughly 86 MB/s. That's too slow given the raw bandwidth of NVMe. For the 3-bit UD-IQ3_XXS, this ratio grew even further to 1.44x.
Since GB10 has unified memory, the GPU buffer holding 84.5 GiB and the page cache for the mmapped file compete for the same physical memory. Once 84.5 GiB is allocated on the GPU side, only about 30 GiB is left for the page cache, so by the time you reach the latter half of reading the 84.7 GiB file, the first half has already been evicted. This back-and-forth is showing up as bloated reads. The fact that the ratio grows with model size is consistent with this explanation.
--no-mmap might mitigate this, but I didn't test that for comparison this time. If anyone has tried it, I'd love to know the result.
Is llama.cpp Faster Than the Dedicated Engine?
Same terminal, same day, same 0731-generation weights — I compare llama.cpp and DwarfStar 4 side by side. I turned off thinking mode on both to keep them aligned.
One caveat. llama-server has prompt caching enabled by default, so repeating the same prompt skips prefill from the second request onward. At first I didn't notice this and got a strange result where prefill dropped from 411 tok/s to 41 tok/s — a 10x decrease — while wall time actually got shorter. I added "cache_prompt": false to requests and re-measured. If you're doing the same kind of measurement, watch out for this.
| ctx | DwarfStar 4 (81 GiB) | llama.cpp UD-IQ2_M (84.7 GiB) | llama.cpp UD-IQ3_XXS (97.1 GiB) |
|---|---|---|---|
| 2,048 | 16.53 | 17.35 | 16.56 |
| 8,192 | 14.32 | 17.05 | 16.21 |
| 32,768 | 13.59 | 16.05 | 15.49 |
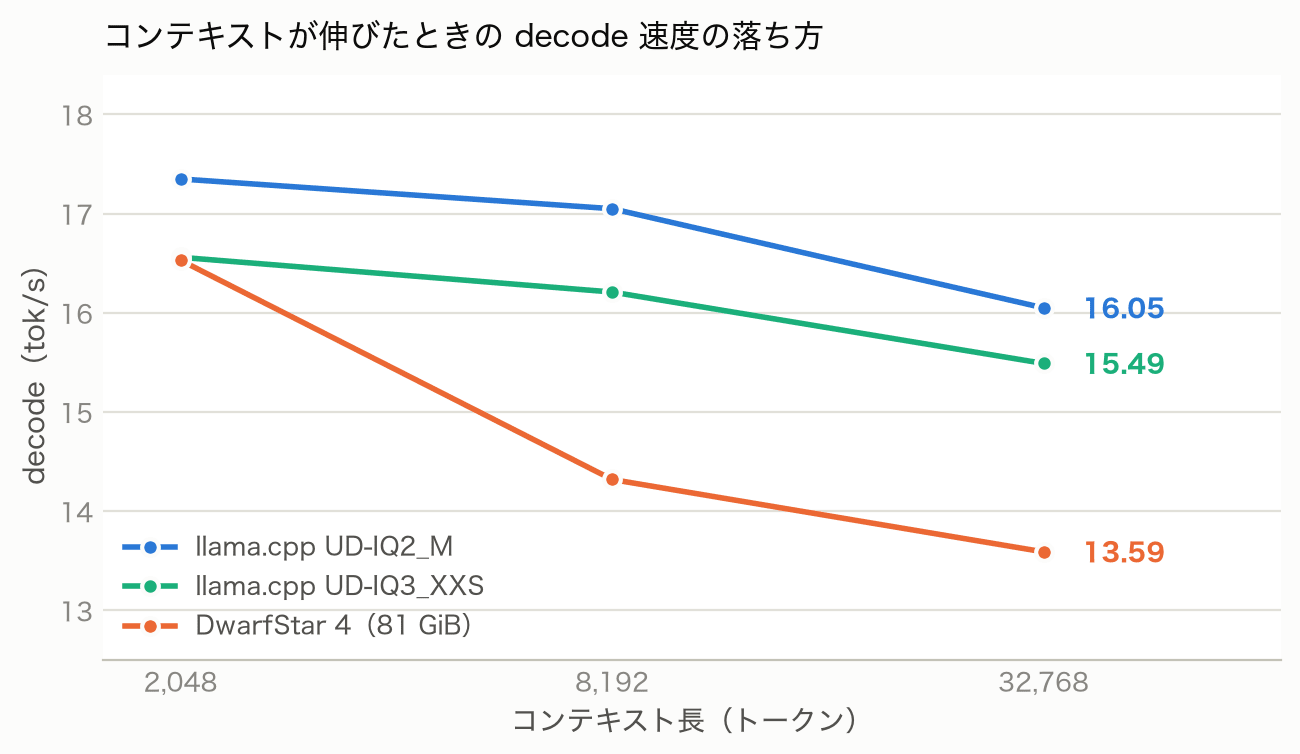
All 3 series trend downward, but the slopes differ. DwarfStar 4 (orange) drops sharply between 2,048 and 8,192, while the two llama.cpp lines stay nearly flat all the way to 32,768.
llama.cpp outperformed at every point for decode. Moreover, the gap widens as context grows. DwarfStar 4 drops 13% from 16.53 to 14.32 when extending from 2,048 to 8,192, while llama.cpp only drops 2% from 17.35 to 17.05. The decay patterns are different.
Prefill showed the same trend.
| ctx | DwarfStar 4 | llama.cpp UD-IQ2_M | llama.cpp UD-IQ3_XXS |
|---|---|---|---|
| 2,048 | 359.64 | 448.07 | 411.37 |
| 8,192 | 379.03 | 444.15 | 406.23 |
| 32,768 | 340.12 | 401.30 | 370.83 |
Looking at the difference between 2-bit and 3-bit, 2-bit was only about 3.6–5.2% faster for decode. The file size ratio is 84.7 / 97.1 = 0.872, so if it were purely determined by memory bandwidth alone, you'd expect a 1.15x difference. The fact that the measured result stays at 1.05x suggests that factors beyond bandwidth — such as dequantization cost per quantization format — are at play.
However, there are axes where DwarfStar 4 wins decisively.
| Axis | DwarfStar 4 | llama.cpp |
|---|---|---|
| Startup time | 17.1 sec | 381–390 sec |
| File size | 81 GiB | 84.7–97.1 GiB |
| KV size shown explicitly | Shown in logs | Not shown |
| Speculative decoding | Standard | Not merged |
| Disk KV persistence | Available | Not available |
22x faster startup. That's a difference that shapes how you use it. If you pay the 6.5-minute startup once a day and keep it running, llama.cpp's speed advantage matters. If you only spin it up when needed, DwarfStar 4's 17 seconds matters.
Enabling Speculative Decoding Actually Made It Slower
To rule out the possibility that DwarfStar 4 could reverse the result with features llama.cpp lacks, I tried enabling DSpark speculative decoding. I added the 5.6 GiB support GGUF and measured with greedy decoding. DSpark only works at temperature 0, so these numbers can't be directly compared with llama.cpp measured at temperature 1.0. What's valid here is a comparison where only the speculation path is toggled within the same engine.
I used LRU cache implementation and unit test creation as tasks. The README says "predictable continuations, especially code, benefit the most," so these are the conditions most favorable to DSpark.
| Condition | generation | vs target-only |
|---|---|---|
| target-only (no support GGUF) | 17.06 | — |
--dspark-strict (support loaded only) |
16.99 | −0.4% |
--dspark (speculation enabled) |
13.25 | −22.3% |
--dspark --dspark-confidence 0 |
8.37 | −50.9% |
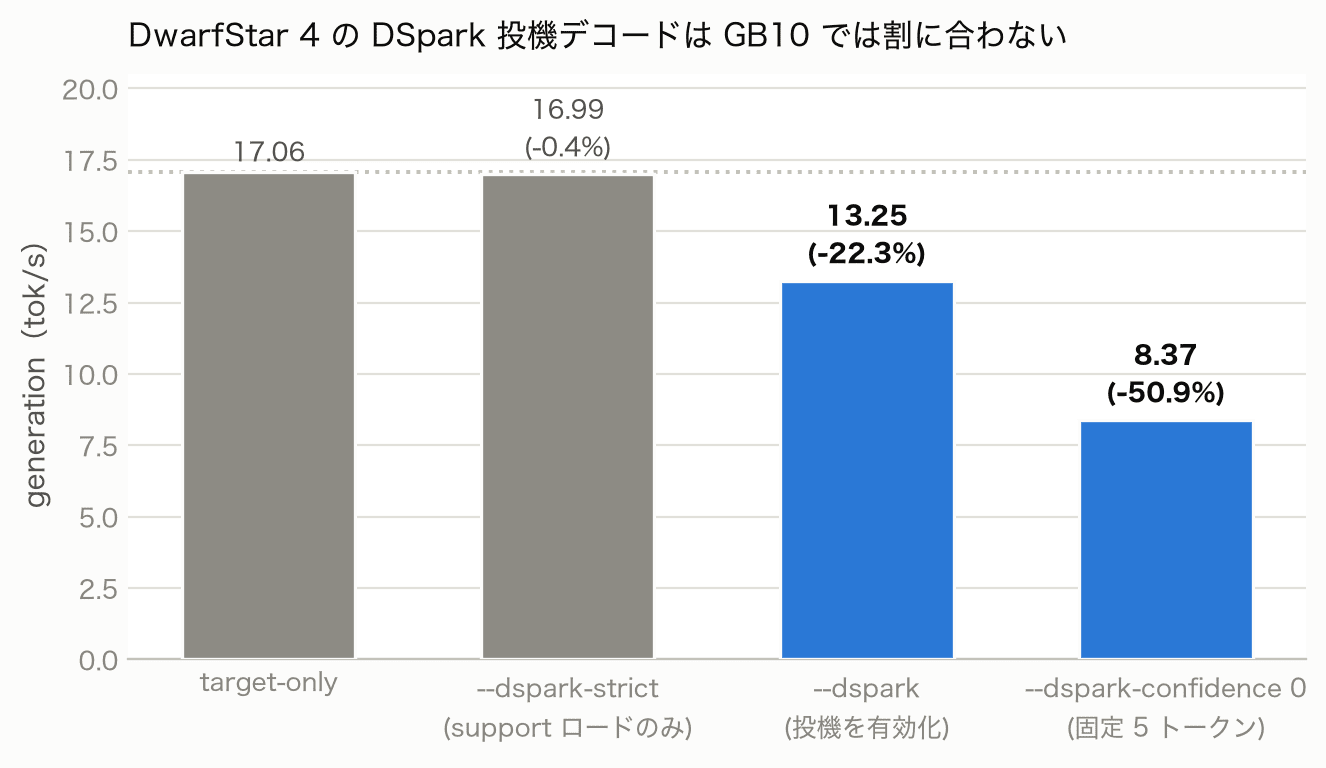
The left 2 bars are gray (target-only equivalent), the right 2 are blue (speculation enabled). The second bar, which only loads the support GGUF, stays nearly at the same height as the baseline, and the third bar drops clearly once speculation is enabled.
Enabling speculation made it 22% slower. Moreover, the more aggressive the speculation, the slower it got — the setting that always looks 5 tokens ahead cut the speed in half.
The second row, --dspark-strict, loads the support GGUF while keeping decisions target-only. The fact that this only drops by −0.4% tells us loading it alone is nearly harmless, and the damage comes from the speculation itself. DwarfStar 4's README also notes "on low-yield prompts, it won't be faster, or might even be slower," explicitly calling it an experimental feature.
However, this was the case when combining the antirez original engine with the antirez support GGUF. I'd come to understand why this caveat was necessary while writing the article.
Re-measuring With a Different Combination
While writing, someone pointed me to a recipe published specifically for a single DGX Spark. It showed 26.7 tok/s for a single request, which differs from my measured 17 tok/s range.
Reading through it, the base weights were the same file I used. Only two things were different.
| Item | Verification up to this point | Published recipe |
|---|---|---|
| Base weights | ...imatrix-0731.gguf 80.8 GiB |
Same file |
| Engine | antirez original 54b36ed |
Entrpi's DGX Spark fork v0.5.2 |
| Drafter | antirez DSpark-support 5.6 GiB |
bleysg's DSpark-drafter-Q2K-Q8 6.5 GiB |
| Speculation entry | ds4 CLI |
ds4-server side |
If only 2 variables differ, I can replicate it. I built the fork at v0.5.2, downloaded the drafter, and with the same engine, same server mode, and same prompt, toggled only the speculation.
Since ds4-server doesn't return timings, I measured at two generation lengths — 128 and 512 — and derived decode from the slope. Since the prompt is shared, subtracting eliminates prefill.
| Arm | gen 128 | gen 512 | Decode from slope |
|---|---|---|---|
--no-spec |
7.548s | 27.145s | 19.59 tok/s |
--dspark |
8.367s | 27.624s | 19.94 tok/s |
The difference was +1.8%. Essentially within margin of error. Initially I was converting a single-point wall time directly and getting "+14.4%," but that number included prefill — after re-measuring with two points, the difference disappeared. Note that wall time variance was large (11.6–28.5 seconds across 5 runs under the same conditions), so there are limits to precision here.
Whether speculative decoding speeds things up depends on the combination of engine and drafter. Using the antirez support GGUF with the original engine caused 22% loss; using bleysg's drafter with the fork showed almost no difference. "Adding it will make it faster" — that's not a conclusion I can draw from my measurements.
Measuring the Claimed "Serving 12 Agents Simultaneously"
Up to this point, I've only been looking at single-request speed. But that's not actually what this recipe is emphasizing. The published figure says "59 tok/s serving 12 AI agents at once."
This 59 tok/s is the total throughput of one machine, not the speed of a single request. Even in the same figure, the per-agent share is drawn as decreasing on a downward slope. Comparing it with a single-request number as "faster or slower" leads to misreading.
So I measured across 1, 2, 4, 8, and 12 parallel requests, the same axes as in the figure.
| Concurrent requests | Total tok/s (measured) | Total tok/s (published) | Per request (measured) |
|---|---|---|---|
| 1 | 22.43 | 29.9 | 22.44 |
| 2 | 30.73 | 31.4 | 15.39 |
| 4 | 46.82 | 46.8 | 11.75 |
| 8 | 57.93 | 57.7 | 7.29 |
| 12 | 56.89 | 59.0 | 4.79 |
At 4 and 8 parallel, the results matched published values within 0.4% error. At 12 parallel, 56.89 vs 59.0 — the shape of the curve reproduces cleanly. On the other hand, the single-request number was about 25% lower. Since measurement conditions aren't published, I can't trace where the gap came from.
Two things can be read from this. One is that total throughput plateaus around 8 parallel. 57.93 at 8, and it actually slightly drops to 56.89 at 12. The other is that per-request share drops to 4.79 tok/s at 12 parallel. That's less than one-fifth of the single-request 22.44.
In other words, this setup is not designed for one person to use quickly, but for multiple agents to work simultaneously. If you're running a dozen background tasks in parallel, one machine can handle 12 streams — but for interactive one-at-a-time use, the experience won't feel different. The 59 tok/s figure needs to be read with that premise in mind.
The Previous Article's Numbers Shouldn't Be Compared Directly
There's a reason I re-measured DwarfStar 4 with 0731 weights throughout. Comparing the 14.81 tok/s from the May article with llama.cpp today would lead to a wrong conclusion.
| ctx | Previous (preview, 2026-05-13) | This time (0731, 2026-08-01) | Gain |
|---|---|---|---|
| 2,048 | 13.2 | 16.53 | +25.2% |
| 32,768 | 11.8 | 13.59 | +15.2% |
| 65,536 | 11.4 | 13.04 | +14.4% |
| Startup | 26.4 sec | 17.1 sec | −35% |
DwarfStar 4 itself had gotten 14–25% faster over these 3 months. Since both the engine and the weights have changed, the previous article's numbers can only be used as "a snapshot from 3 months ago." When pulling numbers from older articles, doing a re-measurement like this first is the safe approach.
Long Context and KV Cache
Continuing from the 18 GB of headroom remaining with 3-bit — I tried booting with context extended from 32,768 to 131,072.
| ctx | Startup | GPU allocated | Available remaining |
|---|---|---|---|
| 32,768 | 6 min 30 sec | 100,470 MiB | 18 GB |
| 131,072 | 6 min 45 sec | 103,254 MiB | 15 GB |
This also started up. Even with ctx multiplied by 4, only 2,784 MiB was added.
Since b10216's logs are concise and don't report KV size, I back-calculate from these two points. 98,304 tokens worth is 2,784 MiB, so about 29.0 KB per token. Breaking it down with this coefficient: KV at ctx 32,768 is 928 MiB, and the model itself is 99,542 MiB = 97.2 GiB. The actual file size is 97.1 GiB, so it lines up perfectly. The assumption that KV grows linearly appears valid.
DwarfStar 4 reports this clearly at startup.
ds4: memory: KV 0.78 GiB (raw 0.36 + compressed 0.42) + buffers 0.25 GiB = 1.03 GiB context
ds4: memory detail: ctx=32768 prefill_cap=4096 raw_kv_rows=4352 compressed_kv_rows=16418
0.78 GiB at ctx 32,768, which is 24.4 KB per token. That's about 16% smaller than llama.cpp's 29.0 KB, but the order of magnitude is the same. DeepSeek V4's compressed KV is working properly on the llama.cpp side too.
Incidentally, the "about 14KB per token for compressed KV" I wrote in the May article was only looking at the compressed side. Including raw, the total is 24.4 KB. This article aligns everything with raw included.
So what about 1M context? Extrapolating linearly with 29.0 KB/token gives the following.
| Quantization | Model body | KV @ 1M (extrapolated) | Total | Fits in 121 GiB? |
|---|---|---|---|---|
| UD-IQ3_XXS | 97.1 GiB | 29.0 GiB | 126.1 GiB | Exceeds ❌ |
| UD-IQ2_M | 84.7 GiB | 29.0 GiB | 113.7 GiB | Borderline 🟡 |
| UD-IQ1_S | 76.9 GiB | 29.0 GiB | 105.9 GiB | Possible ✅ |
1M context with 3-bit doesn't work. 2-bit would fit mathematically, but considering runtime buffers, there's almost no margin. This is an extrapolated value — I did not actually attempt to boot with ctx 1048576.
Feeding a 66K-Token Japanese Document
Numbers alone don't give a feel for things, so I tried throwing actual long-form text at it. I concatenated 9 articles from my DGX Spark series, totaling 130,331 characters, and added the instruction "summarize in Japanese in one paragraph and list 5 recurring themes." This is the same task I gave to DwarfStar 4 in the May article.
| Item | Previous DwarfStar 4 (preview) | This time llama.cpp UD-IQ3_XXS |
|---|---|---|
| Prompt tokens | 56,662 | 65,868 (+16.2%) |
| Generated | 900 | 629 |
| Total time | 298.7 sec | 293.05 sec |
| Prefill | ~238 tok/s | 266.55 tok/s |
It processed 16% more tokens in nearly the same time.
I also checked the content of the output. "Memory bandwidth (273 GB/s)," "Qwen3.6-35B-A3B-NVFP4 with MTP enabled at 108 tok/s becomes the new champion," "In quantization format comparisons, the winner and loser flip depending on the model" — all of these match statements in the original articles. No numerical mix-ups were found. A 284B model compressed down to 3-bit was able to read a 66K-token Japanese technical document and summarize it while preserving factual accuracy.
During this test, I noticed two things about prefill speed. One is that the larger the context you allocate at startup, the slower the prefill becomes. When launched with ctx 32,768, 30K tokens submitted gave 370.83 tok/s, but launching with ctx 131,072 brought it down to around 300 tok/s.
The other is that within a single prefill pass, it also gets slower as it progresses.
n_tokens = 30720, progress = 0.47, 301.57 tokens per second
n_tokens = 34816, progress = 0.53, 297.36 tokens per second
n_tokens = 38912, progress = 0.59, 292.95 tokens per second
n_tokens = 43008, progress = 0.65, 288.63 tokens per second
It drops monotonically, landing at an average of 266.55 tok/s across the entire 66K tokens. Attention costs must be kicking in at more than linearly with context length. If you extrapolate prefill speed measured on short prompts to long-form inputs, your estimate will be more optimistic than reality.
Is the 284B crushed down to 3-bit usable?
Even if it runs fast, there's no point if the content is broken. Unsloth's published quality table only has rows for 4-bit and 8-bit, and the quality for the bit widths used this time is not listed, so I needed to verify it myself.
First, I submitted 5 questions that could be judged mechanically. Both the 2-bit UD-IQ2_M and the 3-bit UD-IQ3_XXS answered all 5 correctly. Enumerating 1 to 20, 2 to the power of 10, code generation using sorted(set(xs)), a Japanese explanation, and a task to return only PONG as instructed. All passed.
The only difference was the Japanese character count constraint. For the instruction "within 50 characters," UD-IQ2_M produced 51 characters and UD-IQ3_XXS produced 40 characters. However, since these are the results of a single run each, this alone is not enough to say that 3-bit is more faithful to instructions. To claim a relationship between quantization and instruction compliance, you would need to run the same problem multiple times.
Next, I reused the harness built for the July Laguna S 2.1 article as-is to look at tool calling and agentic code fixing. Since both are built to hit an OpenAI-compatible endpoint using only the standard library, what was written for vLLM could be pointed at llama.cpp without modification.
Tool calling scored 6 correct out of 6.
| ID | Content | Result | Extracted Arguments |
|---|---|---|---|
| a1-minimal | Minimal function call | PASS | {'city': 'Paris'} |
| a2-selection | Selection from multiple tools | PASS | {'expression': '1847 * 362'} |
| a3-nested | Nested argument structure | PASS | {'title': ..., 'assignee': {...}} |
| a4-parallel | Parallel calls | PASS | {'osaka', 'tokyo'} |
| a5-japanese | Japanese arguments | PASS | {'keyword': 'ほうじ茶ラテ'} |
| a6-notool | Situation where tools should not be used | PASS | calls=[] (correctly not called) |
The agentic task of operating a pseudo filesystem was also solved in 5 turns, with 0 broken tool_calls. Detection of tool_calls during streaming also worked.
For code fixing, I used a custom mini-repository styled like an inventory management CLI. It's code that couldn't possibly be mixed into training data, and we start from a state where 5 out of 12 tests are failing. Scoring is done by the harness running pytest, so the model's self-reporting is irrelevant.
baseline: 5 failed / 7 passed
final:    0 failed / 12 passed  score 5/5  turns=5  wall=72.9s  stop=final_answer
It fixed everything in 5 turns and 73 seconds. Since stop=final_answer, it was not cut off by a turn limit or timeout. With the same harness, Laguna S 2.1 took 5 turns / 41.7 seconds, and Qwen3.6-35B-A3B took 10 turns / 23.4 seconds, so the number of steps is on par with Laguna. The elapsed time is longest this time, but since the engine, quantization, and presence of speculation all differ, this should not be read as a judgment of model superiority.
Thinking mode control also worked as expected. By default, reasoning_content is returned separately, and inserting "chat_template_kwargs": {"enable_thinking": false} into the request makes it disappear. Being able to align conditions with DwarfStar 4's --nothink is thanks to this behavior.
In summary, my hands-on impression is that even in the 2-bit and 3-bit ranges not covered by Unsloth's quality table, sufficient quality for agentic use is maintained. However, please bear in mind that these are the results of a single run per task.
Summary
Here is a summary of the results from running DeepSeek-V4-Flash-0731 on a single DGX Spark and comparing it against the dedicated engine.
| Item | Verdict | Notes |
|---|---|---|
| 2-bit fits in 121 GiB | ○ | GPU 84.5 GiB, available 30 GB remaining |
| 3-bit fits in 121 GiB | ○ | GPU 98.1 GiB, available 18 GB remaining. As per official documentation |
| Launch with ctx 131,072 | ○ | GPU 103.3 GiB, KV approx. 29.0 KB/token |
| 1M context | △ | Exceeds capacity with 3-bit by calculation. Barely fits with 2-bit. However, this is an extrapolated value |
| Decode speed | ○ | 15.5–17.4 tok/s. Exceeds DwarfStar 4 at all points |
| Startup time | × | 6.5 minutes. 22x longer compared to DwarfStar 4's 17 seconds |
| Speculative decoding | △ | llama.cpp not supported. ds4 is −22% vs. original / +1.8% with fork depending on combination |
| Japanese / tool call / code fixing | ○ | 6/6, 5/5 even with 3-bit. No factual errors in long-form summarization |
The part I wrote in May about "integration into llama.cpp being difficult" had been resolved by PR #24162 at the end of June. A dedicated 1,203-line implementation was added, and the official 0731 version can be read without issues. The general-purpose runner also exceeded the dedicated engine in speed, which was honestly surprising.
On the other hand, there is the trade-off of a 6.5-minute startup time. Because unified memory creates contention between GPU buffers and page cache, the larger the model, the more disadvantageous it becomes. If you're using it as a persistent service, this number won't bother you, but if you're launching it every time you use it, the dedicated engine that starts up in 17 seconds will be more comfortable. The conclusion I settled on is that the choice changes not based on "which is faster" but on "how you intend to use it."
There are also things left unfinished. I wasn't able to take a controlled comparison of whether --no-mmap improves startup time, and I couldn't measure the acceptance rate of speculative decoding either. I only extrapolated the 1M context and didn't actually attempt to launch it. The published recipe's 26.7 tok/s also couldn't be reproduced on my end, topping out at 19.9 tok/s. I'd like to verify these points at the next opportunity.
As for speculative decoding on the llama.cpp side, it looks like it will be a rather long wait. Both related PRs remain closed, so rather than waiting for a merge, it will be more a matter of waiting for a different implementation to emerge. That said, the PR adding a chat template for 0731 is active, and even during the 2 days I was writing this article, the tag advanced from b10216 to b10223. Once speculative decoding lands in the main branch, I'd like to do a rematch under equal conditions.
Reference Links
- unsloth/DeepSeek-V4-Flash-0731-GGUF
- Unsloth's DeepSeek V4 Execution Guide — Memory requirement table and recommended settings
- llama.cpp PR #24162 — DeepSeek V4 main support (merged 2026-06-29)
- llama.cpp PR #25871 — K/V cache type unification (merged 2026-07-31)
- llama.cpp PR #25642 — NextN/MTP speculative decoding (closed without merge)
- llama.cpp PR #25683 — DSpark speculator support (closed without merge)
- llama.cpp PR #26398 — Chat template addition for 0731 (open as of 2026-08-02)
- antirez/ds4 (DwarfStar 4)
- antirez/deepseek-v4-gguf — Dedicated GGUF for DwarfStar 4 and DSpark support
- MiaAI-Lab/DeepSeek-v4-Flash-One-DGX-Spark — Launch recipe for a single DGX Spark
- Entrpi/ds4 — DGX Spark-targeted fork used by the above (this article verifies
v0.5.2) - bleysg/DeepSeek-V4-Flash-DSpark-drafter-GGUF — DSpark drafter used on the fork side
- Running DeepSeek V4 Flash 284B on a DGX Spark with DwarfStar 4 (Article from 2026-05-13)
- Running DeepSeek V4 Flash-DSpark on Two DGX Spark Nodes (Article from 2026-06-30)