[Update] Amazon GuardDuty Investigation (Preview) Now Allows You to Capture the Process Leading to an Investigation's Conclusion as Records

This page has been translated by machine translation. View original
Introduction
An update added listing of "investigation records" to GuardDuty Investigation (Preview).
GuardDuty Investigation is a feature in which AI investigates findings and accounts and returns a risk level and recommended actions. I introduced the feature itself in a previous article.
Until now, you could only see the conclusion of an investigation, and you couldn't tell what the AI examined to reach it.
With this update, you can retrieve the process leading to the conclusion step by step. I tried it out, so here is a summary.
Update overview
In the documentation update dated November 11, 2026, the ListInvestigationRecords API was added to list these records. In the console, you can see them in the "Investigation timeline" tab on the investigation details page.
The difference in roles from the existing GetInvestigation is as follows.
| API | What it returns |
|---|---|
GetInvestigation |
The conclusion of the investigation: status, risk level, confidence, and summary |
ListInvestigationRecords |
The process leading to the conclusion: data retrieved, observations about the environment, and analyses performed |
There are five record types.
| Type | Content |
|---|---|
UPDATE |
Progress markers. The request that started the investigation and responses from GuardDuty |
FETCH |
Data retrieved for the investigation. What was requested and what was received |
OBSERVATION |
Facts confirmed about the environment. Affected resources, detection coverage, and so on |
ANALYSIS |
Assessments derived from the data. Threat assessments, etc. |
METADATA |
Information about the investigation itself. Duration, etc. |
Each record has a title (Title). A narrative describing the step (Narrative) and structured data (SupportingData) may or may not be attached.
Records are returned in the order they were created, that is, oldest first.
Trying it out
Prerequisites
AI_ANALYST("AI powered investigations - Preview" in the console) must be enabled on the GuardDuty detector- If you use the AWS CLI, use version 2.40.2 or later
Creating an investigation
To view records, you need a completed investigation.
This time, I used a sample finding I had generated earlier as the investigation target.
The finding type is UnauthorizedAccess:IAMUser/InstanceCredentialExfiltration.InsideAWS.
After enabling AI_ANALYST on the detector, create an investigation.
> aws guardduty update-detector \
    --detector-id $DETECTOR_ID \
    --features '[{"Name": "AI_ANALYST", "Status": "ENABLED"}]'

> aws guardduty create-investigation \
    --detector-id $DETECTOR_ID \
    --trigger-prompt "Investigate finding $FINDING_ID in account $ACCOUNT_ID"

{
    "InvestigationId": "a1b2c3d4-5678-90ab-cdef-EXAMPLE11111"
}
How to create investigations and write prompts is covered in a previous article.
Investigations run asynchronously. This one took about 6.5 minutes from start to completion.
> aws guardduty get-investigation \
    --detector-id $DETECTOR_ID \
    --investigation-id $INVESTIGATION_ID \
    --query 'Investigation.{Status:Status,RiskLevel:RiskLevel,Confidence:Confidence,StartTime:StartTime,EndTime:EndTime}'

{
    "Status": "COMPLETED",
    "RiskLevel": "Info",
    "Confidence": "High",
    "StartTime": "2026-11-13T09:13:52.859000+09:00",
    "EndTime": "2026-11-13T09:20:17.908000+09:00"
}
Although the finding has High severity, the risk level came out as Info.
It seems the AI recognized it as a sample finding. Let's check the records to see why it made that judgment.
Listing records with the AWS CLI
Pass the detector ID and the investigation ID to list-investigation-records.
The output is long as is, so I'll use jq to list only the creation time, type, and title.
> aws guardduty list-investigation-records \
    --detector-id $DETECTOR_ID \
    --investigation-id $INVESTIGATION_ID \
  | jq -r '.Records[] | "\(.CreatedAt)\t\(.Type)\t\(.Title)"'

2026-11-13T09:14:16.120000+09:00	UPDATE	User Request
2026-11-13T09:14:16.121000+09:00	UPDATE	Assistant Response
2026-11-13T09:14:23.883000+09:00	FETCH	Fetching Finding
2026-11-13T09:14:24.396000+09:00	FETCH	Fetching Detector details
2026-11-13T09:14:28.676000+09:00	FETCH	Fetching Finding Type Documentation
2026-11-13T09:14:31.749000+09:00	OBSERVATION	EC2 Instance Details
2026-11-13T09:15:11.322000+09:00	OBSERVATION	No Related Findings Correlated to Instance Credential Exfiltration
2026-11-13T09:15:11.323000+09:00	ANALYSIS	Threat Assessment: Instance Credential Exfiltration Outside the Instance
2026-11-13T09:18:42.590000+09:00	ANALYSIS	Credential Exfiltration Vector Analysis (InsideAWS)
2026-11-13T09:18:54.780000+09:00	ANALYSIS	Post-Exfiltration Activity Pattern
2026-11-13T09:19:27.582000+09:00	OBSERVATION	CloudTrail Session Activity
2026-11-13T09:19:27.583000+09:00	ANALYSIS	API Activity and Persistence Analysis
2026-11-13T09:19:27.584000+09:00	OBSERVATION	Impacted Resources
2026-11-13T09:19:43.036000+09:00	OBSERVATION	EC2 instance credentials used from an unaffiliated AWS account (sample finding)
2026-11-13T09:19:43.036000+09:00	OBSERVATION	Detection coverage for account 123456789012
2026-11-13T09:20:34.364000+09:00	METADATA	Investigation Metadata
Sixteen records were returned.
You can read the flow: it retrieved the finding, the detector settings, and the finding type documentation, checked the resources and related findings, and then moved on to analysis.
Filtering by type
If you pass types separated by spaces to --record-types, only those types are returned.
Let's narrow it down to observations and analyses only.
> aws guardduty list-investigation-records \
    --detector-id $DETECTOR_ID \
    --investigation-id $INVESTIGATION_ID \
    --record-types OBSERVATION ANALYSIS \
  | jq '.Records | length'

10
The 16 records became 10. Let's look at the records among these that seem to be the basis for the Info judgment.
First, the OBSERVATION record where it searched for related findings. Here is an excerpt of the Narrative.
Three correlation queries were run over the wide window of 2026-09-21T23:27:52Z to 2026-10-05T23:27:52Z
(±7 days around the primary's updatedAt): (1) same_behavior on remote IP 198.51.100.0 ...,
(2) same_resource on EC2 instance i-99999999 ..., and (3) same_resource on IAM access key
GeneratedFindingAccessKeyId .... All three queries returned zero results.
It searched for related findings under three conditions, covering 7 days before and after the finding's update time.
The conditions are the same source IP address, the same EC2 instance, and the same access key. All are recorded as returning 0 results.
The summary also states the search results, but in the records you can even see the fields used for the search.
Next, the detection coverage record. This one has SupportingData attached.
{
    "RecordId": "a1b2c3d4-5678-90ab-cdef-EXAMPLE22222",
    "Type": "OBSERVATION",
    "Title": "Detection coverage for account 123456789012",
    "Narrative": "CloudTrail management events, S3 data events, VPC Flow Logs, DNS logs, EKS Audit Logs, Lambda network logs, RDS login events, EBS Malware Protection and Runtime Monitoring are enabled. Automated agent management for EC2 and ECS Fargate is disabled, and EKS Runtime Monitoring is disabled.",
    "CreatedAt": "2026-11-13T09:19:43.036000+09:00",
    "SupportingData": {
        "Observation": {
            "ObservationType": "DETECTION_COVERAGE",
            "DetectionCoverage": {
                "ProtectionPlans": [
                    {
                        "Name": "CLOUD_TRAIL",
                        "Status": "ENABLED"
                    },
                    {
                        "Name": "EC2_AGENT_MANAGEMENT",
                        "Status": "DISABLED"
                    },
                    {
                        "Name": "RUNTIME_MONITORING",
                        "Status": "ENABLED"
                    }
                ],
                "FoundationalDataSources": [
                    "CLOUD_TRAIL",
                    "DNS_LOGS",
                    "FLOW_LOGS"
                ],
                "KeyObservation": "This finding comes from CloudTrail management events, which are enabled, so the core detection for credential misuse is in place. Runtime Monitoring is enabled, but EC2 automated agent management is disabled. Unless the GuardDuty agent was installed by hand on instance i-99999999, there may be no host-level view of how the credentials were pulled from the instance, such as a process calling the instance metadata service. VPC Flow Logs and DNS logs are enabled and give network context for the instance."
            }
        }
    }
}
ProtectionPlans actually had 13 items, but I abbreviated it to 3.
KeyObservation describes what can and cannot be seen with the current settings for this finding type.
It points out that although Runtime Monitoring is enabled, EC2 automated agent management is disabled, so unless the agent was installed manually, behavior on the host may not be visible.
Keeping such premises in mind makes it easier to grasp what is not visible when reading the investigation's conclusion.
Checking in the console
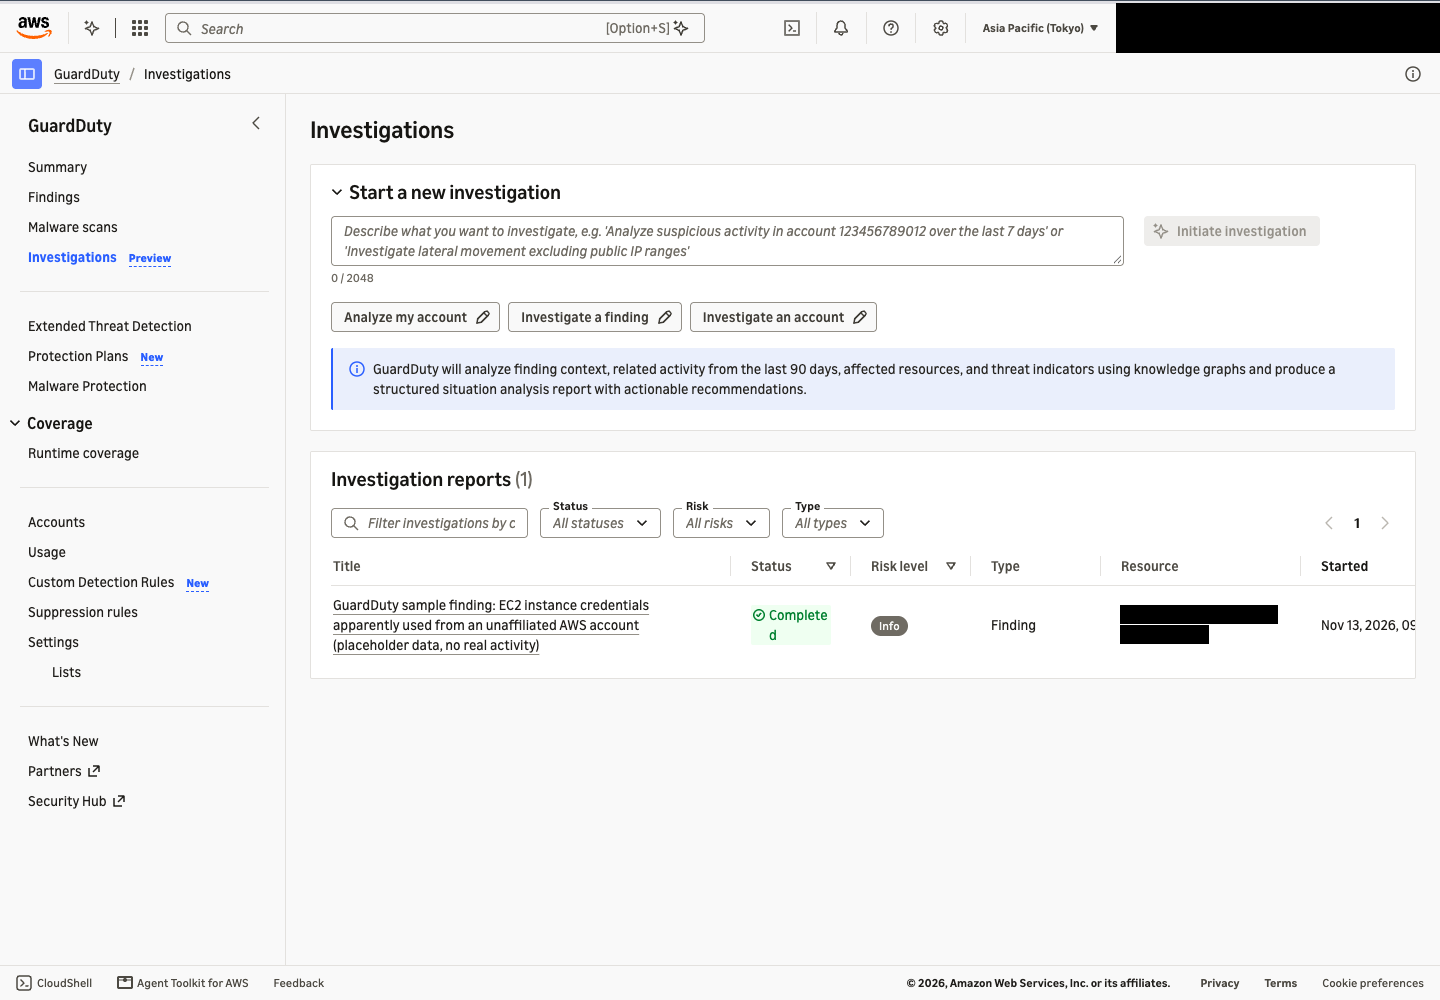
Open "Investigations" in the GuardDuty console to see the list of investigations.
Select the investigation title to open the details page, and then select the "Investigation timeline" tab.
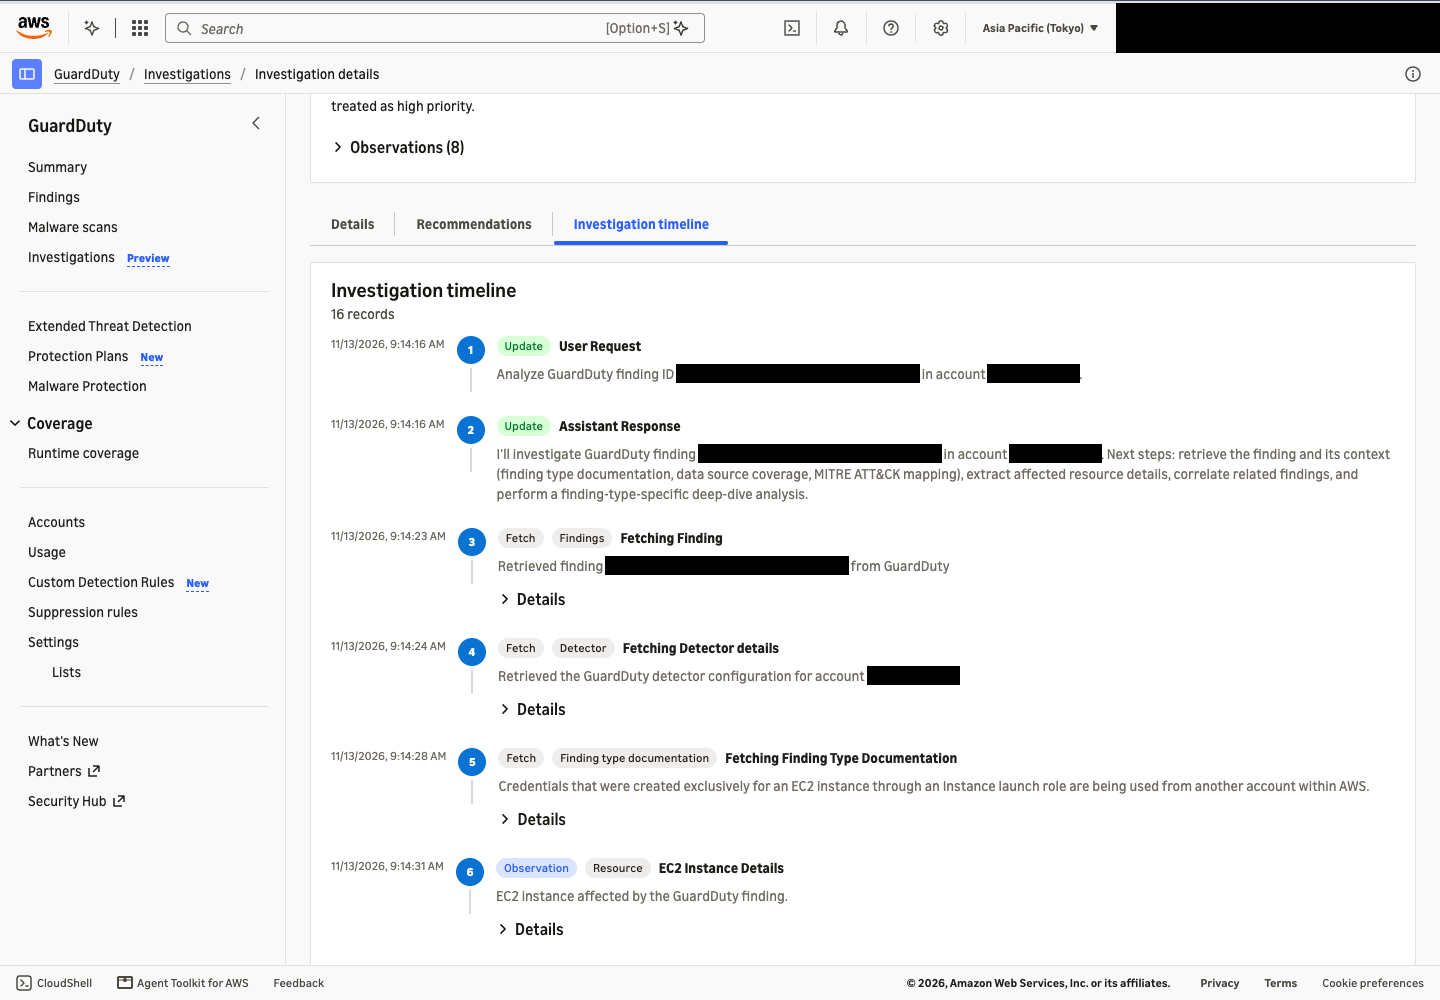
The 16 records retrieved with the CLI are lined up chronologically with numbers. The type is shown as a badge, and the title and Narrative can be read as they are.
Records that have SupportingData show "Details", and opening it lets you check the structured data. Let's open the detection coverage record from earlier.
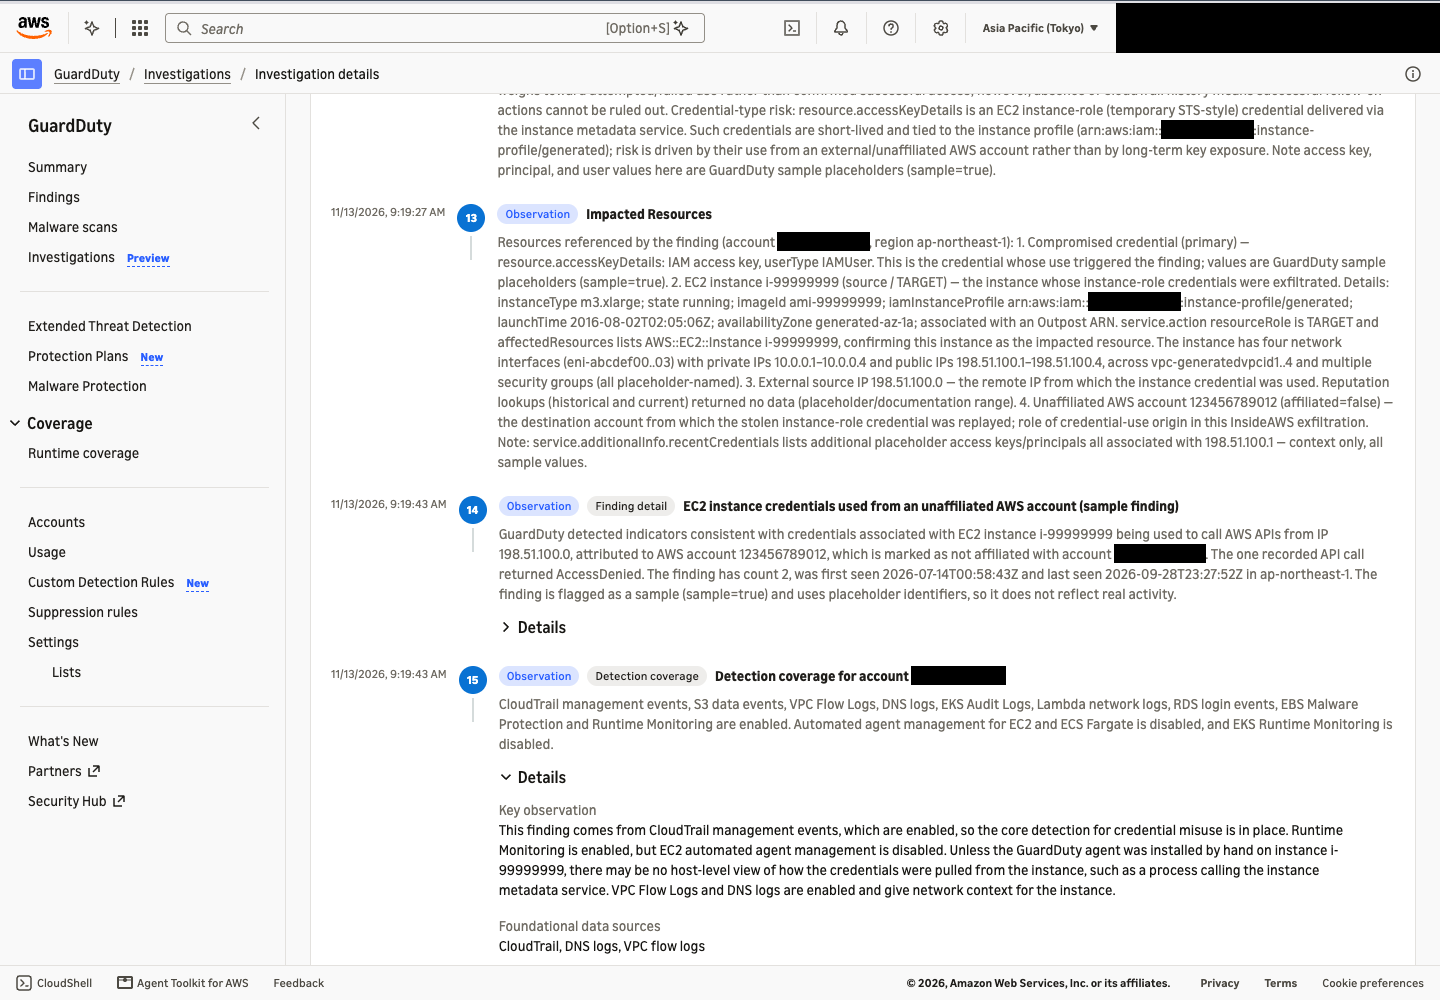
For just reading, the console was easier. If you want to save the records or pass them to other tools, the CLI seems better suited.
Notes
Records are not returned until the investigation completes
Records are returned only when the investigation status is COMPLETED.
Calling it while the investigation is running doesn't cause an error; an empty list and the status were returned.
> aws guardduty list-investigation-records \
    --detector-id $DETECTOR_ID \
    --investigation-id $INVESTIGATION_ID

{
    "Records": [],
    "Status": "RUNNING",
    "InvestigationId": "a1b2c3d4-5678-90ab-cdef-EXAMPLE11111"
}
In the console as well, "Available once the investigation completes." is displayed while it is running.
According to the documentation, the list is also empty if the investigation fails (FAILED).
Summary
With GuardDuty Investigation (Preview), you can now retrieve the process by which an investigation reached its conclusion as records.
In the investigation I tried, even the conditions and period used to search for related findings, and the detection coverage at the time of the investigation, were preserved.
This seems useful in situations where you want to verify from the records whether a conclusion is reasonable, such as when a High severity finding is judged as risk level Info like this time.
The console timeline can be viewed without any additional preparation, so when you try an investigation, open it together.
That was Jun Suzuki.
References
- Document history for Amazon GuardDuty
- GuardDuty Investigation (Preview) / Listing investigation records - Amazon GuardDuty
- ListInvestigationRecords - Amazon GuardDuty API Reference
- list-investigation-records - AWS CLI Command Reference
- [Update] Amazon GuardDuty's AI investigation feature "GuardDuty Investigation" is now in preview
- I tried various trigger-prompts for GuardDuty Investigation with the AWS CLI