![[Small tidbit] I checked how many DPUs are consumed by DSQL when accessing 1 million records with SQL](https://images.ctfassets.net/ct0aopd36mqt/wp-thumbnail-7e1a533ff5b5a6a8eb5d4ae82bacdcd6/5845157a3c941213d245ec7cdf7358e8/amazon-aurora)
[Small tidbit] I checked how many DPUs are consumed by DSQL when accessing 1 million records with SQL
I am Iwata from the Retail App Co-creation Department in Osaka.
One of the characteristics of Aurora DSQL's pricing structure is the billing for DPU (Distributed Processing Units). The official documentation explains DPUs as follows:
You can think of a DPU as a measure of how much work the system does to run your SQL workload. This includes compute resources used to execute query logic (e.g., joins, functions, aggregations) as well as the input/output (I/O) required to read from and write to storage.
Based on this explanation, a DPU seems to be a logical value rather than something that can be calculated precisely based on the number of rows processed. It's probably calculated from metrics like CPU consumption or page accesses, but it doesn't appear to be something users can accurately estimate in advance.
While verification results have already been published in the blog below, I'd like to share the results of several different patterns I tested myself.
Note that all the verifications in this test were performed on a single-region cluster.## 1. Generating 1 million records with CTE and aggregating the maximum value SQL
First, let's try the following SQL.
			EXPLAIN ANALYZE
WITH RECURSIVE v1 (n) AS (
    SELECT
        1
UNION ALL
    SELECT
        n + 1
    FROM
        v1
    WHERE
        n < 1000000
)
SELECT
    max(n)
FROM
    v1;
I borrowed this SQL from a source introduced here.
Daily Notes: Differences in error numbers when temporary tables fill up storage on MySQL 8.0.32
The execution result was as follows.
			---------------------------------------------------------------------------------------------------------------------------
 Aggregate  (cost=3.34..3.35 rows=1 width=4) (actual time=750.832..750.833 rows=1 loops=1)
   CTE v1
     ->  Recursive Union  (cost=0.00..2.65 rows=31 width=4) (actual time=0.005..490.542 rows=1000000 loops=1)
           ->  Result  (cost=0.00..0.01 rows=1 width=4) (actual time=0.004..0.004 rows=1 loops=1)
           ->  WorkTable Scan on v1 v1_1  (cost=0.00..0.23 rows=3 width=4) (actual time=0.000..0.000 rows=1 loops=1000000)
                 Filter: (n < 1000000)
                 Rows Removed by Filter: 0
   ->  CTE Scan on v1  (cost=0.00..0.62 rows=31 width=4) (actual time=0.007..685.521 rows=1000000 loops=1)
 Planning Time: 0.393 ms
 Execution Time: 755.357 ms
(10 rows)
The total DPU values from CloudWatch during this time period were as follows.
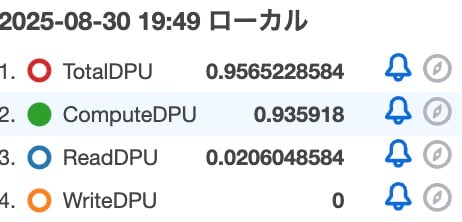
| Metric | Value |
|---|---|
| TotalDPU | 0.9565228584 |
| ComputeDPU | 0.935918 |
| ReadDPU | 0.0206048584 |
| WriteDPU | 0 |
Here's the next SQL:
			EXPLAIN ANALYZE
WITH RECURSIVE v1 (n) AS (
    SELECT
        1
UNION ALL
    SELECT
        n + 1
    FROM
        v1
    WHERE
        n < 1000000
),
v2 AS (
    SELECT
        n,
        MD5(n::text) AS m
    FROM
        v1
)
SELECT
    max(m)
FROM
    v2;
Similar to the previous SQL, this generates 1 million records with CTE, then calculates hash values with MD5 for all 1 million records.
Here are the execution results:
			---------------------------------------------------------------------------------------------------------------------------
 Aggregate  (cost=3.58..3.58 rows=1 width=32) (actual time=1644.433..1644.435 rows=1 loops=1)
   CTE v1
     ->  Recursive Union  (cost=0.00..2.65 rows=31 width=4) (actual time=0.003..496.009 rows=1000000 loops=1)
           ->  Result  (cost=0.00..0.01 rows=1 width=4) (actual time=0.002..0.002 rows=1 loops=1)
           ->  WorkTable Scan on v1 v1_1  (cost=0.00..0.23 rows=3 width=4) (actual time=0.000..0.000 rows=1 loops=1000000)
                 Filter: (n < 1000000)
                 Rows Removed by Filter: 0
   ->  CTE Scan on v1  (cost=0.00..0.62 rows=31 width=4) (actual time=0.005..695.582 rows=1000000 loops=1)
 Planning Time: 0.427 ms
 Execution Time: 1649.016 ms
(10 rows)
The execution plan is the same. While CPU resource usage likely changes due to text casting and MD5 processing, what about DPU? The metrics are as follows:
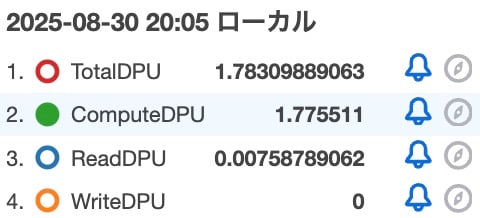
| Metric | Value |
|---|---|
| TotalDPU | 1.78309889063 |
| ComputeDPU | 1.775511 |
| ReadDPU | 0.00758789062 |
| WriteDPU | 0 |
Compared to the previous example, the ComputeDPU has nearly doubled.## 3-1. Using CROSS JOIN to generate 1 million records and aggregate maximum value SQL
Next, we'll use the test table pgbench_accounts generated by pgbench to create 1 million records with CROSS JOIN and retrieve the maximum value. For reference, the definition of the pgbench_accounts table is as follows:
			CREATE TABLE public.pgbench_accounts (
	aid int4 NOT NULL,
	bid int4 NULL,
	abalance int4 NULL,
	filler bpchar(84) NULL,
	CONSTRAINT pgbench_accounts_pkey PRIMARY KEY (aid)
)
Here's the SQL we'll execute:
			EXPLAIN ANALYZE
SELECT
    MAX(aid)
FROM
    (SELECT * FROM pgbench_accounts LIMIT 100) a
CROSS JOIN
    (SELECT * FROM pgbench_accounts LIMIT 100) b
CROSS JOIN
    (SELECT * FROM pgbench_accounts LIMIT 100) c
The execution result is as follows:
			--------------------------------------------------------------------------------------------------------------------------------------------------------------------------------------------------------------------
 Aggregate  (cost=46285.83..46285.84 rows=1 width=4) (actual time=214.686..214.689 rows=1 loops=1)
   ->  Nested Loop  (cost=31150.25..43785.83 rows=1000000 width=4) (actual time=6.010..164.826 rows=1000000 loops=1)
         ->  Nested Loop  (cost=20766.83..20898.81 rows=10000 width=0) (actual time=4.789..7.871 rows=10000 loops=1)
               ->  Limit  (cost=10383.42..10385.78 rows=100 width=352) (actual time=1.392..2.213 rows=100 loops=1)
                     ->  Index Only Scan using pgbench_accounts_pkey on pgbench_accounts  (cost=10383.42..12325.02 rows=82267 width=352) (actual time=1.391..2.202 rows=100 loops=1)
                           -> Storage Scan on pgbench_accounts_pkey (cost=10383.42..12325.02 rows=82267 width=352) (actual rows=100 loops=1)
                               Projections:
                               -> B-Tree Scan on pgbench_accounts_pkey (cost=10383.42..12325.02 rows=82267 width=352) (actual rows=143 loops=1)
               ->  Materialize  (cost=10383.42..10387.28 rows=100 width=0) (actual time=0.034..0.047 rows=100 loops=100)
                     ->  Subquery Scan on b  (cost=10383.42..10386.78 rows=100 width=0) (actual time=3.391..4.118 rows=100 loops=1)
                           ->  Limit  (cost=10383.42..10385.78 rows=100 width=352) (actual time=3.391..4.106 rows=100 loops=1)
                                 ->  Index Only Scan using pgbench_accounts_pkey on pgbench_accounts pgbench_accounts_1  (cost=10383.42..12325.02 rows=82267 width=352) (actual time=3.390..4.096 rows=100 loops=1)
                                       -> Storage Scan on pgbench_accounts_pkey (cost=10383.42..12325.02 rows=82267 width=352) (actual rows=100 loops=1)
                                           Projections:
                                           -> B-Tree Scan on pgbench_accounts_pkey (cost=10383.42..12325.02 rows=82267 width=352) (actual rows=155 loops=1)
         ->  Materialize  (cost=10383.42..10387.28 rows=100 width=4) (actual time=0.000..0.006 rows=100 loops=10000)
               ->  Subquery Scan on c  (cost=10383.42..10386.78 rows=100 width=4) (actual time=1.216..1.949 rows=100 loops=1)
                     ->  Limit  (cost=10383.42..10385.78 rows=100 width=352) (actual time=1.215..1.939 rows=100 loops=1)
                           ->  Index Only Scan using pgbench_accounts_pkey on pgbench_accounts pgbench_accounts_2  (cost=10383.42..12325.02 rows=82267 width=352) (actual time=1.215..1.928 rows=100 loops=1)
                                 -> Storage Scan on pgbench_accounts_pkey (cost=10383.42..12325.02 rows=82267 width=352) (actual rows=100 loops=1)
                                     Projections: aid
                                     -> B-Tree Scan on pgbench_accounts_pkey (cost=10383.42..12325.02 rows=82267 width=352) (actual rows=167 loops=1)
 Planning Time: 27.866 ms
 Execution Time: 214.788 ms
(24 rows)
Unlike before, we can now see that it's actually accessing the table data. There's an Index Only Scan showing, which is due to the fact that DSQL tables are stored in a format similar to clustered indexes, unlike standard PostgreSQL
(Reference)
Let's also check the metrics.
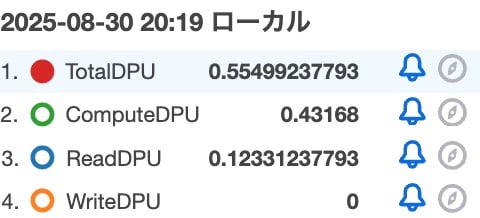
| Metric | Value |
|---|---|
| TotalDPU | 0.55499237793 |
| ComputeDPU | 0.43168 |
| ReadDPU | 0.12331237793 |
| WriteDPU | 0 |
ReadDPU has increased, but the ComputeDPU is lower than in the previous verification pattern 2 since we're not calculating hash values. Additionally, it's noteworthy that the ComputeDPU is also smaller compared to verification pattern 1. In pattern 1, there was an n + 1 calculation, so perhaps that's what influenced the difference?## 3-2. Using CROSS JOIN to generate one million records and adding +1 to the aggregation SQL
Since the CTE version had a larger Compute DPU, I added the + 1 processing to the previous SQL and checked again.
			EXPLAIN ANALYZE
SELECT
    MAX(c.aid)
FROM
    (SELECT aid + 1 as aid,bid,abalance,filler FROM pgbench_accounts LIMIT 100) a
CROSS JOIN
    (SELECT aid + 1 as aid,bid,abalance,filler FROM pgbench_accounts LIMIT 100) b
CROSS JOIN
    (SELECT aid + 1 as aid,bid,abalance,filler FROM pgbench_accounts LIMIT 100) c
Here are the execution results:
--------------------------------------------------------------------------------------------------------------------------------------------------------------------------------------------------------------------
Aggregate (cost=46286.08..46286.09 rows=1 width=4) (actual time=214.528..214.531 rows=1 loops=1)
-> Nested Loop (cost=31150.25..43786.08 rows=1000000 width=4) (actual time=3.705..164.101 rows=1000000 loops=1)
-> Nested Loop (cost=20766.83..20898.81 rows=10000 width=0) (actual time=2.546..5.693 rows=10000 loops=1)
-> Limit (cost=10383.42..10385.78 rows=100 width=352) (actual time=1.262..2.108 rows=100 loops=1)
-> Index Only Scan using pgbench_accounts_pkey on pgbench_accounts (cost=10383.42..12325.02 rows=82267 width=352) (actual time=1.261..2.097 rows=100 loops=1)
-> Storage Scan on pgbench_accounts_pkey (cost=10383.42..12325.02 rows=82267 width=352) (actual rows=100 loops=1)
Projections:
-> B-Tree Scan on pgbench_accounts_pkey (cost=10383.42..12325.02 rows=82267 width=352) (actual rows=196 loops=1)
-> Materialize (cost=10383.42..10387.28 rows=100 width=0) (actual time=0.013..0.026 rows=100 loops=100)
-> Subquery Scan on b (cost=10383.42..10386.78 rows=100 width=0) (actual time=1.275..2.008 rows=100 loops=1)
-> Limit (cost=10383.42..10385.78 rows=100 width=352) (actual time=1.274..1.996 rows=100 loops=1)
-> Index Only Scan using pgbench_accounts_pkey on pgbench_accounts pgbench_accounts_1 (cost=10383.42..12325.02 rows=82267 width=352) (actual time=1.274..1.986 rows=100 loops=1)
-> Storage Scan on pgbench_accounts_pkey (cost=10383.42..12325.02 rows=82267 width=352) (actual rows=100 loops=1)
Projections:
-> B-Tree Scan on pgbench_accounts_pkey (cost=10383.42..12325.02 rows=82267 width=352) (actual rows=196 loops=1)
-> Materialize (cost=10383.42..10387.53 rows=100 width=4) (actual time=0.000..0.006 rows=100 loops=10000)
-> Subquery Scan on c (cost=10383.42..10387.03 rows=100 width=4) (actual time=1.153..1.876 rows=100 loops=1)
-> Limit (cost=10383.42..10386.03 rows=100 width=352) (actual time=1.153..1.865 rows=100 loops=1)
-> Index Only Scan using pgbench_accounts_pkey on pgbench_accounts pgbench_accounts_2 (cost=10383.42..12530.69 rows=82267 width=352) (actual time=1.152..1.855 rows=100 loops=1)
-> Storage Scan on pgbench_accounts_pkey (cost=10383.42..12530.69 rows=82267 width=352) (actual rows=100 loops=1)
Projections: aid
-> B-Tree Scan on pgbench_accounts_pkey (cost=10383.42..12530.69 rows=82267 width=352) (actual rows=196 loops=1)
Planning Time: 29.143 ms
Execution Time: 214.646 ms
(24 rows)
```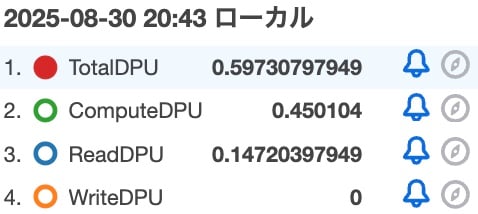
| Metric | Value |
| ---------- | ------------- |
| TotalDPU | 0.59730797949 |
| ComputeDPU | 0.450104 |
| ReadDPU | 0.14720397949 |
| WriteDPU | 0 |
The ComputeDPU increased from verification pattern 3-1, but it's still smaller than verification pattern 1. Perhaps this is because with CTE we're executing addition operations on 1 million records, whereas with CROSS JOIN we're only executing addition processing on the contents of the subquery (100×3)?## 4. SQL for generating 1 million records using CROSS JOIN and calculating maximum hash value
I adjusted the SQL pattern using CROSS JOIN, added MD5 hash value calculation, and readjusted the SQL to process 1 million records.
```sql
EXPLAIN ANALYZE
SELECT max_aid FROM
(
SELECT
MAX(MD5((c.aid + 1)::text)) as max_aid
FROM
(SELECT * FROM pgbench_accounts LIMIT 100) a
CROSS JOIN
(SELECT * FROM pgbench_accounts LIMIT 100) b
CROSS JOIN
(SELECT * FROM pgbench_accounts LIMIT 100) c
) d
Here are the execution results:
Aggregate (cost=56285.83..56285.84 rows=1 width=32) (actual time=1094.924..1094.928 rows=1 loops=1)
-> Nested Loop (cost=31150.25..43785.83 rows=1000000 width=4) (actual time=4.575..175.501 rows=1000000 loops=1)
-> Nested Loop (cost=20766.83..20898.81 rows=10000 width=0) (actual time=3.662..7.352 rows=10000 loops=1)
-> Limit (cost=10383.42..10385.78 rows=100 width=352) (actual time=1.118..2.397 rows=100 loops=1)
-> Index Only Scan using pgbench_accounts_pkey on pgbench_accounts (cost=10383.42..12325.02 rows=82267 width=352) (actual time=1.117..2.384 rows=100 loops=1)
-> Storage Scan on pgbench_accounts_pkey (cost=10383.42..12325.02 rows=82267 width=352) (actual rows=100 loops=1)
Projections:
-> B-Tree Scan on pgbench_accounts_pkey (cost=10383.42..12325.02 rows=82267 width=352) (actual rows=131 loops=1)
-> Materialize (cost=10383.42..10387.28 rows=100 width=0) (actual time=0.025..0.039 rows=100 loops=100)
-> Subquery Scan on b (cost=10383.42..10386.78 rows=100 width=0) (actual time=2.532..3.290 rows=100 loops=1)
-> Limit (cost=10383.42..10385.78 rows=100 width=352) (actual time=2.531..3.278 rows=100 loops=1)
-> Index Only Scan using pgbench_accounts_pkey on pgbench_accounts pgbench_accounts_1 (cost=10383.42..12325.02 rows=82267 width=352) (actual time=2.531..3.267 rows=100 loops=1)
-> Storage Scan on pgbench_accounts_pkey (cost=10383.42..12325.02 rows=82267 width=352) (actual rows=100 loops=1)
Projections:
-> B-Tree Scan on pgbench_accounts_pkey (cost=10383.42..12325.02 rows=82267 width=352) (actual rows=155 loops=1)
-> Materialize (cost=10383.42..10387.28 rows=100 width=4) (actual time=0.000..0.006 rows=100 loops=10000)
-> Subquery Scan on c (cost=10383.42..10386.78 rows=100 width=4) (actual time=0.908..1.664 rows=100 loops=1)
-> Limit (cost=10383.42..10385.78 rows=100 width=352) (actual time=0.907..1.653 rows=100 loops=1)
-> Index Only Scan using pgbench_accounts_pkey on pgbench_accounts pgbench_accounts_2 (cost=10383.42..12325.02 rows=82267 width=352) (actual time=0.907..1.642 rows=100 loops=1)
-> Storage Scan on pgbench_accounts_pkey (cost=10383.42..12325.02 rows=82267 width=352) (actual rows=100 loops=1)
Projections: aid
-> B-Tree Scan on pgbench_accounts_pkey (cost=10383.42..12325.02 rows=82267 width=352) (actual rows=167 loops=1)
Planning Time: 23.531 ms
Execution Time: 1095.048 ms
(24 rows)
```Metrics are shown here.
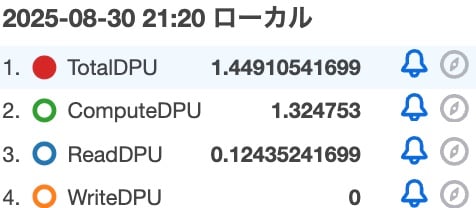
As expected, ComputeDPU increased, but the pattern using CTE consumed about 0.45 more ComputeDPU. Summarizing the verification results so far: *WriteDPU has been omitted as it was 0 in all cases.
| Test Pattern | TotalDPU | ComputeDPU | ReadDPU |
| ---------- | ------------- |------------- |------------- |
| 1. Generate 1 million records with CTE | 0.9565228584 | 0.935918 | 0.0206048584 |
| 2. Generate 1 million records with CTE & calculate hash values | 1.78309889063 | 1.775511 | 0.00758789062 |
| 3-1. Generate 1 million records with CROSS JOIN | 0.55499237793 | 0.43168 | 0.12331237793 |
| 3-2. Generate 1 million records with CROSS JOIN & add 1 | 0.59730797949 | 0.450104 | 0.14720397949 |
| 4. Generate 1 million records with CROSS JOIN, add 1 & calculate hash values | 1.44910541699 | 1.324753 | 0.12435241699 |
## Bonus: Metrics when restoring pgbench test data
As a bonus, I'm also introducing the metrics when importing the pgbench test data used in test patterns 3 and 4. Due to incompatibilities with foreign keys and COPY commands, we couldn't create initial data with the pgbench command, so we generated test data in a local environment and then restored it to DSQL.
We used pg_dump to dump the data in INSERT statement format, and the dump file looks like this:
```sql
--
-- Data for Name: pgbench_accounts; Type: TABLE DATA; Schema: public; Owner: postgres
--
INSERT INTO public.pgbench_accounts VALUES (1, 1, 0, ' ');
INSERT INTO public.pgbench_accounts VALUES (2, 1, 0, ' ');
INSERT INTO public.pgbench_accounts VALUES (3, 1, 0, ' ');
INSERT INTO public.pgbench_accounts VALUES (4, 1, 0, ' ');
...omitted
Here are the metrics when we performed these INSERTs together using psql:
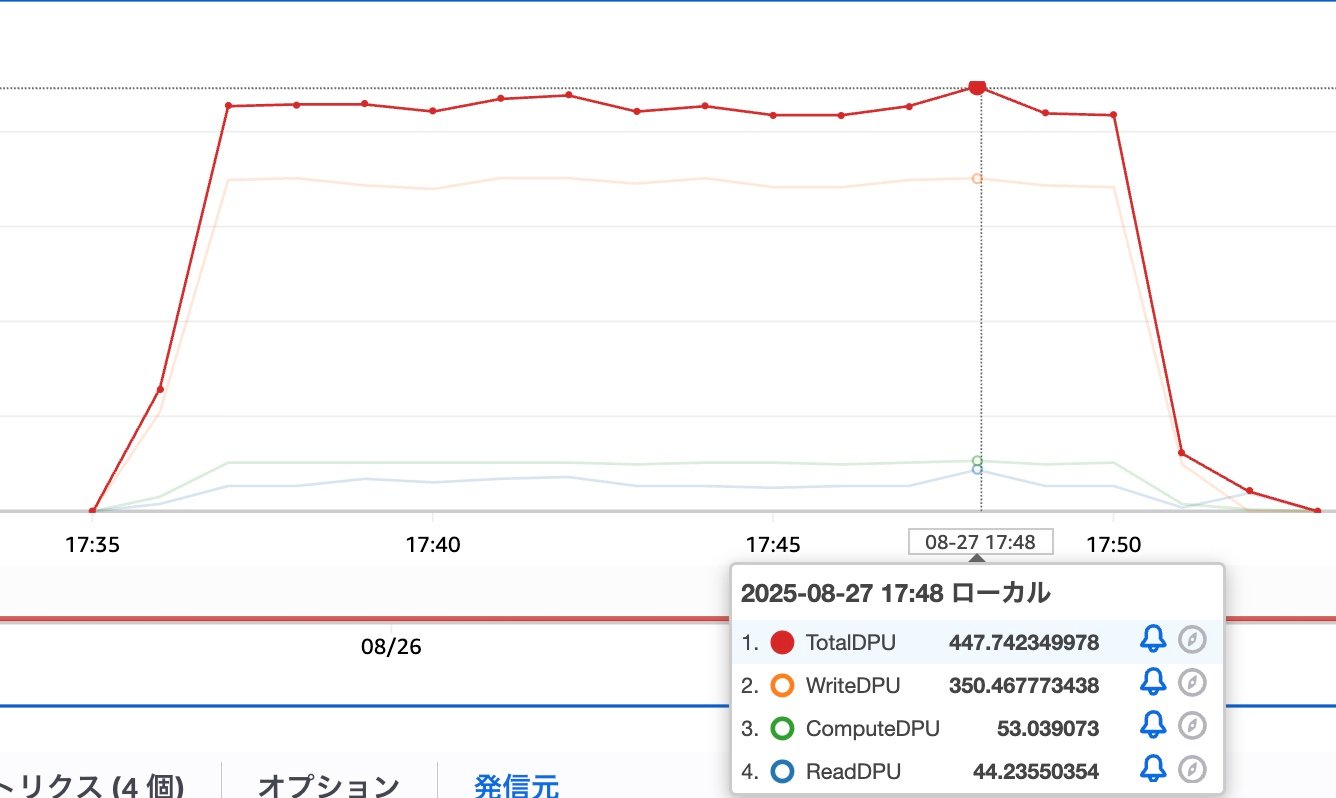
While the high WriteDPU was expected, the ReadDPU consumption is surprisingly high as well.## Summary
I tested DSQL DPU in several patterns. I was a bit worried that the verification might result in large charges, but even with about 1 million records, the DPU consumption wasn't significant at all. That's great!!

