
I tried exporting Kiro's activity reports with OpenTelemetry and aggregating them with PromQL

This page has been translated by machine translation. View original
Introduction
In Kiro Enterprise activity reports, CSV output to S3 was supported in February 2026, and output via OpenTelemetry (OTel) was supported in September 2026.
Metrics ingested into CloudWatch via OTel can be queried with PromQL.
In this article, we enabled both CSV output to S3 and output to CloudWatch via OTel, and verified whether values output to the S3 CSV could also be retrieved with PromQL, targeting data from the same day.
Verification Details
In an environment with OTel export enabled, we retrieved metrics that arrived in CloudWatch in us-east-1 via PromQL.
OTel Export Configuration
We confirmed the configuration required for PromQL retrieval from both the official documentation requirements and the active settings.
Kiro sends metrics once per day at 02:00 UTC. Metrics for a given activity day are sent the following day. Days where sending failed are not retried, and backfilling is not performed.
When the destination is CloudWatch, a bearer API key is required because Kiro cannot sign exports with SigV4. The endpoint is https://monitoring.<region>.amazonaws.com/v1/metrics. The protocol is HTTP/protobuf, and the authentication header is Authorization=Bearer <api-key>.
The KMS key, Secrets Manager secret, and Kiro profile must be in the same region. The default aws/secretsmanager key cannot be used to encrypt the secret because Kiro reads the secret from a different AWS account. Data points contain IAM Identity Center user IDs and, if resolvable, email addresses. These are stored as CloudWatch metric labels, making them visible to anyone who can view PromQL or dashboards.
The resources created were a CMK, an IAM user and service-specific API key for CloudWatch delivery, and a secret containing the endpoint and credentials. In this case, the secret was created in the same account as the Kiro profile. put-key-policy replaces the entire key policy. kms-key-policy.json retained the default Enable IAM User Permissions statement while adding a statement for Kiro.
# 1. Create a CMK (the default aws/secretsmanager cannot be decrypted by Kiro)
aws kms create-key --description "Kiro OTel export secret encryption" --region us-east-1
aws kms create-alias --alias-name alias/kiro-otel-export --target-key-id <key-id> --region us-east-1
aws kms put-key-policy --key-id <key-id> --policy-name default \
  --policy file://kms-key-policy.json --region us-east-1

# 2. Create an IAM user and API key for sending to CloudWatch
aws iam create-user --user-name kiro-otel-metrics-user
aws iam attach-user-policy --user-name kiro-otel-metrics-user \
  --policy-arn arn:aws:iam::aws:policy/CloudWatchAPIKeyAccess
aws iam create-service-specific-credential --user-name kiro-otel-metrics-user \
  --service-name cloudwatch.amazonaws.com

# 3. Put the endpoint and credentials into a secret (same region as the Kiro profile)
# If you don't want to leave the API key in shell history, you can also pass it with --secret-string file://secret.json
aws secretsmanager create-secret --name kiro-otel-export --kms-key-id <key-id> \
  --secret-string '{"OTEL_EXPORTER_OTLP_ENDPOINT":"https://monitoring.us-east-1.amazonaws.com/v1/metrics","OTEL_EXPORTER_OTLP_HEADERS":"Authorization=Bearer <SERVICE_CREDENTIAL_SECRET>"}' \
  --region us-east-1
aws secretsmanager put-resource-policy --secret-id kiro-otel-export \
  --resource-policy file://secret-resource-policy.json --region us-east-1
Enabling the export itself is done in the Kiro console.
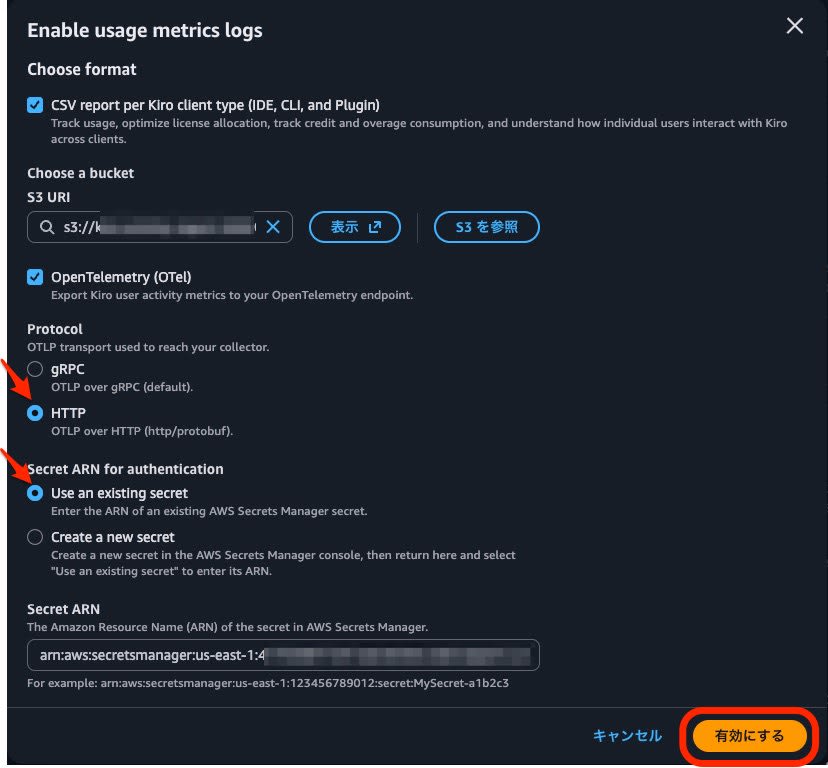
In the "Enable usage metrics logs" dialog, we checked both CSV reports and OpenTelemetry. For Protocol, we selected HTTP (OTLP over HTTP (http/protobuf)), and for authentication, we selected "Use an existing secret" and specified the ARN of an existing secret.
We verified the current configuration of the resources created with the above commands. Both the KMS key policy and the Secrets Manager resource policy grant permissions to q.amazonaws.com. The secret's resource policy uses minimal permissions for operation verification and does not include condition keys to restrict the caller.
Active configuration (KMS key policy, secret, IAM, list-metrics)
{
  "kms_get_key_policy.Policy Kiro statement": {
    "Sid": "AllowKiroDecryptViaSecretsManager",
    "Effect": "Allow",
    "Principal": {
      "Service": "q.amazonaws.com"
    },
    "Action": [
      "kms:Decrypt",
      "kms:DescribeKey"
    ],
    "Resource": "*",
    "Condition": {
      "StringEquals": {
        "kms:ViaService": "secretsmanager.us-east-1.amazonaws.com"
      }
    }
  },
  "secret_describe": {
    "Name": "kiro-otel-export",
    "KmsKeyId": "xxxxxxxx-xxxx-xxxx-xxxx-xxxxxxxxxxff",
    "LastAccessedDate": "2026-09-14T09:00:00+09:00"
  },
  "secret_resource_policy.ResourcePolicy statement": {
    "Sid": "AllowKiroGetSecretValue",
    "Effect": "Allow",
    "Principal": {
      "Service": "q.amazonaws.com"
    },
    "Action": "secretsmanager:GetSecretValue",
    "Resource": "*"
  },
  "iam_attached_user_policies": [
    {
      "PolicyName": "CloudWatchAPIKeyAccess",
      "PolicyArn": "arn:aws:iam::aws:policy/CloudWatchAPIKeyAccess"
    }
  ],
  "cloudwatch list-metrics --namespace kiro": []
}
Metrics ingested via OTLP are not visible from the traditional metrics API. The list-metrics response with namespace set to kiro returned empty. The official documentation states the same. GetMetricData, ListMetrics, and similar operations only target CloudWatch Metrics (Classic). For OpenTelemetry Metrics, it states to use the PromQL query API.
How to Execute PromQL
The PromQL HTTP API is called with SigV4 signing. The SigV4 service name is monitoring. The endpoint is https://monitoring.<region>.amazonaws.com/api/v1/<operation>.
The required IAM permissions differ by API operation. /api/v1/query and /api/v1/query_range require both cloudwatch:GetMetricData and cloudwatch:ListMetrics. Series and label-related API operations only require ListMetrics.
For limits, the maximum range per request is 7 days, the maximum number of series returned per query is 500, and the execution timeout is 20 seconds. The supported regions table has three columns: OTLP metrics ingestion, PromQL queries, and Query Studio. The listed regions, including us-east-1 and ap-northeast-1, are all documented as supporting all three columns.
Since signing is required, we prepared a minimal client that only performs signing using botocore.
REGION = "us-east-1"
HOST = f"https://monitoring.{REGION}.amazonaws.com"
SERVICE = "monitoring"

def call(path, params):
    creds = botocore.session.get_session().get_credentials().get_frozen_credentials()
    if METHOD == "GET":
        qs = urllib.parse.urlencode(params, doseq=True, quote_via=urllib.parse.quote)
        url = f"{HOST}{path}" + (f"?{qs}" if qs else "")
        req = AWSRequest(method="GET", url=url)
        SigV4Auth(creds, SERVICE, REGION).add_auth(req)
        return _send(urllib.request.Request(url, headers=dict(req.headers), method="GET"))
We saved this as promql.py and ran it as follows.
# List of metric names (pass epoch seconds to start / end; omitting them returns an empty array)
python3 promql.py names 1788825600 1789344000

# List of label names
python3 promql.py labels 1788825600 1789344000

# Instant query (data point for report date 2026-09-13 is set at 2026-09-14T00:00Z)
python3 promql.py query 'sum by ("kiro.client.type") ({"kiro.daily.credits", date="2026-09-13"})' 1789344000
Full contents of promql.py
#!/usr/bin/env python3
"""Minimal client for calling CloudWatch PromQL (Prometheus-compatible API) with SigV4.

usage:
  promql.py labels <start-epoch> <end-epoch>
  promql.py names <start-epoch> <end-epoch>
  promql.py date-values <start-epoch> <end-epoch>
  promql.py series '<selector>'
  promql.py query '<promql>' [epoch-seconds]
  promql.py query_range '<promql>' <start-epoch> <end-epoch> <step>
"""
import json
import sys

import botocore.session
from botocore.auth import SigV4Auth
from botocore.awsrequest import AWSRequest
import urllib.request
import urllib.parse

REGION = "us-east-1"
HOST = f"https://monitoring.{REGION}.amazonaws.com"
SERVICE = "monitoring"

METHOD = "GET"

def call(path, params):
    creds = botocore.session.get_session().get_credentials().get_frozen_credentials()
    if METHOD == "GET":
        qs = urllib.parse.urlencode(params, doseq=True, quote_via=urllib.parse.quote)
        url = f"{HOST}{path}" + (f"?{qs}" if qs else "")
        req = AWSRequest(method="GET", url=url)
        SigV4Auth(creds, SERVICE, REGION).add_auth(req)
        return _send(urllib.request.Request(url, headers=dict(req.headers), method="GET"))
    body = urllib.parse.urlencode(params, doseq=True)
    url = f"{HOST}{path}"
    req = AWSRequest(
        method="POST",
        url=url,
        data=body,
        headers={"Content-Type": "application/x-www-form-urlencoded"},
    )
    SigV4Auth(creds, SERVICE, REGION).add_auth(req)
    prepared = urllib.request.Request(
        url, data=body.encode(), headers=dict(req.headers), method="POST"
    )
    return _send(prepared)

def _send(prepared):
    try:
        with urllib.request.urlopen(prepared) as resp:
            return resp.status, resp.read().decode()
    except urllib.error.HTTPError as e:
        return e.code, e.read().decode()

def main():
    cmd = sys.argv[1]
    # /api/v1/labels and /api/v1/label/<name>/values return empty arrays if
    # start / end are not provided. Accept epoch seconds as the 2nd and 3rd arguments.
    window = {}
    if cmd in ("labels", "names", "date-values") and len(sys.argv) > 3:
        window = {"start": sys.argv[2], "end": sys.argv[3]}
    if cmd == "labels":
        status, out = call("/api/v1/labels", window)
    elif cmd == "names":
        status, out = call("/api/v1/label/__name__/values", window)
    elif cmd == "date-values":
        status, out = call("/api/v1/label/date/values", window)
    elif cmd == "series":
        status, out = call("/api/v1/series", {"match[]": sys.argv[2]})
    elif cmd == "query":
        p = {"query": sys.argv[2]}
        if len(sys.argv) > 3:
            p["time"] = sys.argv[3]
        status, out = call("/api/v1/query", p)
    elif cmd == "query_range":
        p = {
            "query": sys.argv[2],
            "start": sys.argv[3],
            "end": sys.argv[4],
            "step": sys.argv[5],
        }
        status, out = call("/api/v1/query_range", p)
    else:
        print(__doc__)
        sys.exit(2)
    print(f"HTTP {status}")
    try:
        print(json.dumps(json.loads(out), indent=2, ensure_ascii=False))
    except json.JSONDecodeError:
        print(out)

if __name__ == "__main__":
    main()
The metric names retrieved were as follows. When run without passing a time range, an empty array was returned.
{
  "status": "success",
  "data": [
    "kiro.daily.conversations",
    "kiro.daily.credits",
    "kiro.daily.messages",
    "kiro.daily.model_messages",
    "kiro.daily.overage_credits",
    "otel.sdk.metric_reader.collection.duration"
  ]
}
Five Kiro daily metrics and one OTel SDK internal metric had arrived.
The list of label names included entries corresponding to date, user, client type, model name, subscription, and usage limit.
List of retrieved label names
{
  "status": "success",
  "data": [
    "@aws.account",
    "@aws.region",
    "@instrumentation.@name",
    "@instrumentation.@schema_url",
    "@instrumentation.@version",
    "@resource.@schema_url",
    "@resource.kiro.account.id",
    "@resource.kiro.profile.arn",
    "@resource.kiro.profile.id",
    "@resource.service.name",
    "@resource.telemetry.sdk.language",
    "@resource.telemetry.sdk.name",
    "@resource.telemetry.sdk.version",
    "__monotonicity__",
    "__name__",
    "__temporality__",
    "__type__",
    "__unit__",
    "date",
    "kiro.client.type",
    "kiro.model.name",
    "kiro.overage.cap",
    "kiro.overage.enabled",
    "kiro.subscription.tier",
    "kiro.usage.limit",
    "kiro.user.email",
    "kiro.user.id",
    "kiro.user.new",
    "otel.component.name",
    "otel.component.type"
  ]
}
A metric name must be explicitly specified in the selector. When specifying only a regular expression for the metric name, a 400 was returned.
Response when specifying the metric name only with a regular expression
{
  "query": "{__name__=~\"kiro.daily..*\"}",
  "http": 400,
  "response": {
    "error": "Selector must have a metric name. Found matchers: [__name__]",
    "errorType": "bad_data",
    "status": "error"
  }
}
Cross-referencing with CSV
The same content also appears in S3 CSV reports. The CSV has one row per date, user, and client type.
Date,UserId,Client_Type,Chat_Conversations,Credits_Used,Overage_Cap,Overage_Credits_Used,Overage_Enabled,ProfileId,Subscription_Tier,Total_Messages,New_User,User_Email,Usage_Limit,auto_messages,claude_opus_5_messages,claude_sonnet_4.6_messages,gpt_5.6_luna_messages,gpt_5.6_sol_messages,gpt_5.6_terra_messages
2026-09-13,xxxxxxxx-xxxx-xxxx-xxxx-xxxxxxxxxx0a,KIRO_CLI,323,752.1328506192372,5000.0,0.0,true,arn:aws:codewhisperer:us-east-1:123456789012:profile/xxxxxxxxxxxxx,POWER,1401,false,xxxxxxxx-a@example.com,10000,1401,0,0,0,0,0
The correspondence between columns and metrics/labels is as follows.
| CSV Column | PromQL |
|---|---|
| Credits_Used | kiro.daily.credits |
| Overage_Credits_Used | kiro.daily.overage_credits |
| Total_Messages | kiro.daily.messages |
| Chat_Conversations | kiro.daily.conversations |
<model>_messages |
kiro.model.name label of kiro.daily.model_messages |
| Date | date label |
| UserId | kiro.user.id label |
| Client_Type | kiro.client.type label |
| Subscription_Tier | kiro.subscription.tier label |
| Usage_Limit | kiro.usage.limit label |
| Overage_Cap / Overage_Enabled | kiro.overage.cap / kiro.overage.enabled labels |
| New_User | kiro.user.new label |
| User_Email | kiro.user.email label |
Since the CSV is split into separate files by client type, we aggregated the 3 files from the same day together.
for path in sys.argv[1:]:
    for row in csv.DictReader(open(path)):
        key = (row["Date"][:10], row["Client_Type"])
        credits[key] += float(row["Credits_Used"] or 0)
        messages[row["Date"][:10]] += int(row["Total_Messages"] or 0)
# Aggregate the 3 files for CLI / IDE / WEB from the same day together
python3 csv_aggregate.py s3-2026-09-12-*.csv s3-2026-09-13-*.csv
Credits by client type and daily message counts were output.
2026-09-12	KIRO_CLI	929.981886
2026-09-12	KIRO_IDE	30.041061
2026-09-12	KIRO_WEB	34.783152
2026-09-13	KIRO_CLI	1795.626213
2026-09-13	KIRO_IDE	70.219843
2026-09-13	KIRO_WEB	29.099002
2026-09-12	Total_Messages	2200
2026-09-13	Total_Messages	3551
On the PromQL side, we summed credits by client type and queried for the same day.
{
  "query": "sum by (\"kiro.client.type\") ({\"kiro.daily.credits\", date=\"2026-09-13\"})",
  "response": {
    "status": "success",
    "data": {
      "resultType": "vector",
      "result": [
        {
          "metric": {
            "kiro.client.type": "KIRO_IDE"
          },
          "value": [
            1789344000.0,
            "70.21984331824211"
          ]
        },
        {
          "metric": {
            "kiro.client.type": "KIRO_CLI"
          },
          "value": [
            1789344000.0,
            "1795.6262133304313"
          ]
        },
        {
          "metric": {
            "kiro.client.type": "KIRO_WEB"
          },
          "value": [
            1789344000.0,
            "29.099002319237147"
          ]
        }
      ]
    }
  }
}
Here are the credits for report date 2026-09-13 side by side. The S3 CSV column shows values aggregated from 3 files for KIRO_CLI / KIRO_IDE / KIRO_WEB.
| Client Type | S3 CSV | PromQL |
|---|---|---|
| KIRO_CLI | 1795.626213 | 1795.6262133304313 |
| KIRO_IDE | 70.219843 | 70.21984331824211 |
| KIRO_WEB | 29.099002 | 29.099002319237147 |
The S3 CSV column in the table above shows values rounded to 6 decimal places in the aggregation script's output format. The Credits_Used field in the CSV itself contains the full float digits, same as PromQL. Message counts also matched, with 2200 for 2026-09-12 and 3551 for 2026-09-13. The PromQL values were obtained via the SQL aggregation described later.
Retrieving Usage Breakdowns
The breakdown by client type was retrieved directly with the query from the previous section. Message counts by model are summed using the model name label.
{
  "query": "sum by (\"kiro.model.name\") ({\"kiro.daily.model_messages\", date=\"2026-09-13\"})",
  "response": {
    "status": "success",
    "data": {
      "resultType": "vector",
      "result": [
        {
          "metric": {
            "kiro.model.name": "gpt-5.6-sol"
          },
          "value": [
            1789344000.0,
            "37"
          ]
        },
        {
          "metric": {
            "kiro.model.name": "gpt-5.6-luna"
          },
          "value": [
            1789344000.0,
            "8"
          ]
        },
        {
          "metric": {
            "kiro.model.name": "claude-opus-5"
          },
          "value": [
            1789344000.0,
            "714"
          ]
        },
        {
          "metric": {
            "kiro.model.name": "auto"
          },
          "value": [
            1789344000.0,
            "2443"
          ]
        },
        {
          "metric": {
            "kiro.model.name": "gpt-5.6-terra"
          },
          "value": [
            1789344000.0,
            "345"
          ]
        },
        {
          "metric": {
            "kiro.model.name": "claude-sonnet-4.6"
          },
          "value": [
            1789344000.0,
            "4"
          ]
        }
      ]
    }
  }
}
Values that were split across per-model columns in the CSV were returned as series of a single metric in PromQL.
Credit aggregation can also be placed in dashboard widgets. Write PromQL in properties.data.queries of the widget and specify PromQL for language.
{
  "type": "chart",
  "x": 0,
  "y": 0,
  "width": 12,
  "height": 6,
  "properties": {
    "view": "line",
    "title": "Daily Credits (by Client Type)",
    "region": "us-east-1",
    "data": {
      "queries": [
        {
          "id": "credits_by_client",
          "type": "cloudwatch-metrics",
          "language": "PromQL",
          "query": "sum by (\"kiro.client.type\") ({\"kiro.daily.credits\"})",
          "label": "__verbose__",
          "step": 86400
        }
      ]
    },
    "plotOptions": {
      "legend": {
        "position": "bottom",
        "show": true
      },
      "style": {
        "lineWidth": 2
      }
    }
  }
}
We saved a definition with 5 widgets arranged as dashboard-kiro-otel.json and created the dashboard.
aws cloudwatch put-dashboard \
  --dashboard-name kiro-otel-promql \
  --dashboard-body file://dashboard-kiro-otel.json \
  --region us-east-1
The response returned validation messages for all 5 widgets stating that the coordinate specifications in the widget definitions would be ignored.
{
    "DashboardValidationMessages": [
        {
            "DataPath": "/widgets/0",
            "Message": "The \"x\" property is not expected to be part of a widget definition, will be ignored"
        }
    ]
}
On the created dashboard, we placed a line chart showing daily credits by client type and a number widget displaying the latest value. We also included a pie chart of messages by model, a bar chart of the top 10 heavy users, and line charts of credits and overage credits by subscription tier. The number widget displays the value of the latest data point, not the total for the period.
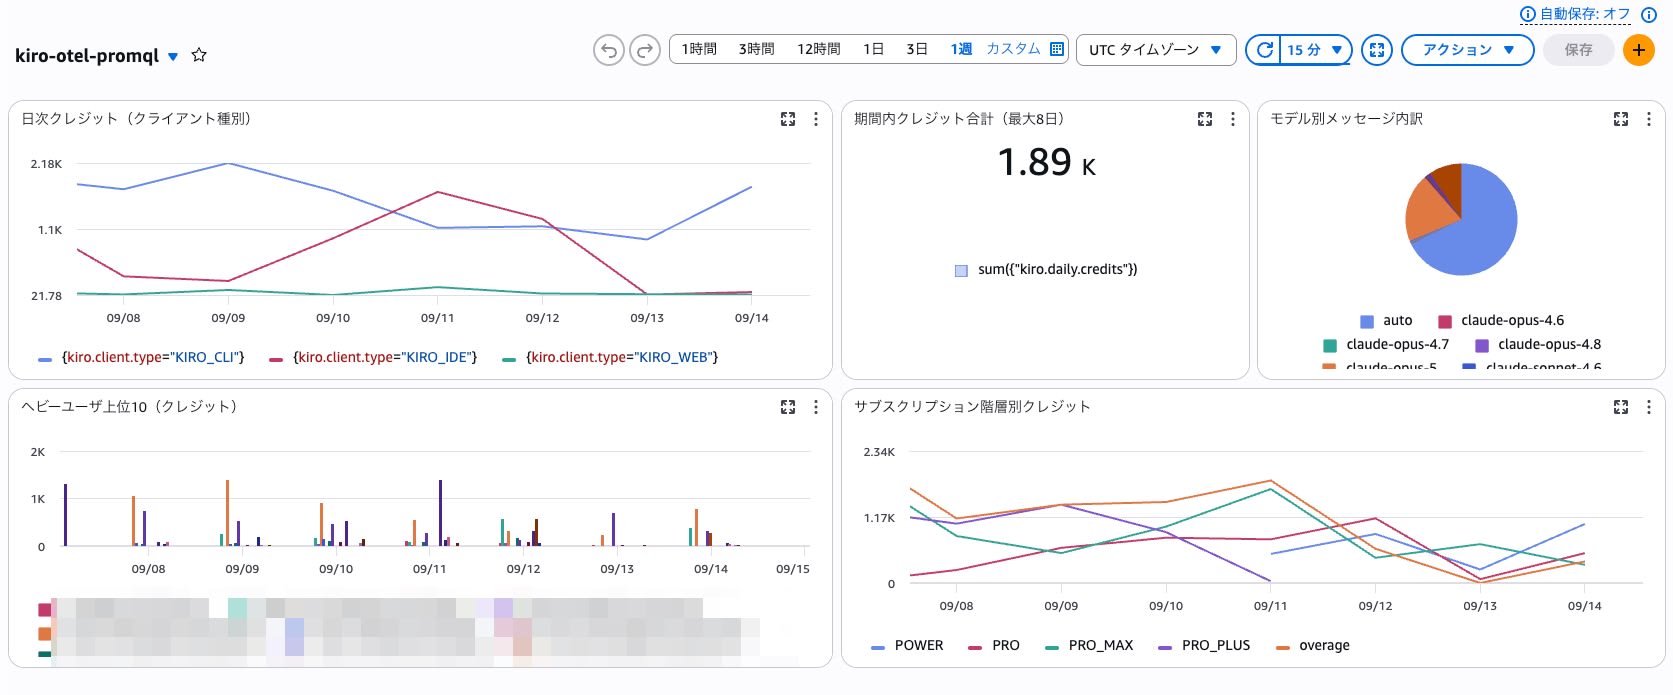
This dashboard is set to display 1 week to stay within the maximum time range per request (8 days as measured in practice, described later).
Monthly Aggregation and Database Integration
We'll verify the constraints when retrieving monthly credit totals with PromQL.
{
  "query": "sum({\"kiro.daily.credits\"})",
  "http": 400,
  "response": {
    "error": "Query time range 1209600000ms exceeds 691200000ms limit",
    "errorType": "bad_data",
    "status": "error"
  }
}
The upper limit is 691200000 milliseconds, which is 8 days. The documentation states 7 days, so the measured value is 1 day longer.
{
  "query": "sum(sum_over_time({\"kiro.daily.credits\"}[7d]))",
  "http": 400,
  "response": {
    "error": "Range selector 604800000ms exceeds 86400000ms limit",
    "errorType": "bad_data",
    "status": "error"
  }
}
The range selector is limited to 86400000 milliseconds, which is 1 day. Since the monthly total cannot be retrieved in a single request, we wrote a script that splits the time range into windows of 8 days or less and merges them by date label. Because data point timestamps are set at 00:00 UTC on the day after the report date, the query window is shifted back by 1 day.
MAX_WINDOW_DAYS = 8  # Measured upper limit (documentation states 7 days)

def chunks(first, last):
    """Split report dates first..last into windows of 8 days or less.

    Since data point timestamps are set at report date +1 day 00:00 UTC,
    the query window is shifted back by 1 day.
    """
    out = []
    cur = first
    while cur <= last:
        end = min(cur + datetime.timedelta(days=MAX_WINDOW_DAYS - 1), last)
        out.append(
            (
                cur,
                end,
                int(
                    datetime.datetime.combine(
                        cur + datetime.timedelta(days=1),
                        datetime.time(),
                        datetime.UTC,
                    ).timestamp()
                ),
                int(
                    datetime.datetime.combine(
                        end + datetime.timedelta(days=1),
                        datetime.time(),
                        datetime.UTC,
                    ).timestamp()
                ),
            )
        )
        cur = end + datetime.timedelta(days=1)
    return out
We saved this as monthly_credits.py and retrieved data for the previous month and the current month, one user at a time. One month's worth of data is split into 4 requests in both cases.
# Previous month (2026-08)
python3 monthly_credits.py 2026-08 <kiro.user.id> --raw-out monthly-2026-08.json

# Current month (2026-09)
python3 monthly_credits.py 2026-09 <kiro.user.id> --raw-out monthly-2026-09.json
For the previous month, all 4 chunks returned empty results.
{
  "chunk": 1,
  "report_date_from": "2026-08-01",
  "report_date_to": "2026-08-08",
  "start_epoch": 1785628800,
  "end_epoch": 1786233600,
  "http_status": 200,
  "response": {
    "status": "success",
    "data": {
      "resultType": "matrix",
      "result": []
    }
  }
}
Data prior to the month of activation could not be retrieved via PromQL. For the current month, series were returned, and the first chunk contained KIRO_IDE data for 2026-09-03.
Current month chunk 1 response (first series)
{
  "chunk": 1,
  "report_date_from": "2026-09-01",
  "report_date_to": "2026-09-08",
  "start_epoch": 1788307200,
  "end_epoch": 1788912000,
  "http_status": 200,
  "response": {
    "status": "success",
    "data": {
      "resultType": "matrix",
      "result": [
        {
          "metric": {
            "date": "2026-09-03",
            "kiro.client.type": "KIRO_IDE"
          },
          "values": [
            [
              1788480000.0,
              "81.07452051907131"
            ]
          ]
        }
      ]
    }
  }
}
We merged the results from 4 requests and sorted them in date order. The following is an excerpt of 5 days from 2026-09-03 to 2026-09-07. Chunks targeting dates after 09-17 returned no data as they covered future dates.
| date | KIRO_CLI | KIRO_IDE | KIRO_WEB | total |
|---|---|---|---|---|
| 2026-09-03 | 0.000000 | 81.074521 | 34.719170 | 115.793691 |
| 2026-09-04 | 0.000000 | 567.937403 | 22.614996 | 590.552399 |
| 2026-09-05 | 268.559799 | 236.676726 | 19.740736 | 524.977261 |
| 2026-09-06 | 1231.302509 | 0.000000 | 67.092049 | 1298.394558 |
| 2026-09-07 | 997.004132 | 22.291942 | 30.999795 | 1050.295869 |
Since aggregating monthly values requires manually splitting requests and merging results, we also tried an approach that offloads aggregation to the database side.
METRICS = [
    "kiro.daily.credits",
    "kiro.daily.overage_credits",
    "kiro.daily.messages",
    "kiro.daily.conversations",
    "kiro.daily.model_messages",
]

# When connecting multiple metrics with `or`, series with the same label set are collapsed into the left side and lost.
# To flatten while preserving metric names, we issue one request per metric here
# (using `label_replace` to copy the name to a regular label would allow combining into a single request)
We dumped 2 days of data and loaded it into SQLite.
# Dump raw series for all metrics over 2 days and convert to a flat CSV
python3 dump_raw.py 2026-09-12 2026-09-13 --outdir raw

# Load into SQLite and aggregate with SQL
python3 load_sqlite.py raw/promql-flat-2026-09-12_2026-09-13.csv kiro_otel.db
The output CSV has labels directly as columns.
metric,date,kiro.user.id,kiro.user.email,kiro.client.type,kiro.model.name,kiro.subscription.tier,kiro.usage.limit,kiro.overage.enabled,kiro.overage.cap,kiro.user.new,__unit__,__type__,__temporality__,timestamp,value
kiro.daily.credits,2026-09-12,xxxxxxxx-xxxx-xxxx-xxxx-xxxxxxxxxxa0,xxxxxxxx-b@example.com,KIRO_CLI,,PRO,1000,true,5000,false,credits,Sum,delta,2026-09-13T00:00:00+00:00,17.16783699751244
Below is the destination table and the SQL to retrieve daily credits and messages across metrics.
CREATE TABLE kiro_otel (
    metric TEXT, report_date TEXT, user_id TEXT, email TEXT,
    client_type TEXT, model_name TEXT, tier TEXT, usage_limit INTEGER,
    overage_enabled TEXT, overage_cap INTEGER, is_new TEXT,
    unit TEXT, type TEXT, temporality TEXT, ts TEXT, value REAL
);

SELECT report_date,
       ROUND(SUM(CASE WHEN metric='kiro.daily.credits' THEN value END), 3) AS credits,
       CAST(SUM(CASE WHEN metric='kiro.daily.messages' THEN value END) AS INT) AS messages,
       CAST(SUM(CASE WHEN metric='kiro.daily.conversations' THEN value END) AS INT) AS conversations,
       ROUND(SUM(CASE WHEN metric='kiro.daily.overage_credits' THEN value END), 3) AS overage
FROM kiro_otel GROUP BY report_date ORDER BY report_date;
Period totals and cross-metric joins each returned results in a single statement.
--- Period total (aggregation that requires 8-day window splitting in PromQL)
from_date | to_date | total_credits
2026-09-12 | 2026-09-13 | 2889.751158

--- Credits and messages joined in a single query (combinations that get collapsed with PromQL's or)
report_date | credits | messages | conversations | overage
2026-09-12 | 994.806000 | 2200 | 277 | 0.000000
2026-09-13 | 1894.945000 | 3551 | 502 | 381.488000
Both cross-period totals and cross-metric joins can be aggregated in a single SQL statement. Achieving the same with PromQL requires splitting into 8-day windows and converting metric names to regular labels.
Pricing
The two new fixed costs added by enabling OTel export are CMK and the secret. CloudWatch ingestion and query costs, free tier, and minor API call charges are excluded from the calculations in this article.
KMS customer managed keys cost $1/month per key. Secrets Manager costs $0.40/month per secret.
Summary
We confirmed that Kiro's activity reports can be sent to CloudWatch via OTel export, and that the same content available in S3 CSV reports can be retrieved using PromQL.
Within the scope verified in this article, we found that completing monthly and cross-period aggregations entirely within CloudWatch is difficult. On the other hand, if you already have an existing visualization environment compatible with OTel, such as Grafana or Datadog, it becomes an option to integrate Kiro usage data into your dashboards.
If you want to aggregate Kiro activity reports monthly and across periods on AWS, please first try the approach of using S3 CSV files as a data source and analyzing with Athena or similar tools.