Trying to collect slow queries using Extended Events in RDS for SQL Server

Introduction
I believe many people want to collect slow queries to monitor DB performance.
When it comes to RDS monitoring services, CloudWatch Database Insights is the go-to solution.
You can gain various insights from an integrated dashboard, and it's also possible to monitor slow queries.
However, as of August 2025, slow queries cannot be viewed in RDS for SQL Server.
Slow queries is currently available only for MySQL, PostgreSQL and MariaDB instances.
So this time, I tried collecting slow queries using SQL Server's standard extended events.
What are Extended Events?
Extended Events (XEvents) is a "lightweight and scalable monitoring and troubleshooting infrastructure" built into SQL Server that allows you to flexibly collect necessary event data.
As a note, there are the following constraints in RDS:
- Target constraints
- File target save location is fixed to
D:\rdsdbdata\log. Output to arbitrary drives or folders is not possible. - ETW (Event Tracing for Windows) target is unavailable. You cannot send to the Windows ETW infrastructure as you would on-premises.
- File target save location is fixed to
- AWS-controlled resource parameter limits
- AWS-specific upper limits exist for
xe_session_max_memory,xe_session_max_event_size,xe_session_max_dispatch_latency,xe_file_target_size,xe_file_retention, etc., and can only be changed viardsadmin.dbo.rds_set_configuration.
- AWS-specific upper limits exist for
- Multi-AZ behavior
- XE sessions are not automatically inherited by the standby instance.
- After failover, sessions need to be restarted on the new primary.
- For continuous use, users need to set up restart processes using SQL Server Agent jobs, etc.
- Management restrictions
- Existing "default sessions" cannot be modified (ALTER is possible on-premises, but prohibited in RDS).
- Only
NONEis supported for memory partition settings.
Please refer to the following official documentation for more details.
Despite these constraints, it seems we can use this effectively for collecting slow queries.
Actual Implementation
This time, let's set it up to collect queries that take more than 10 seconds.### Creating Extended Event Session
First, create an event session and start the session.
			-- Create session
CREATE EVENT SESSION XE_SlowQuery ON SERVER
ADD EVENT sqlserver.sql_statement_completed(
    ACTION (sqlserver.sql_text, sqlserver.database_name, sqlserver.session_id)
    WHERE (duration > 10000000)
)
ADD TARGET package0.event_file(
    SET filename = N'D:\rdsdbdata\log\XE_SlowQuery',
        max_file_size = (100),
        max_rollover_files = (5)
)
WITH (MAX_MEMORY=4 MB, EVENT_RETENTION_MODE=ALLOW_SINGLE_EVENT_LOSS,
      MAX_DISPATCH_LATENCY=30 SECONDS, TRACK_CAUSALITY=OFF, STARTUP_STATE=OFF);
GO

-- Start session
ALTER EVENT SESSION XE_SlowQuery ON SERVER STATE = START;
GO
Since duration is in microseconds, specify 10000000 to collect queries that take more than 10 seconds.
The storage location is the RDS specified log directory D:\rdsdbdata\log with the file name XE_SlowQuery.
max_file_size specifies the file size limit. The default is 100MB. To change this, use rds_set_configuration to extend the limit (can be extended up to 1GB).
If you want to include stored procedures and batch processes in the collection targets, you can add sqlserver.rpc_completed and sqlserver.sql_batch_completed in addition to sqlserver.sql_statement_completed.
Generate a Slow Query
For testing purposes, we'll generate a slow query by inserting a 15-second WAIT.
			WAITFOR DELAY '00:00:15';
```### Checking the Results

Let's read the contents of the `.xel` file using `sys.fn_xe_file_target_read_file`.

```sql
WITH xe AS (
  SELECT CAST(event_data AS XML) AS x
  FROM sys.fn_xe_file_target_read_file('D:\rdsdbdata\log\XE_SlowQuery*.xel', NULL, NULL, NULL)
)
SELECT
  x.value('(event/@name)[1]', 'sysname') AS event_name,
  x.value('(event/@timestamp)[1]', 'datetime2') AS [timestamp_utc],
  x.value('(event/data[@name="duration"]/value)[1]', 'bigint')/1000000.0 AS duration_sec,
  x.value('(event/data[@name="cpu_time"]/value)[1]', 'bigint')/1000000.0 AS cpu_sec,
  x.value('(event/data[@name="logical_reads"]/value)[1]', 'bigint') AS logical_reads,
  x.value('(event/data[@name="writes"]/value)[1]', 'bigint') AS writes,
  x.value('(event/data[@name="row_count"]/value)[1]', 'bigint') AS row_count,
  x.value('(event/action[@name="database_name"]/value)[1]', 'sysname') AS database_name,
  x.value('(event/action[@name="session_id"]/value)[1]', 'int') AS session_id,
  x.value('(event/action[@name="sql_text"]/value)[1]', 'nvarchar(max)') AS sql_text
FROM xe
ORDER BY [timestamp_utc] DESC;
We got results like the following:
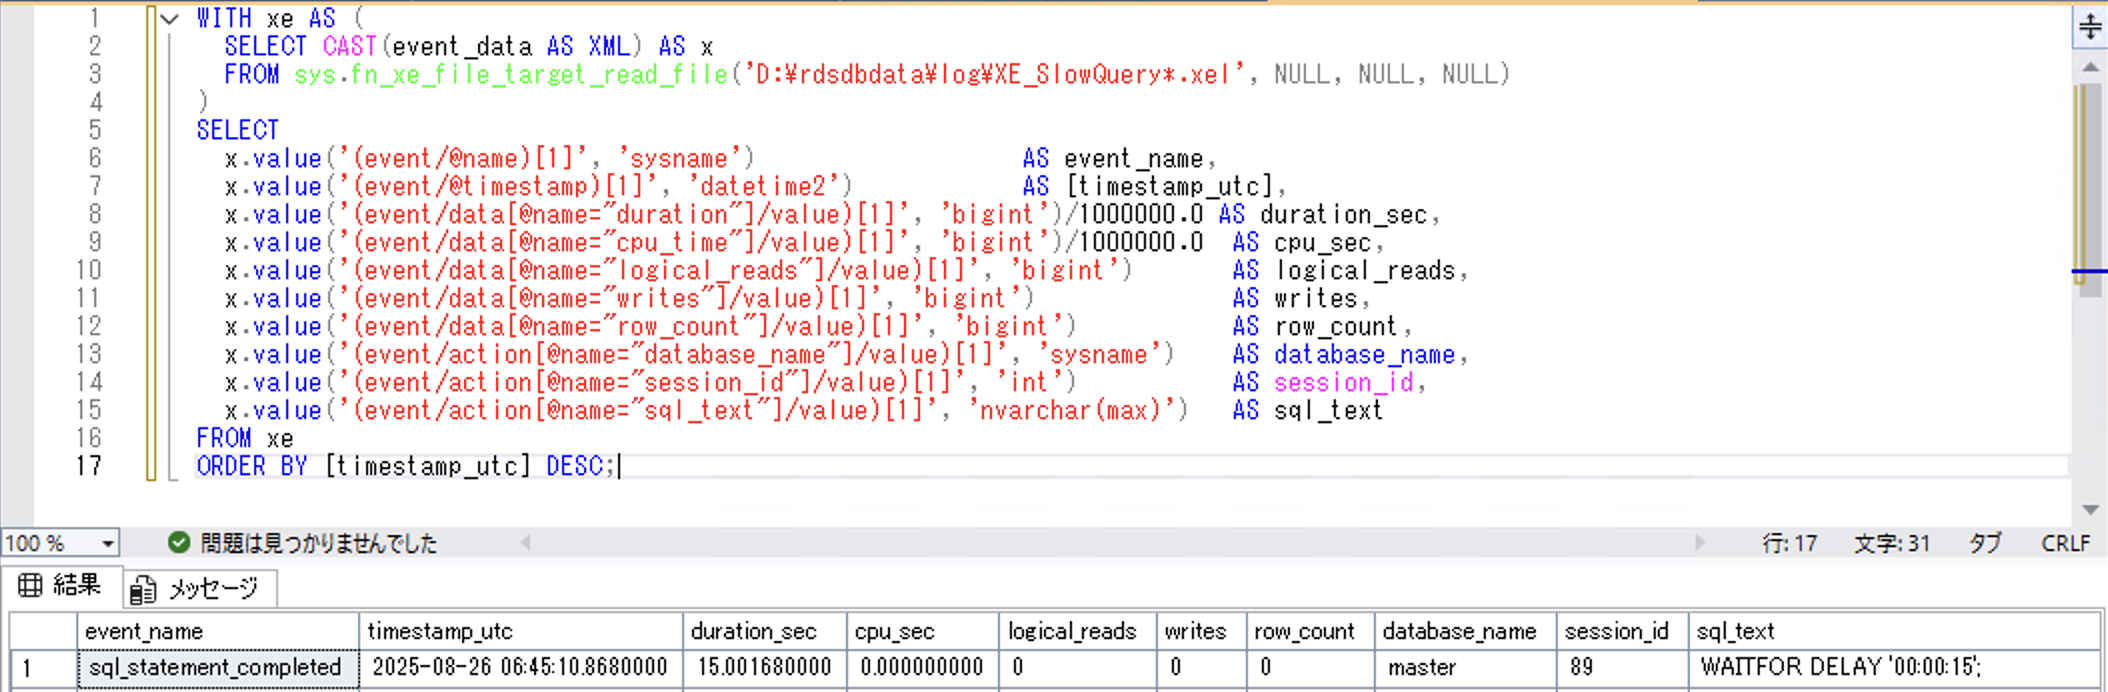
This looks good.
Summary
Although there are some constraints, we can use extended events to collect slow queries in RDS.
In terms of choosing between Database Insights and extended events, the following classification would be appropriate:
- For a quick overview of heavy SQL queries -> Database Insights
- For logging queries that exceed thresholds -> Extended Events
It seems a good approach would be to monitor regularly with Database Insights, while using extended events for purposes that require keeping historical records, such as reports.
First, try it in your development environment and then check if it can be used in your production environment.