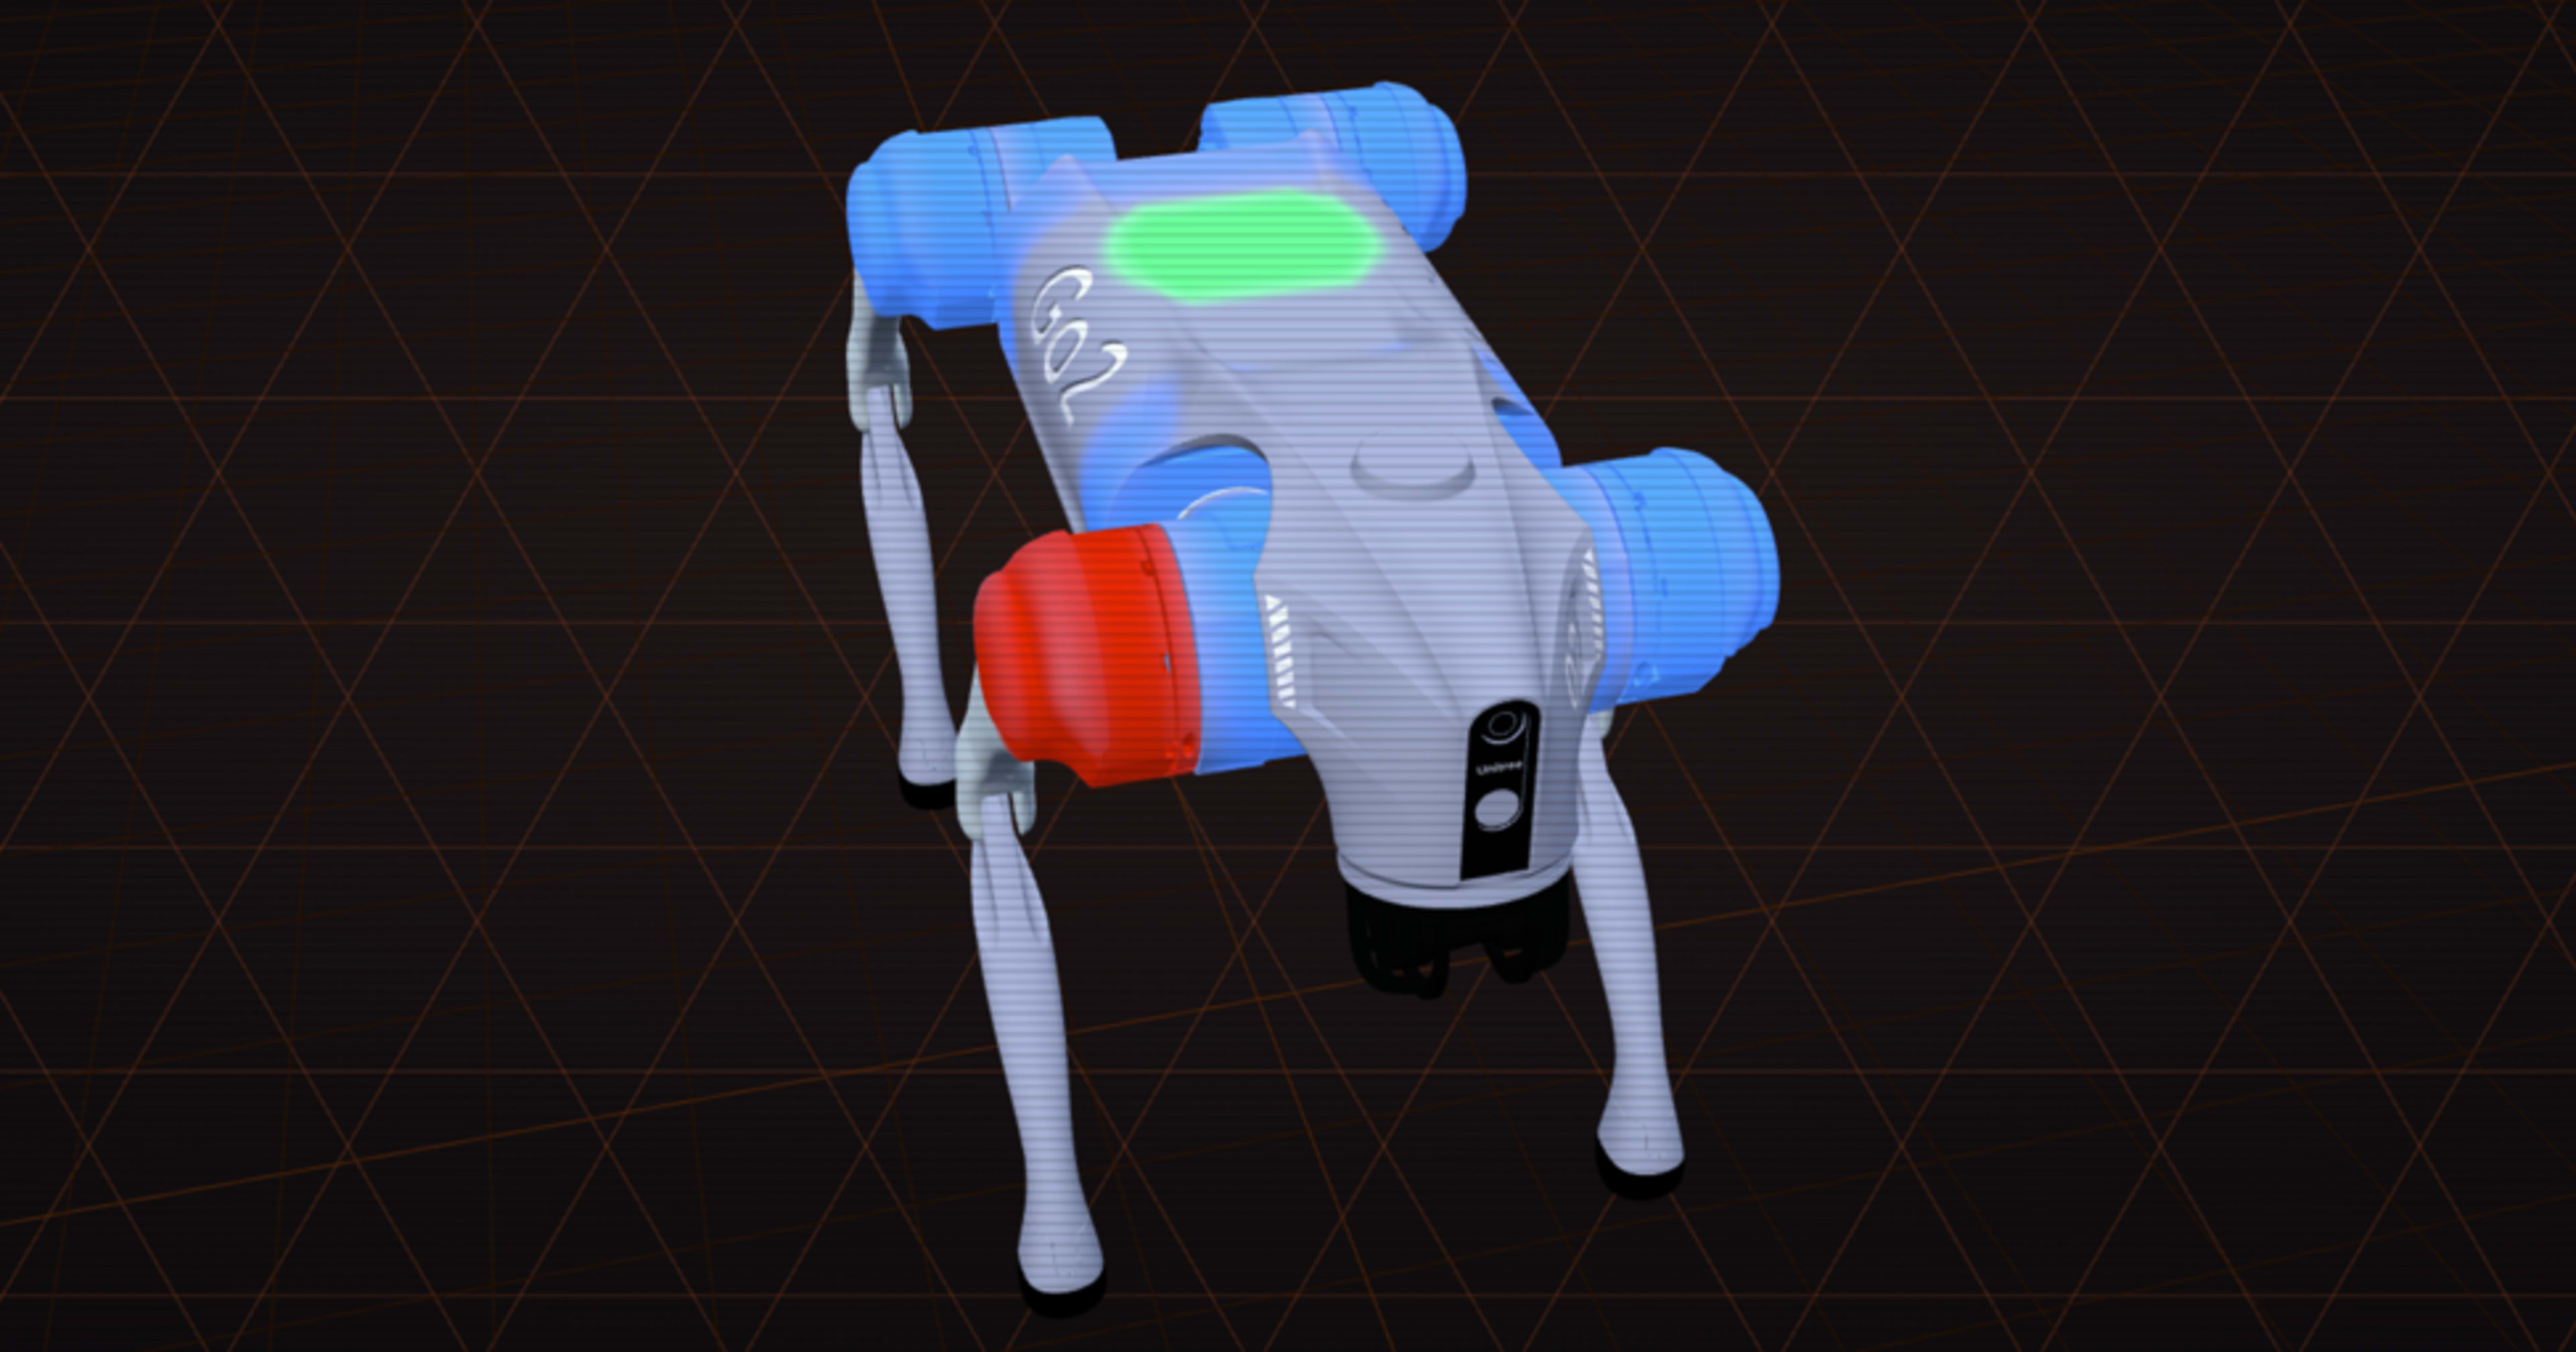
I tried mapping motor temperatures onto a 3D model using the robot's URDF

This page has been translated by machine translation. View original
Introduction
I'm Fujii (Da) from the Manufacturing Business Technology Department.
Depending on the robot, you can retrieve motor temperatures for each axis.
With Universal Robots, you can read all 6 axes in Celsius via RTDE's joint_temperatures, and with Unitree Go2, all 12 axes are available in lowstate's motor_state[i].temperature.
However, even if 6 or 12 values are lined up on a dashboard, it's not immediately clear which axis is hot and where.
If axis 3 shows 52°C, you still can't tell where the heat is accumulating on the robot body without mentally mapping whether that's the elbow or the wrist.
So I tried overlaying temperatures as colors on top of the robot's 3D model, viewable in a browser.
If only one axis heats up, you can immediately tell which axis it is just by looking at the color.
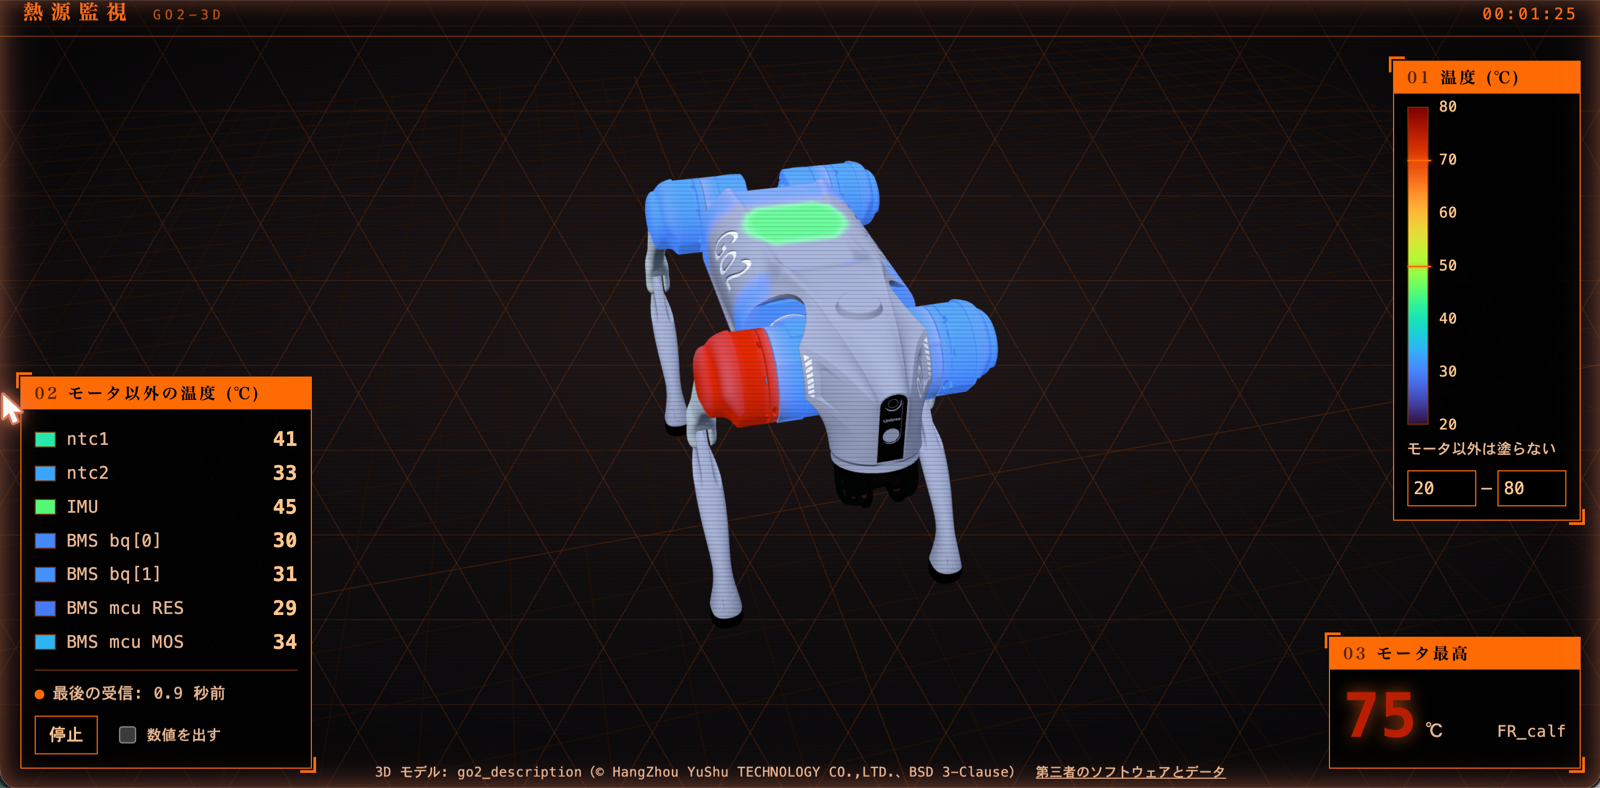
The built version is publicly available. Temperatures are dummy values, but you can interact with it in your browser.
Adding ?robot=ur5e switches to the UR5e.
In this article, I'll explain how to obtain heat source coordinates from a URDF, and how to paint only around those areas.
The pose is fixed and joint angles are not being fed in. Temperature history is not retained either.
This is a viewer that only reads temperatures and does not send commands to the robot.
I obtained actual robot temperatures from a Unitree Go2. I was able to observe temperatures rising as I repeatedly made it lie down and stand up.
I confirmed that this can work with other robots by loading the URDF for Universal Robots UR5e (temperatures are dummy values).
The verification environment is as follows.
| Item | Value |
|---|---|
| Robot | Unitree Go2 R&D+ (EDU equivalent), 100 TOPS configuration |
| 3D Model | go2_description from unitree_ros (commit 7d6075f7), UR5e from Universal_Robots_ROS2_Description (tag 4.3.1) |
| Machine running browser | macOS Tahoe 26.6.2, Google Chrome 152.0.7977.83 (arm64) |
| Browser-side dependencies | TypeScript 5.9.3, three.js 0.183.2, urdf-loader 0.13.1, Vite 6.4.3 |
| xacro expansion | Docker with ros:jazzy, xacro 2.1.1 |
| Temperature acquisition | Python 3.10, subscribing to DDS rt/lf/lowstate via unitree_sdk2py |
| Machine running bridge | NVIDIA DGX Spark (wired connection to Go2) |
The previous article covers what happened when the Unitree Go2 arrived at the Osaka office.
What is URDF
URDF is an XML format for describing the shape and structure of a robot.
It stands for Unified Robot Description Format and is used as a standard in ROS.
The contents consist of two elements: link and joint.
A link is a component that holds references to mesh files representing its shape and weight information.
A joint is a connection between two links, specifying where and in what orientation it attaches, and what range of motion it has.
The elbow joint of the UR5e looks like this:
<joint name="elbow_joint" type="revolute">
  <parent link="upper_arm_link"/>
  <child link="forearm_link"/>
  <origin xyz="-0.425 0 0" rpy="0 0 0"/>
  <limit lower="-3.141592653589793" upper="3.141592653589793" effort="150.0" velocity="3.141592653589793"/>
</joint>
The 0.425 in origin is the length of the upper arm.
Robot manufacturers often publish these, and they are used in simulators and motion planning.
In this article, I use them for two purposes: displaying link meshes on screen, and using the positional information held by joints.
Obtaining Heat Source Coordinates from URDF
A joint's <origin> specifies the origin of the child link in the parent link's coordinate system.
In other words, the origin of the child link is the position of that joint.
For robots where the motor is coaxially positioned with the joint axis, this can be used as the motor's position.
This does not always match depending on the drive mechanism. In structures where a distant joint is driven by belt, wire, or linkage, the joint position and motor position are separate.
The Go2's knee falls into this category.
Sometimes more accurate coordinates are already in the URDF.
The go2_description for Go2 has links called *_rotor that have no visuals, so nothing is drawn on screen.
Since the joint's parent and origin correspond to the actual mounting position, there's no need to estimate from the joint position.
The order to look for heat source coordinates is as follows:
- Links representing the position of temperature sensors
- Actuator links like
*_rotor - CAD data or specifications published by the vendor
- The joint's origin — use this as a substitute when none of the above are available
What we're deciding here is where on the 3D model to place the color.
Where the sensor is actually measuring is a separate matter; this is often not publicly available and was not determined for the two robot models covered in this article. I'll discuss this in the final section.
Even when a joint rotates, the origin of the child link does not move relative to the parent.
This is because a revolute joint changes the rotation around the axis, not the position of the origin.
Therefore, the relative position to the mesh of the link connected to that joint remains the same even when the pose changes.
Expanding xacro
URDFs for industrial robots are often stored as xacro in official repositories.
I checked Universal Robots, Franka Robotics, and ros-industrial ABB / FANUC / KUKA / Motoman, and none of them had plain .urdf files included.
Since browsers cannot expand xacro, you need to convert it to URDF in advance.
For the UR5e, urdf/ur.urdf.xacro is the single top-level file, with per-model differences separated into config/ur5e/*.yaml.
xacro urdf/ur.urdf.xacro ur_type:=ur5e name:=ur5e > ur5e.urdf
Running this command requires a ROS environment.
The $(find ur_description) that xacro reads is resolved via ament package search, so you need to expose the cloned directory as share/ur_description.
I set this up using Docker with ros:jazzy. First, build an image with xacro installed.
FROM ros:jazzy

RUN apt-get update -qq \
 && apt-get install -y -qq ros-jazzy-xacro \
 && rm -rf /var/lib/apt/lists/*
docker build -t ur-xacro .
Next, clone with a pinned tag, pass it to the container, build the ament index, and then expand:
git clone --depth 1 --branch 4.3.1 \
  https://github.com/UniversalRobots/Universal_Robots_ROS2_Description.git ur-desc

docker run --rm -v "$PWD/ur-desc:/src:ro" ur-xacro bash -lc '
{
  mkdir -p /ament/share/ament_index/resource_index/packages
  touch /ament/share/ament_index/resource_index/packages/ur_description
  ln -s /src /ament/share/ur_description
} 1>&2
source /opt/ros/jazzy/setup.bash
export AMENT_PREFIX_PATH=/ament:$AMENT_PREFIX_PATH
xacro /src/urdf/ur.urdf.xacro ur_type:=ur5e name:=ur5e
' > ur5e.urdf
The setup output is redirected to stderr with 1>&2 to keep only the URDF on stdout.
If apt logs get mixed in, they'll flow directly into the URDF.
If you're working on macOS, you need to be careful about mount paths.
/tmp is a symbolic link to /private/tmp, so passing /tmp/... will show an empty directory on the container side.
I initially ran into No such file or directory because of this.
After expansion, you get a single URDF of about 12 KB.
With this and the 7 COLLADA files in meshes/ur5e/visual/ (9.3 MB total), the browser side has everything it needs.
Mesh references are in the form package://ur_description/meshes/ur5e/visual/base.dae, so I use urdf-loader's packages to remap the package name to the serving path.
Whether to apply a pose after loading depends on the robot model.
For the UR5e, all joint ranges include 0, so the shape doesn't break as-is.
For the Go2, *_calf_joint has limits of [-2.7227, -0.83776], with 0 outside the range, so loading alone results in all four legs sticking out straight as rods. I apply a standing pose and then ground it.
The mesh loading part has been replaced with a custom implementation.
urdf-loader's loadMeshCb changed in 0.13.0 to include material as a third argument, making it a 4-argument function.
This is still the case in version 0.13.1 used for verification.
type MeshLoadFn = (
  url: string,
  manager: THREE.LoadingManager,
  material: THREE.Material,
  onLoad: (mesh: THREE.Object3D, err?: Error) => void,
) => void;
Examples out there, including in the README, still use the 3-argument form, so copying them directly means the callback never gets called.
Since failures are caught by console.error and execution continues, leaving it as-is will silently result in missing model parts.
Deciding Which Links to Designate as Heat Sources
The UR5e has 6 axes, and I designate the driven links as heat sources.
| Axis | Joint | Link designated as heat source |
|---|---|---|
| 1 | shoulder_pan_joint |
shoulder_link |
| 2 | shoulder_lift_joint |
upper_arm_link |
| 3 | elbow_joint |
forearm_link |
| 4 | wrist_1_joint |
wrist_1_link |
| 5 | wrist_2_joint |
wrist_2_link |
| 6 | wrist_3_joint |
wrist_3_link |
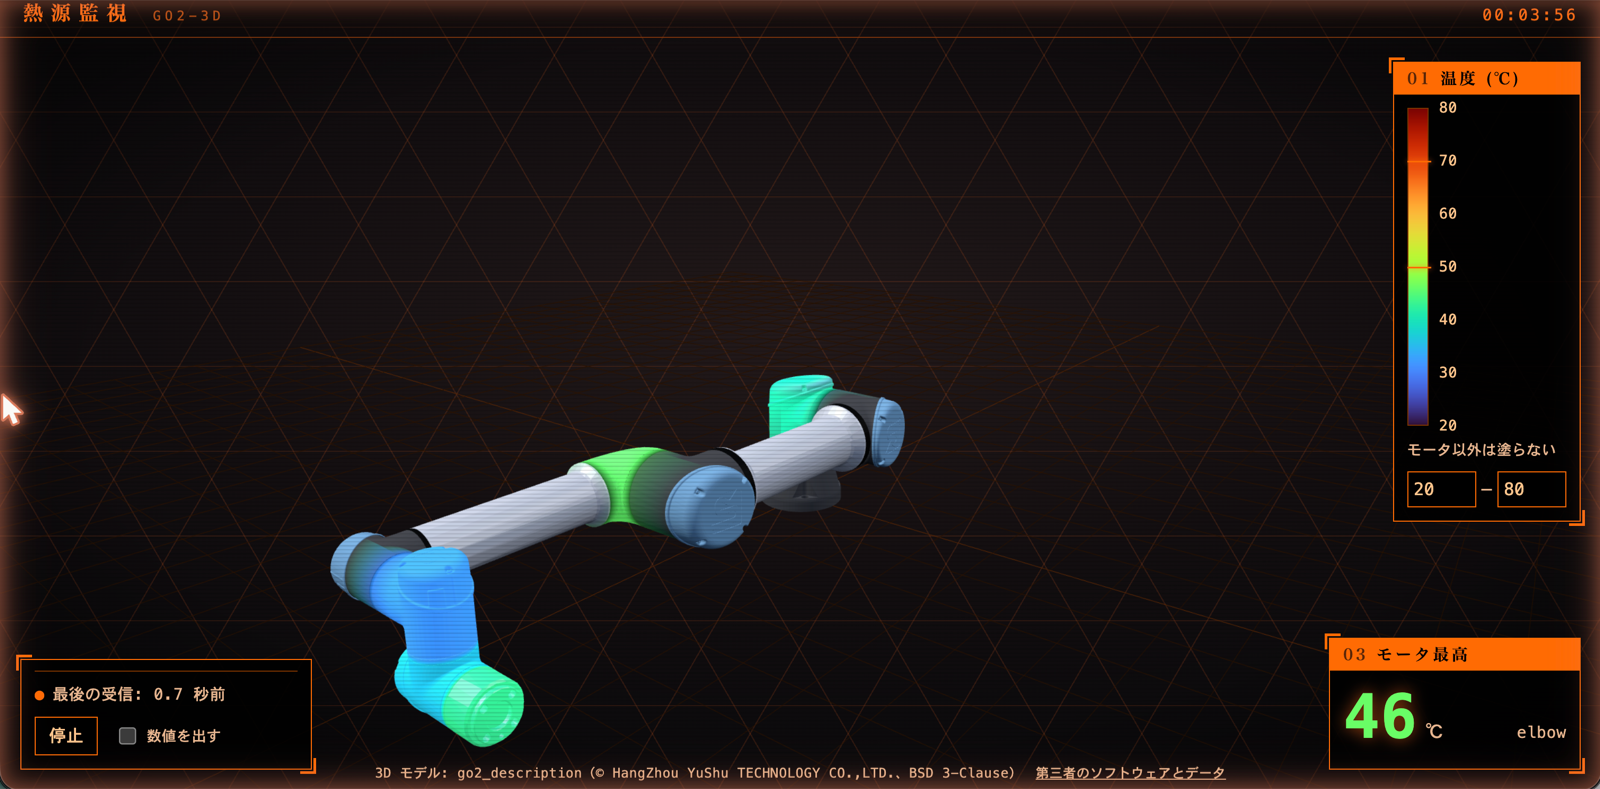
The targets for coloring are the designated link itself and its parent link.
Since the link changes across a joint, leaving only one side means the other side remains its original color.
On actual robots, both sides of a joint get hot, so coloring both is closer to reality.
Some axes won't get colored with only one side.
Axis 1's joint is at the shoulder's center of rotation, at a height of 163 mm.
However, its parent's base mesh only extends to a height of 99 mm, so the joint position is outside the mesh.
If you only target the parent side, no color will be applied to this axis.
Some axes also share the same coordinates.
Measuring from base_link as the origin in the 0 pose, the heat sources for axes 1 and 2 are both at z=+0.163.
This is because the two shoulder axes share the same center of rotation, making them indistinguishable by coordinates alone.
Since I implement winner-takes-all for the nearest single heat source, shoulder_link, which is closest to both, gets axis 1's color, and axis 2's color only appears on the upper arm side.
This approach is not suitable for detecting anomalies. Even if axis 2 is hotter, axis 1's color will appear on shoulder_link.
Since a single face can only hold one color, it's impossible to represent multiple temperatures at the same position using color alone.
For this reason, numerical values for each axis are displayed alongside the visualization.
Other options include giving priority to the hotter side, or placing per-axis markers slightly offset at the heat source positions.
The coloring radius is determined by the distance from the heat source to the surface of the component.
The heat source is at the joint's center of rotation, and the component is a hollow cylinder around it.
Measuring from each heat source to the nearest vertex on the UR5e: the 2 shoulder axes are 56 mm, the elbow is 22 mm, and the 3 wrist axes are 16–38 mm.
If the radius falls below this distance, not a single vertex will be colored for that heat source.
Starting with a radius of 60 mm, almost nothing was colored around the shoulder. At 100 mm, all 6 axes were covered.
This distance varies by robot.
For the Go2, heat sources are inside the chassis, with the nearest vertex being 15 mm for the thigh, 40 mm for the calf, and 46–50 mm for the hip.
This is why 70 mm is sufficient.
When determining this for your own URDF, start by measuring the distance from each heat source to the nearest vertex.
Coloring Entire Links Moves Away from Heat Sources
At first, I thought it would be enough to color entire links.
A straightforward mapping: if a temperature comes in for an axis, color that axis's link.
The first issue I encountered was that material instances are shared across links.
Go2's hip.dae is referenced by 4 links.
To avoid parsing the same file multiple times, I was reusing cloned results via clone().
Object3D.clone() inherits references to geometry and material.
The object hierarchy is duplicated, but the material still points to the same underlying instance.
As a result, when I changed the color of the right front leg's hip, all four legs' hips turned the same color.
To separate them, clone the material itself.
mesh.material = Array.isArray(mesh.material)
  ? mesh.material.map((m) => m.clone())
  : mesh.material.clone();
Since meshes within a single .dae file also share materials, it's efficient to keep track of cloned materials using the original as a key to avoid redundant cloning.
Once I had proper color separation, I noticed that positions weren't matching up.
Measuring the Go2 URDF in standing pose, all 3 motors of a single leg are at the same height as the body, with a maximum spacing of only 103 mm.
The motor that drives the knee is also at the base of the thigh, driving the calf through a linkage mechanism.
There are no motors in the calf or foot.
If you color the calf link based on calf temperature, a spot 215 mm away from the heat source turns red.
Color the foot as well and that's 341 mm.
The URDF's outer dimensions are 704 mm in the front-to-back direction, so the color ends up about 30% of the total length away from where it should be.
An image of a red shin is intuitive, but that part isn't actually hot.
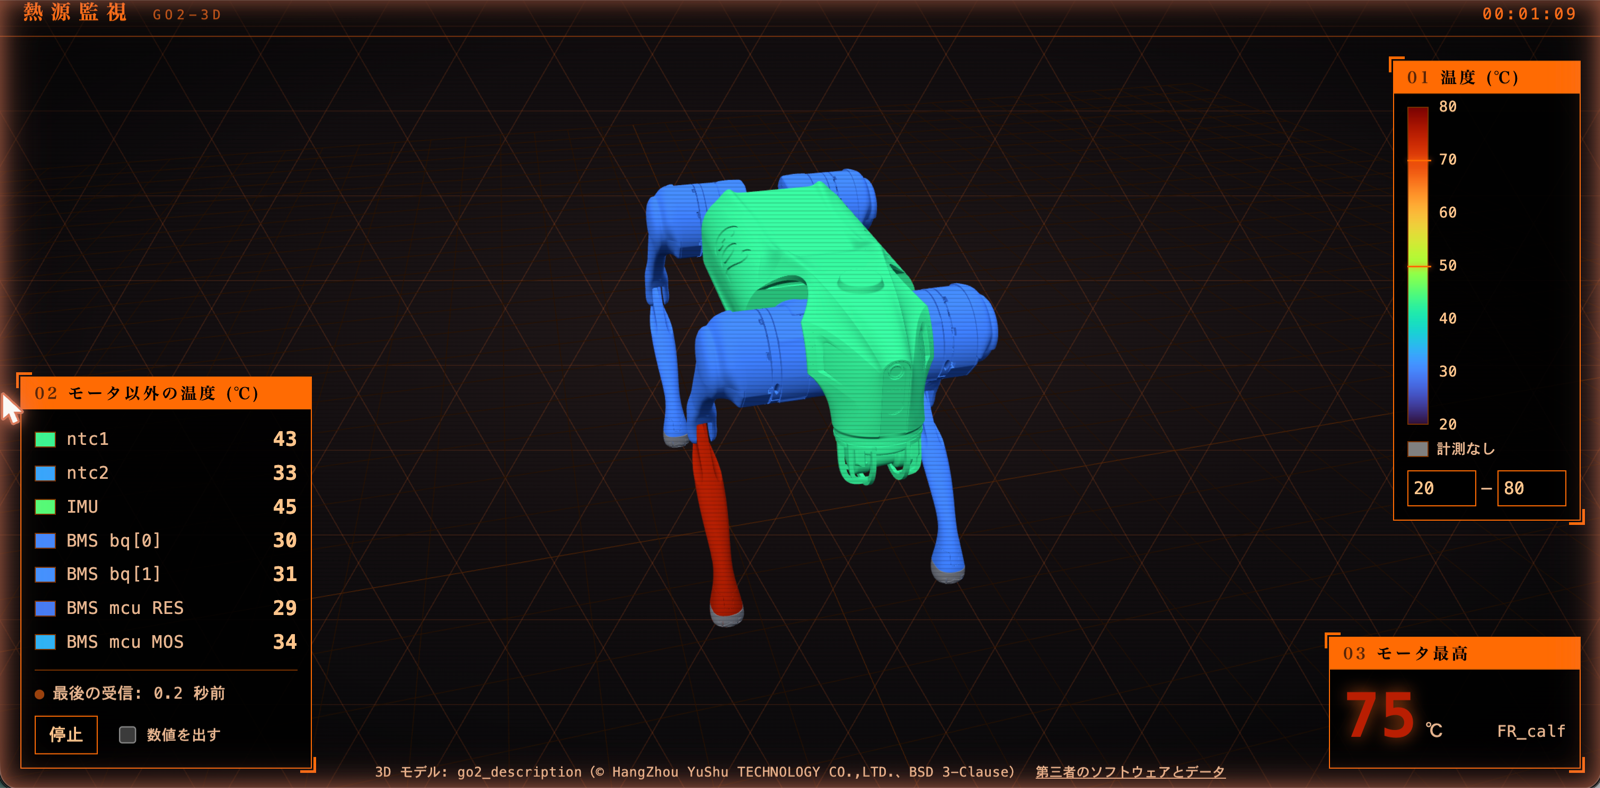
This is the same temperature as shown in the image at the beginning.
Coloring only around the heat source turns the base where the motor is located red, while coloring entire links turns the shin red.
The large discrepancy in the Go2 is due to its drive mechanism.
For a 6-axis arm where each joint has its own reducer and motor, the joint position and motor position nearly coincide, so the offset is not nearly this large.
Even so, as long as you color entire links, the color extends beyond the heat source.
Coloring the entire upper arm of the UR5e would apply the same color from the base where the motor is, all the way to the elbow 425 mm away.
If you want to see where the heat is, you need to limit the coloring to the area around the heat source.
Coloring Only Around the Heat Source
For each vertex, I calculate the index of the nearest heat source and a weight derived from the distance.
for (let i = 0; i < count; i++) {
  vertex.fromBufferAttribute(position, i).applyMatrix4(toWorld);
  let bestDistance = Infinity;
  let bestIndex = 0;
  for (const { site, world } of sites) {
    const distance = vertex.distanceTo(world);
    if (distance < bestDistance) {
      bestDistance = distance;
      bestIndex = site.slot;
    }
  }
  if (bestDistance >= radius) continue;
  motor[i] = bestIndex;
  // Weight is 1 up to 70% from center, then drops to 0 by radius
  heat[i] = 1 - THREE.MathUtils.smoothstep(bestDistance, radius * 0.7, radius);
}
The computed indices and weights are stored as vertex attributes, and colors are blended in the shader.
When temperatures update, all that's needed is to update uniforms — the vertices are computed once and never touched again.
The heat sources considered as candidates are only those fixed to the link the mesh belongs to.
If you pick the nearest heat source from the entire model, the assignment could change when the robot folds and different joints come closer together.
However, since the pose is currently fixed, this hasn't been verified with movement.
The shader receives temperature values, and colors are looked up from a colormap per fragment.
If color is determined at the vertex level and then interpolated, the interpolated result can pass through colors not on the colormap.
In exchange, at boundaries where adjacent vertices are assigned to different axes, the value becomes a blend of those two axes' temperatures.
This assignment runs only once during initialization.
The computation scales with the product of vertex count and number of heat sources, and since the Go2's 9 painted meshes exceed 1 million vertices, this contributes to part of the load time.
Distances are measured in world coordinates.
Mesh coordinate systems can vary in units and axis orientation depending on how the model was created.
COLLADA can declare units and node matrices separately, so vertices can remain in millimeters even when the declaration says meters.
Aligning to world coordinates fixes the unit to meters and the axes to URDF convention, allowing the radius to be applied directly.
Using a weighted average would mix together the 3 motors packed within 103 mm, making them indistinguishable, so I use a winner-takes-all approach with the nearest single source.
To check whether the painted area is too large, I look at the colored surface area.
Vertex count is not a substitute for area — triangles in the mesh concentrate around motor housings, so vertex counts are a poor reflection of the visually apparent area.
Area is computed per triangle by averaging the weights of the 3 vertices and then prorating.
Measuring this way, the results for the UR5e were as follows:
| Part | Surface area | Proportion colored |
|---|---|---|
base_link_inertia |
745 cm² | 8.2% |
shoulder_link |
841 cm² | 64.9% |
upper_arm_link |
2,427 cm² | 2.7% |
forearm_link |
1,427 cm² | 26.4% |
wrist_1_link |
482 cm² | 96.8% |
wrist_2_link |
424 cm² | 100.0% |
wrist_3_link |
167 cm² | 100.0% |
The 3 wrist components exceeding 96% is because the components themselves are close in size to the motor housing.
The upper arm's 2.7% is because only the base end gets colored despite the arm being 425 mm long.
For the Go2, base was 17.1%, the 4 *_hip links were 77.7%, and the 4 *_thigh links were 75.1%.
The high percentage for *_hip is because the cylindrical hip section is essentially the motor housing for the thigh-driving motor.
Not Rendering Axes with No Data as Minimum Temperature
When temperatures are stored as a single array, axes with no incoming data remain at 0.
If the lower end of the range is 20°C, the screen displays a deep purple "cold axis."
This makes it impossible to visually distinguish between an axis that has actually cooled to 20°C and one for which no data has arrived.
I added a per-axis uniform tracking whether data has arrived, and set the weight to 0 for those without data.
They remain at their natural color, making it visually apparent that no color has been applied.
This situation arises when the axis count doesn't match the URDF, or when only some axes provide temperature data.
How to Determine the Color Range
If you want to see how much margin remains before a protection threshold, define the range as absolute values like 20–80°C.
However, with this range, it's hard to tell which axis is hot.
Go2 motor temperatures during standby are 33–38°C, and while they rise when you repeatedly make it lie down and stand up, the color barely moves within a 60°C span.
If you want to see which axis is taking on more load, narrow the range to something like 30–45°C.
Since the right range changes depending on what you want to see, I've made it adjustable via input fields on the screen.
The colormap is turbo with 256 steps.
three.js's Lut includes rainbow, but it uses the same ordering as jet, which can create the impression of gradients that aren't in the data.
Turbo was created as a replacement for this, and makes it easier to perceive local differences.
When mapping 20°C to 80°C, the endpoints are not as vivid as you might expect.
The lower end is #30123B, a dark purple, and the upper end is #7A0403, a dark red.
I verify that the legend and on-screen colors match in two separate steps.
The first is whether the colormap values feed directly into the material.
The turbo table is in sRGB values, while colors held by three.js materials are in the working color space, so a conversion needs to happen somewhere.
I verified with a script that round-tripping all 256 steps returns the original values.
The second is whether the pixels displayed on screen match the legend.
Even if the material colors are correct, lighting and tone mapping are applied, so they won't match exactly.
The reason reds look brighter on screen is because lighting is boosting them.
When comparing, I switch to a mode that removes shading so pixels directly represent material colors.
If it looks bright in that state, a conversion is missing; if it looks dark, conversion is happening twice.
Colors animate smoothly with a time constant of 0.25 seconds.
What's being animated here is also the temperature value. The reason is the same as for in-face interpolation: blending colors can pass through colors not on the colormap.
Connecting Temperature Data
All that gets passed to the screen is an array of per-axis temperatures and the receive timestamp.
If you're already able to read temperatures, you only need to write the part that converts them into this format to put them on screen.
For the Go2, I wrote a small bridge that subscribes to DDS rt/lf/lowstate and streams only the temperatures to the browser.
Since one-way communication is sufficient, I used Server-Sent Events.
For UR, joint_temperatures from RTDE (VECTOR6D, Celsius) would go here.
While writing the temperature streaming side, I identified three things that are essential.
The first is to always send data even when values haven't changed.
Since the last received time is used to detect connection drops, skipping duplicates will falsely show "data is stale" for a stationary robot.
The second is to not present stale values as current when the connection drops.
The bridge stops sending data and switches to SSE comment lines once lowstate has been absent for 2 seconds.
Since EventSource doesn't deliver comment lines as message events, the interruption shows up directly on screen.
When I verified by shutting down the robot, both the colors and numerical values disappeared, leaving only "waiting for data."
Stale values are never left on screen as if they were current temperatures.
The third is the sign of a single byte.
lowstate temperatures are transmitted as 1 byte, but unitree_ros2's .msg uses int8 while unitree_sdk2's IDL uses uint8 — these are inconsistent.
Since unitree_sdk2py follows the latter, reading values as-is produces readings in the 200°C range for values outside the valid range. I applied sign correction on the subscriber side.
def signed(value: int) -> int:
    return value - 256 if value > 127 else value
If you get the array index to axis mapping wrong, the display looks normal but shows temperatures from a different axis.
I matched the Go2's ordering to the definitions in unitree_ros2's motor_crc.h, and verified end, middle, and beginning mappings on screen by making only one axis hot with dummy temperatures.
The most confusing issue I encountered while connecting was what happens when an exception is raised inside a subscription callback.
Since unitree_sdk2py calls the callback within the receive thread, an exception terminates that thread.
After that, lowstate never arrives again, and the screen only shows "data reception is interrupted," making it impossible to trace the cause.
Isolation requires watching the number of received messages and the last arrival time on the streaming side.
Note that this setup is for verification purposes.
The bridge binds only to 127.0.0.1 by default and runs on a closed network with a wired connection to the robot.
For external exposure, you'd need to decide on the bind interface, authentication, and CORS handling. Temperatures and operational status are also not information you'd want to expose externally.
How Much Do We Understand About What the Temperatures Mean
Where motor_state[i].temperature is measured — whether the stator, driver board, or housing — is not publicly documented.
Colors are placed at motor positions, but whether sensors are actually there is unknown.
Go2's lowstate also includes temperature_ntc1 and temperature_ntc2, but where they measure has not been confirmed.
Neither unitree_ros2's .msg nor the README includes comments for these, and while the neighboring power_v and power_a are described as battery voltage and current, these two fields are left blank.
I've seen an explanation that "ntc1 is the center of the main board, ntc2 is the auto-charging section," but the source was a mirror of Unitree's H1 developer documentation and was not written about the Go2.
For this reason, the screen displays them using the field names ntc1 and ntc2 without assigning component names.
Since there are no links in the URDF corresponding to the board, battery, or charging section, placing coordinates by guesswork would make them visually indistinguishable from positions derived from *_rotor.
imu_state.temperature had a value of 79.
This was the value when the robot was just lying in standby, while the same robot's motors were at 33–38°C.
The imu link exists in the URDF with confirmed coordinates, so I do include it as a color, but displaying it as-is makes the center of the body appear permanently red.
Motor temperature protection thresholds are also not publicly available.
The 50°C and 70°C markers shown on screen are just aligned with values used in other implementations, not actual protection thresholds.
Having the default range set to 20–80°C is also a placeholder.
I did observe temperatures rising through repeated lie-down and stand-up cycles, but they didn't come close to the upper end.
I have not yet obtained a basis for where to place the upper bound.
Values whose measurement points are unknown are shown as numbers only, not as colors.
They're also displayed without component names, like temperature_ntc1, and the range is kept adjustable.
Industrial robot controllers often don't publish measurement points either, so the same judgment will be needed somewhere along the way.
Conclusion
Given a URDF, it's possible to overlay per-axis motor temperatures as colors on the robot's 3D model.
If only one axis heats up, you can immediately tell which axis it is just by looking at the color.
There are four key points:
- The
<origin>of a joint represents the joint's position, not necessarily the motor's actual mounting position. It can be used directly for robots where the motor is coaxially mounted. - If actuator links like
*_rotoror CAD published by the vendor are available, look for those first. - Coloring entire links extends color beyond the heat source. Instead, assign each vertex to its nearest heat source and color only around those points.
- The range for color assignment changes depending on whether you're monitoring margins before protection thresholds or differences between axes. When multiple axes share the same position, color alone is insufficient — display numerical values alongside.
To more accurately reflect the robot's state, you could also feed in joint angles to match the real robot's current pose.
Since the main theme this time was visualizing temperature data, I didn't go that far. If you try building on this article to visualize robot data with a 3D model, taking it that extra step could make for an interesting project.
I hope this serves as a reference for anyone looking to visualize robot states.