I tried connecting factory floor videos with process documents to make it searchable for abnormality candidates in operations

This page has been translated by machine translation. View original
Hello! I'm tanaka-takeru from the Classmethod Manufacturing Business Technology Department.
In manufacturing sites, with so much information such as equipment signals, quality records, standard work documents, and daily reports, it is not easy to comprehensively understand processes cross-functionally while production continues and conditions constantly change.
- Is safety being maintained? Can today's production targets be met? Are there any deviations from regulations?
In response to this situation, NVIDIA has announced the Factory Operations Blueprint, commonly known as FOX. It is a configuration that connects equipment signals, quality information, work procedures, and field alerts, allowing the Factory Manager AI to understand and support field conditions.
On the other hand, since it is not realistic to immediately aim for a factory-wide data infrastructure or full autonomy, the Mini-FOX introduced by our colleague Morishige is an approach that starts with small-scale validation from a single line, single camera, and single use case.
Introduction
This time, drawing on the Mini-FOX concept, I built an integrated search and verification demo using manufacturing data, focused on a single process, a single worker-perspective video, and a single question: "I want to know about anomalies that occurred outside of standard operations."
This article introduces the pipeline from extracting verification candidates from a work video, linking them to document information, and asking questions in natural language, along with a demo video.
Data
For the video, I used factory001_worker001_00002.mp4 from Egocentric-10K.
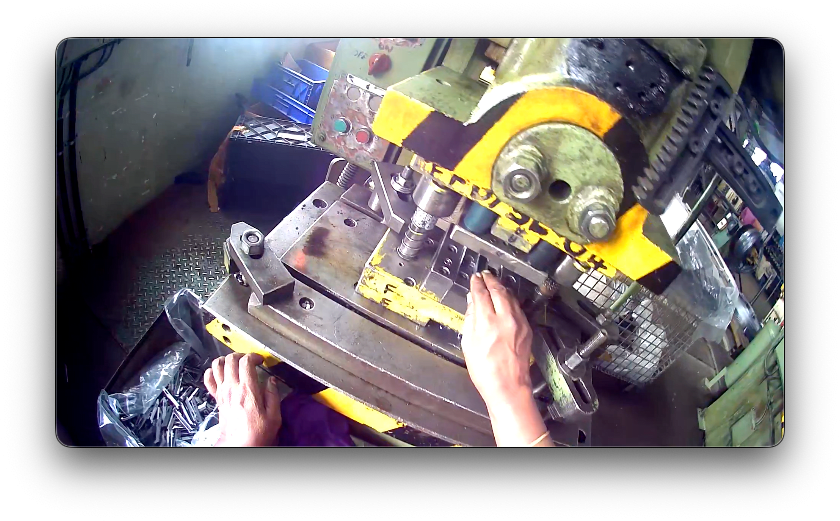
This is a video of press machine work recorded from a worker's perspective. The file used this time is approximately 20 minutes, 1920×1080, 30FPS. It was shot wide-angle with a near-fisheye lens and also shows barrel distortion.
Egocentric-10K is an open dataset containing first-person videos inside factories. The video used this time does not come with annotation information such as process names, work standards, or anomaly labels. Therefore, rather than judging "what is correct work" by looking at the video alone, I decided to create process documents and combine them.
Pipeline
Processing follows this flow.
- The work video is sampled at 5FPS, and how much movement has occurred since the previous frame is quantified from frame differences. Die region and hand movements are also detected simultaneously.
- The time series of motion amounts is analyzed using autocorrelation, and intervals that deviate from the usual repetitive motion are extracted as "verification candidate intervals." At this point, they are not confirmed as anomalies.
- Only the candidate intervals are re-extracted at 10FPS and passed to a VLM running locally (Qwen3-VL-4B-Instruct). Here, the visible movements are recorded as observation notes.
- A human reviews as needed to confirm whether it is an anomaly (asynchronous). Unconfirmed candidates remain as-is.
- Time series data, VLM observation notes, manual reviews, and process-related documents are aggregated into event JSON.
- When a question is received from a user, relevant event JSONs and document chunks are selected and passed to an LLM (Claude Sonnet 5). Claude constructs a response along with its evidence.
In the initial stage, the entire video is not passed to a large-scale model. The video is processed at 5FPS to convert the overall motion amount of the screen, die region tracking, and hand position/movement into time series data, and from there, intervals that differ from normal repetitive motion are extracted as verification candidates to narrow down the information that deserves attention.
This is close to the staged configuration of Mini-FOX, which says "first convert to events, then look deeply only at necessary candidates."
Input Information
Video Data
On the video side, the following information was detected and made available on the same time axis.
| Information | Acquisition method | Use in this project |
|---|---|---|
| Motion amount | Frame difference | Detection of disruption in repetitive motion, motion stagnation |
| Die region | Tracking with SAM2 | Supplementary information on whether the operator is near the die, whether the region is occluded |
| Hand movement | MediaPipe Hand Landmarker | Supplementary information on hand position, speed, and left-right movement |
As a prerequisite, how quickly and inexpensively the pipeline can be horizontally deployed to other processes and products is critically important, so basically no fine-tuning or optimization is performed, and the pipeline is constructed to be operable zero-shot or one-shot.
Here is an example of the information extracted from the video overlaid on the footage.
- Regarding motion amount, since first-person perspective footage often changes angle with each work step, extracting the overall motion amount of the video is expected to roughly capture periodicity. It is plotted at the bottom of the demo video (inter-frame change amount, dimensionless). Autocorrelation with a 30-second window is computed to find locations that deviate from stable repetitive motion throughout the video. The frame difference calculation itself is very lightweight and is easy to handle even on edge devices like Raspberry Pi.
- The die region is tracked with Meta's SAM2, as it is considered most related to value-added time. It is the green region in the center of the video. By extracting changes in this die region, it is possible to count cycle times and production quantities.
https://github.com/facebookresearch/sam2?tab=readme-ov-file - Hand movement is detected with MediaPipe Hand Landmarker. Note that in actual worksites where gloves are worn, accuracy may decrease depending on the color, bulge, and adhesion of oil or dirt on the gloves.
https://developers.google.com/edge/mediapipe/solutions/vision/hand_landmarker#models
Document Data
The following demo documents were created.
| Document | Primary role |
|---|---|
| Safety Work Standard Regulations | Higher-level safety rules |
| Standard Work Procedure Manual | Work procedures and safety precautions |
| Standard Work Combination Sheet | Standard takt time and element operations for P-040 |
| QC Process Chart | Quality standards during workpiece setting |
| Daily Inspection / Production Daily Report | Records of results, warnings, and delays |
An example is shown below.
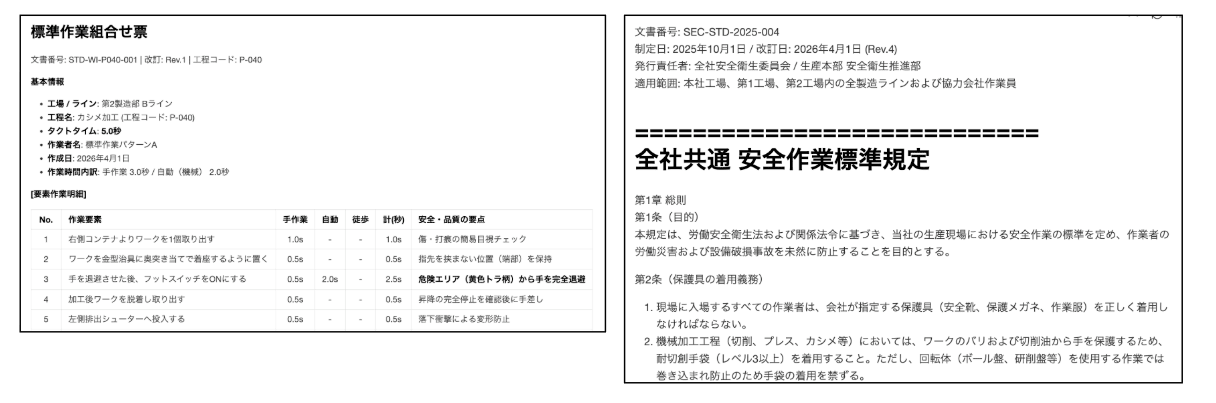
There are a very large number and variety of process-related documents, but I assumed they fall into three broad categories.
- First, information defined at the company or business unit level. This includes rules, regulations, and division of duties; in this case, the "Safety Work Standard Regulations" defined company-wide.
- Next, information that defines the process. A QC process chart, standard work combination sheet, and standard work procedure manual were prepared.
- Finally, information that flows through the process on a daily basis. This includes production plans and staffing arrangements; in this case, a daily inspection report and production daily report were prepared.
The fictionally assigned process code P-040 and document numbers are used as keys to trace events and related documents.
Event JSON
Information about intervals identified as "this might be different from usual movement" is aggregated into units that are easy for the downstream LLM to process.
As shown in the table below, five types of information are consolidated.
| Layer | Event JSON field | What it contains |
|---|---|---|
| 1. Measured values | time_series_evidence |
Time series data such as motion amount, die region, and hand position |
| 2. Rule-based candidate extraction | candidate_detection |
Extraction signals and aggregated values that produce the same result given the same input and conditions |
| 3. VLM video observation | visual_evidence |
Description of visible movement and notes on how things appear |
| 4. Manual review | human_review |
Facts recorded by a person after reviewing the video |
| 5. Document evidence | document_links |
References to standard work documents, QC process charts, daily reports, etc. |
As an example, the JSON for a verification candidate event with human review information looks like the following. Aggregated values, VLM notes, and document links are excerpted for readability.
{
  "entity_type": "tact_deviation_candidate",
  "event_id": "P040-CAND-001",
  "process_id": "P-040",
  "time_range_sec": [335.0, 394.8],
  "focus_sec": 370.0,
  "status": "Needs verification",
  "candidate_detection": {
    "signals": ["Loss of repetitive motion", "Deviation from normal cycle"],
    "metrics": {
      "observed_period_sec": [7.6, 7.8, null],
      "period_strength_range": [0.147, 0.304]
    }
  },
  "time_series_evidence": {
    "motion": {"source": "motion.jsonl", "motion": {"mean": 0.1115}},
    "die_roi": {"source": "tracks.jsonl", "present_ratio": 0.91},
    "hands": {"source": "hands.jsonl", "by_side": {"Left": {}, "Right": {}}}
  },
  "visual_evidence": {
    "sampling": {"fps": 10, "max_frames_per_inference": 16},
    "llm_excerpt": [{
      "range_sec": [368.6, 370.1],
      "visual_observation": "The right hand is adjusting a metal part placed on a jig.",
      "caveat": "Hand movement is minimal, making it difficult to determine the details of the action."
    }]
  },
  "human_review": [{
    "event_id": "P040-TD-002",
    "severity": "minor",
    "category": "workpiece_set_failure",
    "summary": "The workpiece could not be properly set into the crimping machine, resulting in a re-set."
  }],
  "document_links": [
    {"document_id": "STD-WI-P040-001", "section": "Basic information"},
    {"document_id": "QC-PR-2026-042", "section": "Workpiece setting"}
  ]
}
The fields may look a bit complex, but measured values, rule-based candidate extraction, VLM observation, manual review, and document evidence are stored separately to avoid conflating them.
- To avoid concluding that a verification candidate is definitively an anomaly
- To make the evidence behind an event easy to trace
- To allow appropriate human review to be incorporated
For example, "the hand appears to be adjusting the jig" is the output of the VLM, and whether that is actually true can only be known after a person reviews the video. If these were combined into a single summary sentence, it would become difficult for someone viewing it later, or for the LLM processing it, to determine where measured results end and interpretation begins — which is why the above structure was adopted.
Demo
In the demo screen, the work video and time series graph are displayed on the left, and the question UI is on the right. The die region tracked by SAM2 and the hands detected by MediaPipe are overlaid on the video. The video playback position and the position on the graph are always synchronized.
Clicking on a verification candidate interval in the graph displays the VLM output for that interval at the center, along with detection signals, die and hand time series information, and whether a manual review has been performed.
This time, I visually inspected the motion amount graph and manually confirmed the following two cases.
| Manual review event | Time | Content |
|---|---|---|
| P040-TD-002 | Around 6:05 | Workpiece could not be properly set into the crimping machine, resulting in a re-set |
| P040-TD-001 | Around 12:39–14:21 | Work was interrupted and the operator moved to another worker's location |
Automatic extraction produced 4 intervals as verification candidates, including these 2. The 2 manually confirmed cases and the still-unconfirmed candidates are clearly separated and recorded in the event JSON.
For example, when asked "I want to know about anomalies that occurred outside of standard operations," the LLM primarily responds about the manually confirmed workpiece setting failure and work interruption, while distinguishing unconfirmed intervals as "candidate detection only." A constraint is also in place to prevent stating causes or safety violations based solely on video observation notes.
Number of Frames Passed to the VLM
The video of verification candidate intervals was passed to Qwen3-VL-4B-Instruct running in a local environment for observation. Here, how to balance between passing only a few representative frames per interval versus passing all frames of the video becomes a challenge.
The length of these intervals is quite unpredictable. A fixed threshold could be applied, but the goal is to obtain information as straightforwardly as possible. The intervals actually alerted in the demo ranged in length from approximately 60 seconds to approximately 195 seconds. The former is a relatively short candidate interval, but the latter is a case of the operator leaving the workstation and moving to another worker's location.
In this case, for example, inputting only 3 frames — start, middle, and end — to the VLM risks missing the subtle hand adjustments or the changes leading up to the operator's departure. On the other hand, passing several minutes of video directly to the VLM is not realistic in terms of input size, inference time, and cost.
Therefore, the following approach was taken.
- Convert the candidate interval into an image sequence at 10fps
- Pass a maximum of 16 frames (equivalent to 1.6 seconds) per inference
- Retain observation notes in units of 16 frames, and save excerpts and references to the source data in the event JSON
In other words, rather than having the model understand an entire long candidate interval in one inference, it is observed in small chronological segments. In this execution, approximately 60-second candidates required 38 inferences, and approximately 195-second candidates required 122 inferences. Since the optimal number of frames is not universally fixed across all processes, it is assumed to vary according to the length of the candidate interval and the desired level of granularity.
10FPS was chosen not to enable full continuous understanding of the footage, but to a degree that makes it less likely to miss short changes such as hand adjustments near the jig.
Also, the role of the VLM is limited to describing the movements visible within the interval. It is not used to confirm anomalies, infer causes, or judge safety violations.
About RAG
When a question is received, first the event JSONs related to the question and process code are selected.
Next, the document chunks referenced by those events are gathered, and the events, documents, and manual reviews are all passed together to the LLM.
The response prompt includes the following constraints.
- Do not conflate candidate detections with manually confirmed events
- Do not use VLM observation notes as grounds for definitively concluding causes or violations
- Include the event IDs and document numbers that serve as evidence in the response
- State "unknown" for causes not present in the data
This time, rather than preparing a vector search infrastructure, documents were chunked by semantic units, and relevant ones were selected using process codes, document IDs, tags, and keywords.
Closing Thoughts
This time, I built a small integrated search and verification demo as a Mini-FOX using manufacturing video and process documents.
Rather than passing the entire video to a VLM, by extracting verification candidates from lightweight video metadata, converting candidates into events, and then linking them to documents, I was able to build a pipeline that is mindful of both processing costs and human reviewability.
I believe that adding information along the functional axis — such as from process engineering, production management, and quality assurance — in addition to upstream and downstream processes, will lead to great value.
Furthermore, the possibilities expand further with deployment along the SCM axis such as sales and procurement information linkage, and the PLM axis such as feedback to development/FE and improvement requests.
I think the appeal of Mini-FOX lies in the ability to start realizing these technologies at a small scale. I believe it is important to start with a single process, a single camera, and a single question, and experience the process of transforming video into information that can be referenced on the shop floor.