I tried NVIDIA's agent execution runtime NeMo Relay

This page has been translated by machine translation. View original
Introduction
Hello, I'm Morishige from Classmethod's Manufacturing Business Technology Department.
Did you know that NVIDIA's NeMo family now includes a runtime that takes on the actual execution of agents? It's called NeMo Relay.
When running agents, it's surprisingly hard to see what's happening inside. Which tools were called and how many times, how many round-trips occurred with the LLM, how many tokens were used in a single turn. Relay captures all of that from outside the agent and sends it out in formats like OpenTelemetry. The selling point is that you don't need to modify your existing agents.
When you hear "NeMo" and "agent," some of you might think of NeMo Agent Toolkit, but this is a different thing. While Agent Toolkit is a Python library for assembling agent workflows, Relay is a Rust-built runtime that sits at the layer below, supporting the execution boundary of assembled agents from underneath. In the official layer diagram, Relay is placed below Agent Toolkit, and there's also a path drawn for frameworks to call Relay directly.
Since Claude Code was on the list of supported agents, I tried running it in my local environment.
To share my impressions upfront: while setup takes just one command, what you can get varies considerably depending on the output destination. Token counts don't come out from the OpenTelemetry output. Knowing about these discrepancies in advance saves you from later realizing "the numbers I needed aren't there."
I previously wrote about NVIDIA's LLM routing infrastructure (article dated 2026-07-03). Relay sits one layer above the layer that was deciding "which model to route to" back then.
This article introduces what NeMo Relay can do, then describes what I was actually able to capture by piggy-backing it onto Claude Code.
What NeMo Relay Does and Doesn't Take On
NeMo Relay is an OSS released by NVIDIA at the end of March 2026, licensed under Apache-2.0, and written in Rust. The stable version is 0.6.0 (2026-07-22). This article was verified with this version.
It was originally called NeMo Flow, and versions 0.1.0 and 0.2.0 were released under that name. It was renamed at 0.3.0, but the repository was carried over as-is, and old URLs redirect to the current NeMo Relay. The reason migration support features from NeMo Flow remain in the documentation traces back to this history.
What struck me about its positioning was the following passage from the documentation:
A framework asks, "What should the agent do next?" NeMo Relay asks, "When the agent does work, which scope owns it, which middleware applies, what events are emitted, and which subscribers can consume the result?"
The division is clear: letting the agent think about "what to do next" is the framework's job, while what Relay takes on is "when work is actually done, who owns it, what gets recorded, and who can receive the results."
What it doesn't take on is also explicitly stated: agent frameworks, model providers, guardrail description systems, and deployment infrastructure. It's written that this is not a replacement for those, and observation backends like Langfuse and Arize Phoenix are also placed "outside of Relay." Relay is on the side that emits events; storing and displaying them is the job of a separate layer.
Division of Roles with Switchyard
Since it's easy to confuse with Switchyard from the same NeMo family, let me sort that out first.
| Aspect | NeMo Switchyard | NeMo Relay |
|---|---|---|
| Question it addresses | Which backend to send to | How to execute and record what was sent |
| Output | Routing decisions and stats | ATOF / ATIF / OpenTelemetry / OpenInference |
| Granularity | Per-request model selection | Each stage of agent, LLM call, and tool execution |
| Connection with Claude Code | As an OpenAI-compatible route | Local gateway + hook |
Since Relay calls Switchyard's Decision API, Relay is hierarchically above. However, Switchyard integration is Experimental and not included in the default build, so I didn't touch it this time.
Only 3 Supported Agents
What surprised me when looking at the compatibility table was how limited the targets are.
| Agent | Minimum Version | Support |
|---|---|---|
| Claude Code | 2.1.121 | ✅ |
| Codex CLI | 0.143.0 | ✅ |
| Hermes Agent | 0.18.2 | ✅ |
| Cursor | — | ❌ |
| opencode | — | ❌ |
| Gemini CLI | — | ❌ |
Cursor was listed in the compatibility table up through the 0.4 series, but disappeared in 0.5. You may come across information saying Cursor is supported, but it's just picking up pages from older versions.
There's also a caveat for Claude Code — only the CLI is supported.
Claude desktop, web, and application sessions are unsupported unless they expose the same local hook and gateway controls.
That means desktop app and web sessions are outside the scope of observation. Similarly for Codex, it's written that "LLM capture is partial or not possible at all for cloud executions that don't go through a local machine." It's best to understand upfront that only what's running locally can be observed.
Distribution platforms include Linux x86_64 and ARM64, macOS Apple Silicon, and Windows x86_64 and ARM64. There are no pre-built binaries for Intel Mac (a workaround using cargo install to build from source is provided). If even one person on a team has an Intel Mac, that person will be excluded from observation.
As a side note, within my research scope, I couldn't find any hands-on articles in Japanese or English. Since information sources are almost entirely limited to official documentation and GitHub, please note that there's currently no reference to cross-check the numbers in this article against.
There Are 4 Telemetry Output Destinations and What You Can Get Differs
Now for the main topic. Relay's observation plugins have 4 output destinations, each projecting the same events into different forms. If you build without understanding these differences, you'll later find that "the numbers I needed aren't there."
First, two are file outputs. ATOF (Agent Trajectory Observability Format) is a raw event stream in JSONL format, one event per line. It retains the usage returned by the provider as-is. ATIF (Agent Trajectory Interchange Format) is one file per agent scope, containing a normalized trajectory.
The remaining two are projections that send via OTLP to external destinations: OpenTelemetry and OpenInference. Both can be sent to the same OTLP endpoint.
The official documentation has a table called "Exporter Field Mapping," which turned out to be the most impactful thing I found in my research.
| Available Data | ATOF | ATIF | OpenTelemetry | OpenInference |
|---|---|---|---|---|
| prompt / completion | ✅ Raw usage | ✅ | ❌ not emitted | ✅ llm.token_count.{prompt,completion} |
| cache read / write | ✅ Separate | 🟡 Aggregated into cached_tokens |
❌ | ✅ prompt_details.{cache_read,cache_write} |
| cost | ✅ | ✅ total_cost_usd (USD only) |
✅ nemo_relay.llm.cost.total (any currency) |
✅ llm.cost.total (USD only) |
| point-in-time mark | ✅ | ❌ Dropped | 🟡 Converted to span | 🟡 Converted to span |
Note that the OpenTelemetry column has zero tokens. It's clearly stated in the documentation:
Token counts are not emitted as discrete attributes.
This is an intentional specification, and the release notes also explicitly state: "OpenTelemetry emits cost only, not token counts." It's also written that this may change in the future.
ATIF has its quirks too. Since cache read and cache write are aggregated into cached_tokens, you'll need ATOF or OpenInference if you want the breakdown. Marks (point events) are also dropped in ATIF, so ATOF is the authoritative source.
In other words, the practical solution is to get cost from OpenTelemetry and token counts from OpenInference. Fortunately, in version 0.6, both can coexist as independent sections.
There's a Full Set of Features Beyond Observation
While observation is the main feature, there are other plugins as well. Since I didn't use them this time, I'll just briefly mention what's available.
PII redaction is a mechanism to obscure personal information before sending. As of version 0.6, only a deterministic local backend is available; model-based detection is reserved for the future. There's also NeMo Guardrails integration, which allows inserting runtime guardrails around managed LLM calls. Writing policies is the job of the upper layer; Relay is the host.
The Adaptive category includes Cache Governor and tool parallelism, which fall under the optimization domain rather than observation. The plugin mechanism itself comes in two types: a native type running in-process, and a type running as a gRPC worker in a separate process.
It's reassuring to have a complete set of extension points, but since this is a 0.x OSS with monthly minor releases, you'd want to be careful about how far to go. This time I limited myself to observation only.
Installing and Piggy-Backing onto Claude Code
Setup is just one command.
curl -fsSL https://raw.githubusercontent.com/NVIDIA/NeMo-Relay/main/install.sh | sh
To pin the version, pass an environment variable. There's one pitfall here: if you put the variable in the wrong position, it won't take effect.
NEMO_RELAY_VERSION=0.6.0 curl -fsSL https://.../install.sh | sh
curl -fsSL https://.../install.sh | NEMO_RELAY_VERSION=0.6.0 sh
The installer is a 258-line shell script that doesn't call sudo and doesn't modify shell configuration files. It downloads a binary from GitHub Releases, verifies the SHA-256 checksum, and if there's a mismatch, it fails without replacing the existing binary. All it does is place a single 31MB executable in $HOME/.local/bin, so I felt comfortable running it.
Choosing Between persistent and ephemeral
There are two ways to integrate with Claude Code. This choice has lasting consequences, so let me lay it out in a table first.
| Aspect | persistent (install claude-code) |
ephemeral (run -- claude) |
|---|---|---|
Modifies ~/.claude/settings.json |
✅ Modifies it | ❌ Doesn't touch it |
| Gateway | Shared fixed 127.0.0.1:47632 |
Dynamic port per launch |
| Per-project configuration | ❌ User scope only | ✅ .nemo-relay/ works |
| Ease of everyday use | ✅ No need to think about it | 🟡 Need to change launch command |
I chose ephemeral. The reason is explained in Wall 2 later, but persistent modifies ~/.claude/settings.json. If you have that settings file set up as a symlink to a dotfiles repository, it will break as-is.
I verified empirically that ephemeral truly doesn't touch anything. Adding --dry-run --print shows only what it intends to do without doing it.
$ nemo-relay run --dry-run --print -- claude
agent = claude
gateway_url = http://127.0.0.1:65412
anthropic_base_url = https://api.anthropic.com
argv = claude --plugin-dir <temporary-claude-plugin-dir> --settings <temporary-claude-settings>
env.NEMO_RELAY_GATEWAY_URL = http://127.0.0.1:65412
env.NEMO_RELAY_TRANSPARENT_RUN = 1
env.ANTHROPIC_BASE_URL = http://127.0.0.1:65412
note = would generate a temporary Claude Code plugin directory
ANTHROPIC_BASE_URL is only passed to the process's environment variables, and the plugin directory and settings file are created in a temporary area. I took the sha256 of ~/.claude/settings.json before and after execution and compared them — the value was unchanged. The symlink remained a symlink.
Verifying the Connection
You can diagnose the configuration with doctor. Here I noticed another thing: doctor has two ways to pass arguments.
nemo-relay doctor claude              # positional argument (claude / codex / hermes)
nemo-relay doctor --plugin claude-code  # flag (codex / claude-code / hermes / all)
It looks like a naming inconsistency, but the values they accept differ (claude vs. claude-code). The positional argument is for diagnosing agents, while --plugin is for diagnosing persistently installed plugins — they're different things. For ephemeral operation, use the former or the full diagnosis with no arguments.
Running it with no arguments outputs a combined view of the configuration file search results and observation plugin validation.
  Observability
    ✓  Plugin validation       validation passed
    ✓  ATOF file sink          sinks[0]: ~/relay-poc/atof (appears writable)
    ✓  ATIF dir                ~/relay-poc/atif (appears writable)
    !  OpenTelemetry endpoint  http://<collection-server>:4318/v1/traces (HTTP 405)
    !  OpenInference endpoint  http://<collection-server>:4318/v1/traces (HTTP 405)
The HTTP 405 for the endpoints appears as a warning, but this is because doctor probes using GET. Since OTLP only accepts POST, it returns 405. The destination itself is reachable, so this warning can be safely ignored.
The configuration file is placed at ~/.config/nemo-relay/plugins.toml. The search order is a bit unusual: system → project → user, with user being the strongest. This is the reverse of typical configuration systems where closer wins, so if you write items you want to vary per project on the user side, they'll get overridden.
Setting Up a Receiver on DGX Spark to View Traces
I set up the OTLP receiver on my local DGX Spark. The three components are OpenTelemetry Collector, Tempo, and Grafana, with a combined memory usage of about 220MB measured in practice. Light enough to run as a background process without concern.
On the Relay side, all you need to do is write the endpoint in plugins.toml. In version 0.6, OpenTelemetry and OpenInference are independent sections, so both can be enabled simultaneously.
[components.config.opentelemetry]
enabled = true
transport = "http_binary"
endpoint = "http://<collection-server>:4318/v1/traces"
service_name = "claude-code"

[components.config.openinference]
enabled = true
transport = "http_binary"
endpoint = "http://<collection-server>:4318/v1/traces"
service_name = "claude-code-openinference"
Both are sent to the same endpoint, but separating service_name lets you filter by it later in TraceQL.
For the Collector and Tempo compose setup, it's almost the same flow as the article I wrote earlier about setting up Langfuse on DGX Spark (article dated 2026-05-02), so I'll defer to that.
After running Claude Code for one turn, traces become visible in Grafana.
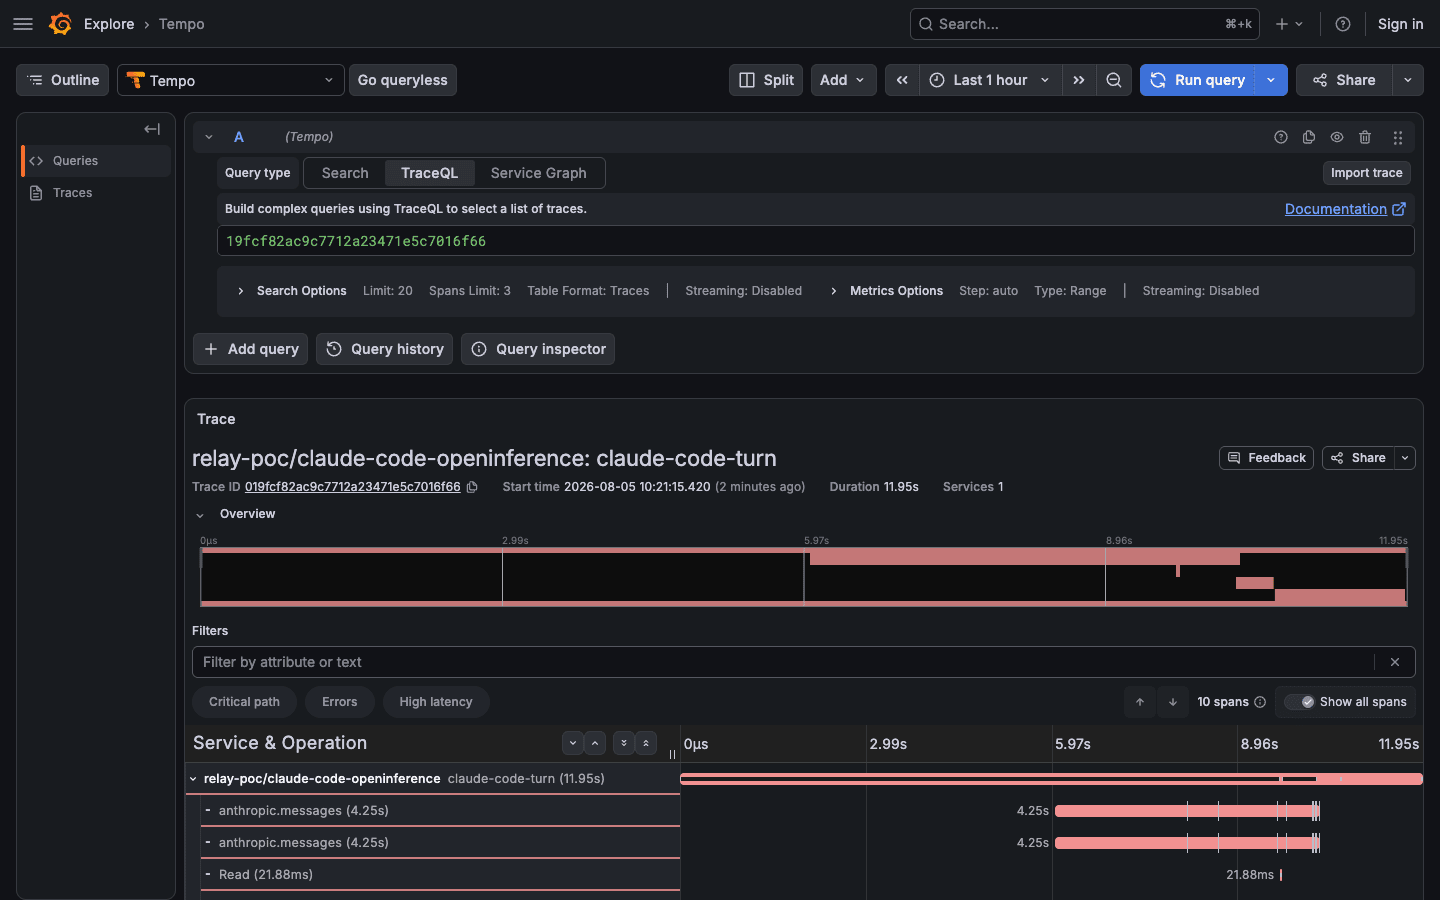
One user turn becomes a single trace called claude-code-turn. Of the 11.95 seconds total, you can see the breakdown: the first LLM call took 4.25 seconds, Read took 21.88ms, and Bash took 367.54ms.
Four types of span names were observed. claude-code-turn becomes the root of the trace, anthropic.messages for LLM calls, and tool executions use the tool name directly as the span name. Point events like session.start appear as zero-length spans named mark:session.start.
The official documentation doesn't have a list of span names, so these are from direct measurement. However, since I haven't yet triggered sub-agents or context compression, there are likely more types.
Note that enabling both OpenTelemetry and OpenInference causes the same trace to have each span appear twice. That's why anthropic.messages and Read appear duplicated in the screenshot above. Since they share the same trace ID, Grafana mixes them into a single tree. You'll need to filter by service.name when reading.
Not a Single Token Comes Out of the OpenTelemetry Projection
Now for the crucial content.
When I listed the attributes stored in Tempo, three cost-related ones were present.
nemo_relay.llm.cost.total = 0.0541685
nemo_relay.llm.cost.currency = USD
llm.cost.total = 0.0541685
As for tokens, those are only available on the OpenInference side.
llm.token_count.prompt                     = 2
llm.token_count.completion                 = 4
llm.token_count.total                      = 6
llm.token_count.prompt_details.cache_read  = 108117
llm.token_count.prompt_details.cache_write = 0
As you can tell from the attribute name prefixes, llm.token_count.* is what the OpenInference projection emits. There are no token counts on the nemo_relay.* side. This was the behavior described in the documentation.
What's interesting here is the nemo_relay.end.data.usage attribute, which contains the raw usage as a complete JSON string.
{
  "cache_creation_input_tokens": 0,
  "cache_read_input_tokens": 108117,
  "input_tokens": 2,
  "output_tokens": 4,
  "output_tokens_details": { "thinking_tokens": 0 }
}
So the information itself is traveling over OTLP. It's just not decomposed into individual attributes. If you want to write conditions like llm.token_count.prompt > 1000 in TraceQL, you'll need to look at the OpenInference side or process the attributes in the Collector.
A single turn of just asking "please answer with ok" resulted in 108,117 cache read tokens. That's because CLAUDE.md, skills, and tool definitions are all loaded into cache. The moment I saw that number, I understood that cache is the main battleground for cost analysis.
There's No Place to Write the Price of cache write
I wrote that cost attributes were coming through, but that was after configuring a pricing table. Before that, the situation was different.
Relay doesn't bundle a pricing table. The documentation also states: "If no configured source exists, all models are treated as unknown." While it prioritizes prices returned in provider responses, Anthropic's usage response has no price field. Even looking at Claude Code session logs, only four types of token counts are included, so for Anthropic connections, it always falls back to estimation from a pricing table.
In practice, before adding a pricing table, counting the attributes in Tempo showed 230, with 0 containing "cost." After adding the pricing table, it went up to 233, with the three mentioned earlier added.
Writing the Pricing Table
The catalog is written in JSON and registered via CLI.
{
  "version": 1,
  "entries": [
    {
      "provider": "anthropic",
      "model_id": "claude-opus-5",
      "currency": "USD",
      "unit": "per_token",
      "rates": {
        "input_per_million": 5.0,
        "output_per_million": 25.0,
        "cache_read_per_million": 0.5
      },
      "prompt_cache": { "read_accounting": "separate" },
      "pricing_as_of": "2026-08-04"
    }
  ]
}
nemo-relay model-pricing validate claude-pricing.json
nemo-relay model-pricing add-source claude-pricing.json --user
nemo-relay model-pricing resolve claude-opus-5 --provider anthropic \
  --prompt-tokens 1000 --completion-tokens 500
resolve returned estimated_total = 0.0175. $0.005 for 1,000 input tokens and $0.0125 for 500 output tokens. The calculation checks out.
You may have noticed that only 3 values can be written in rates: input, output, and cache read. There's no place to write the unit price for cache write.
It's not that Relay is unaware of cache write. Reading the codec documentation, it says Usage.cache_write_tokens is correctly mapped from Anthropic's cache_creation_input_tokens, and the cost structure also has a cache_write category. So it holds the token count, but there's simply no path to provide the price.
What's worse, even if you add a cache_write_per_million key on your own, validation passes.
$ nemo-relay model-pricing validate test.json
Valid model pricing catalog: test.json (2 entries)
It's silently ignored without any error or warning. The problem is that you can end up thinking it worked.
Measuring What Happens
I ran the same prompt twice with different cache states.
First, a turn where cache was hit:
Raw usage  : cache_creation 0 / cache_read 108,117 / input 2 / output 4
ATIF       : total_cost_usd 0.0541685
Cross-checking: 2×$5/M + 4×$25/M + 108,117×$0.50/M = 0.0541685. Exact match. Cache reads are correctly accounted for.
Next, a turn where cache write occurred. I ran it in a different directory with a different prompt.
Raw usage  : cache_creation 59,017 / cache_read 0 / input 2 / output 4
ATIF       : total_cached_tokens 59,017 / total_cost_usd 0.00011
0.00011 is the amount for just 2 input tokens and 4 output tokens. The 59,017 tokens of cache write are completely absent from the cost figure. Even though the token count is in total_cached_tokens, it's not reflected in the price.
According to Anthropic's pricing, cache write with 1-hour TTL is double the input unit price. Claude Code uses 1-hour TTL (it remains as ephemeral_1h_input_tokens in the raw usage). Since Opus 5's input unit price is $5/M, at $10/M the true amount would be about $0.59.
| Turn | Cost Relay reported | Expected equivalent | Difference |
|---|---|---|---|
| Turn with cache read | $0.0541685 | $0.0541685 | Exact |
| Turn with cache write | $0.00011 | $0.5903 | 5,366x |
The figure of 5,366x is impactful, but this is just one turn where only cache write occurred, so it doesn't directly translate to monthly costs. To get a practical sense, let me cross-reference with my actual measurements.
Aggregating a fully active month in June 2026 using ccusage, there were 79.77 million cache write tokens. At Opus 5's unit price, that's equivalent to $798. The total for that same month was $3,008, meaning over 20% would be missing from cost aggregation. It's not an order-of-magnitude difference, but it's not negligible either.
Trying to track costs for cache-heavy agents with Relay alone seems challenging at this point. Since token counts are captured accurately, the practical approach would be to calculate costs yourself.
Prompt Content Reaches the Center by Default
One more thing that directly affects your adoption decision.
When sending observation data from your local machine to an external destination, I had assumed "prompt content and code content would not be sent." Having the content of work flow out exceeds the purpose of observation.
When I checked what was actually flowing, it was being sent by default.
nemo_relay.start.data.prompt = Reply with exactly: ok
input.value                  = user: <system-reminder> As you answer the user's ...
output.value                 = ok
llm.input_messages.0.message.content = ...
The sent prompt, the entire conversation including system reminders, and the response content are all included as span attributes.
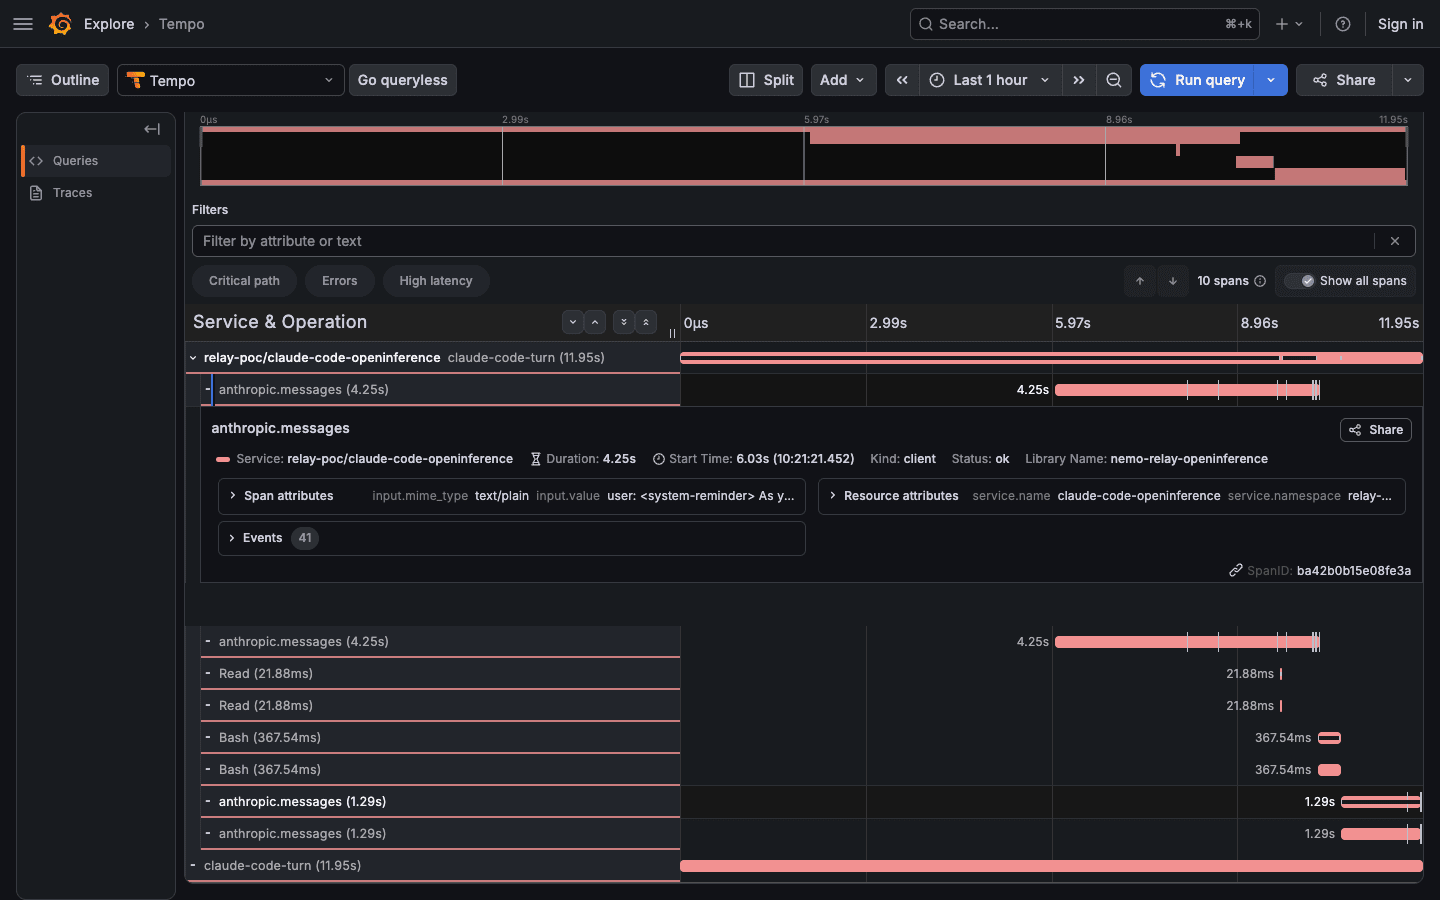
Expanding a span shows user: <system-reminder> As y… in input.value, revealing the conversation content. The service.name on the Resource attributes side is claude-code-openinference.
Furthermore, tool definition JSON schemas from llm.tools.0 through llm.tools.116 — 117 tool definitions — were loaded as attributes. The main reason ATIF files reach 1.25MB per turn is this.
To configure it so content is not sent, you explicitly set sanitizers or PII redaction. This is not "safe by default," so you'll want to verify before distributing to your team. It doesn't matter when running in just your own environment, but the situation changes if other people's screen contents start flowing into your Grafana.
Walls I Hit Before Getting It to Work
While I said setup takes just one command, I hit three walls before getting there. Since any of them could occur in readers' environments, I'll keep the details in a collapsible section.
The 3 Walls
Wall 1: Version pinning didn't work and version 0.7 almost got installed
Because I had placed NEMO_RELAY_VERSION before curl, the variable was only passed to the curl process, and it tried to install the latest version. You need to pass it to the right side of the pipe.
curl -fsSL https://.../install.sh | NEMO_RELAY_VERSION=0.6.0 sh
Since the installer is fetched from the main branch, even if you switch the documentation to version 0.6.0 to read it, without pinning you'll get the latest stable version. The 0.7 series has changed configuration file formats, so it's incompatible with the steps in this article.
Wall 2: settings.json got replaced with a real file
This was the most troublesome one. When I tried persistent installation in a sacrificial home directory, nemo-relay install claude-code writes three keys to ~/.claude/settings.json.
{
  "env": { "ANTHROPIC_BASE_URL": "http://127.0.0.1:47632" },
  "enabledPlugins": { "nemo-relay-plugin@nemo-relay-local": true },
  "extraKnownMarketplaces": { "nemo-relay-local": { "source": { "path": "...", "source": "directory" } } }
}
It merges without breaking existing settings. Hooks were also left intact. The problem starts here: if this settings file is a symlink to dotfiles, the symlink gets replaced with a real file.
Before install:  lrwxr-xr-x  .claude/settings.json -> dotfiles/settings.json
After install:   -rw-r--r--  .claude/settings.json
The cause is that there are two separate writers. claude plugin marketplace add and plugin install (Claude Code itself) follow the symlink and write to the target. Then when Relay itself adds ANTHROPIC_BASE_URL via a temp-file-based replacement, the symlink itself gets removed.
uninstall does not restore the symlink. The two entries nemo-relay-plugin and nemo-relay-local written to the dotfiles side also remain. If you're managing dotfiles with git and distributing them to multiple machines, committing will propagate to those other machines too.
A backup was created at ~/.claude/settings.json.nemo-relay.bak (the location is not documented). However, looking at the contents, it saves the state after plugin registration is already complete. Since it's a backup from "just before adding the provider route," it can't fully restore the original state.
This is what led me to switch to ephemeral operation.
Wall 3: doctor lists errors but there is no problem
With ephemeral operation, plugin diagnostics will fail across the board.
Install state: failed (missing or invalid state at .../claude-code.json)
Host registration: failed (plugin or marketplace registration is incomplete)
claude provider routing: failed (not configured)
installer error: Claude Code plugin doctor checks failed; remediation: nemo-relay install claude-code --force
--plugin claude-code is a diagnostic that assumes a persistent installation, so it will naturally show failed if you haven't done one. The last line recommends running install --force, but executing it here will bring you back to Wall 2. When operating in ephemeral mode, the correct approach is to use nemo-relay doctor without arguments.
Things I'm curious about
After trying everything out, I'll also summarize the points that caught my attention at this stage.
The biggest one is the observation scope. As noted in the official Known Issues, Relay can only capture local hooks and traffic that passes through the gateway — it cannot capture remote or cloud executions. Claude Code sessions outside the CLI are also out of scope. This becomes significant when you want to fully understand how it's being used. The lack of pre-built binaries for Intel Mac falls into the same category.
The version pace is also fast. The stable version is 0.6.0, but 0.7.0 RCs are coming out almost daily (while writing this article, it progressed from rc.4 to rc.6). In 0.7, the observation plugin configuration moves from version 2 to version 3, and it's explicitly stated that "the shape of the OTLP section in version 2 will be rejected in version 3." Config files written today won't work as-is once 0.7 goes GA. The transition from 0.5 to 0.6 apparently required migration across 5 areas as well, so putting configurations under configuration management seems likely to mean dealing with this every month.
Finally, let me also touch on the confidence level of the numbers in this article. I only validated on my own single machine and a few dozen turns' worth of sessions. I haven't run long sessions involving sub-agents or context compression, so there should be more span types than I've seen. I also couldn't validate the path through which providers return monetary amounts. Since Anthropic doesn't return them, this setup will always fall back to estimation from the price list.
Summary
I had NeMo Relay piggyback on Claude Code to see what could be observed.
Just routing through one local gateway captures the entire agent lifecycle. It was genuinely convenient to have traces per turn and see both tool calls and LLM calls in a hierarchy. Being able to keep everything local without sending data to an external SaaS is also a relief when thinking about internal use.
On the other hand, you need to know upfront that what you can capture differs depending on the output path. Token counts don't come through OpenTelemetry, and cache write amounts are missing from costs. Prompt text flows through by default. With those caveats in mind, if you're planning to use OpenInference and ATIF together, I think it's well within practical range.
I only tried Claude Code this time, but Codex CLI and Hermes Agent are also among the supported agents. With persistent installation they share the same gateway by design, so I'm curious about what it looks like when observing multiple agents together. When 0.7 goes GA, the configuration migration will also be needed, so I'll revisit it at that point.
Reference Links
- NVIDIA/NeMo-Relay — Apache-2.0, Rust implementation
- Ecosystem — Overview of what it handles and what it doesn't
- Support Matrix — List of supported agents and platforms
- Provider Response Codecs and Model Pricing — Exporter Field Mapping is here
- Model Pricing — Price list catalog schema
- OpenTelemetry exporter — Configuration reference for the 0.6 series
- Release Notes — Breaking changes in 0.7 and Known Issues
- Prompt caching — Cache write unit price multiplier (Anthropic)