
How to check the amount (size) of data ingested into a CloudWatch Logs log group at a specific point in time

Issue I was facing
I want to check the amount of data ingested into CloudWatch Logs log groups at a specific time. Could you please tell me how to check this?
How can I check it?
Please check the IncomingBytes CloudWatch metric.
The IncomingBytes metric records the volume (uncompressed bytes) of log events uploaded to CloudWatch Logs log groups.
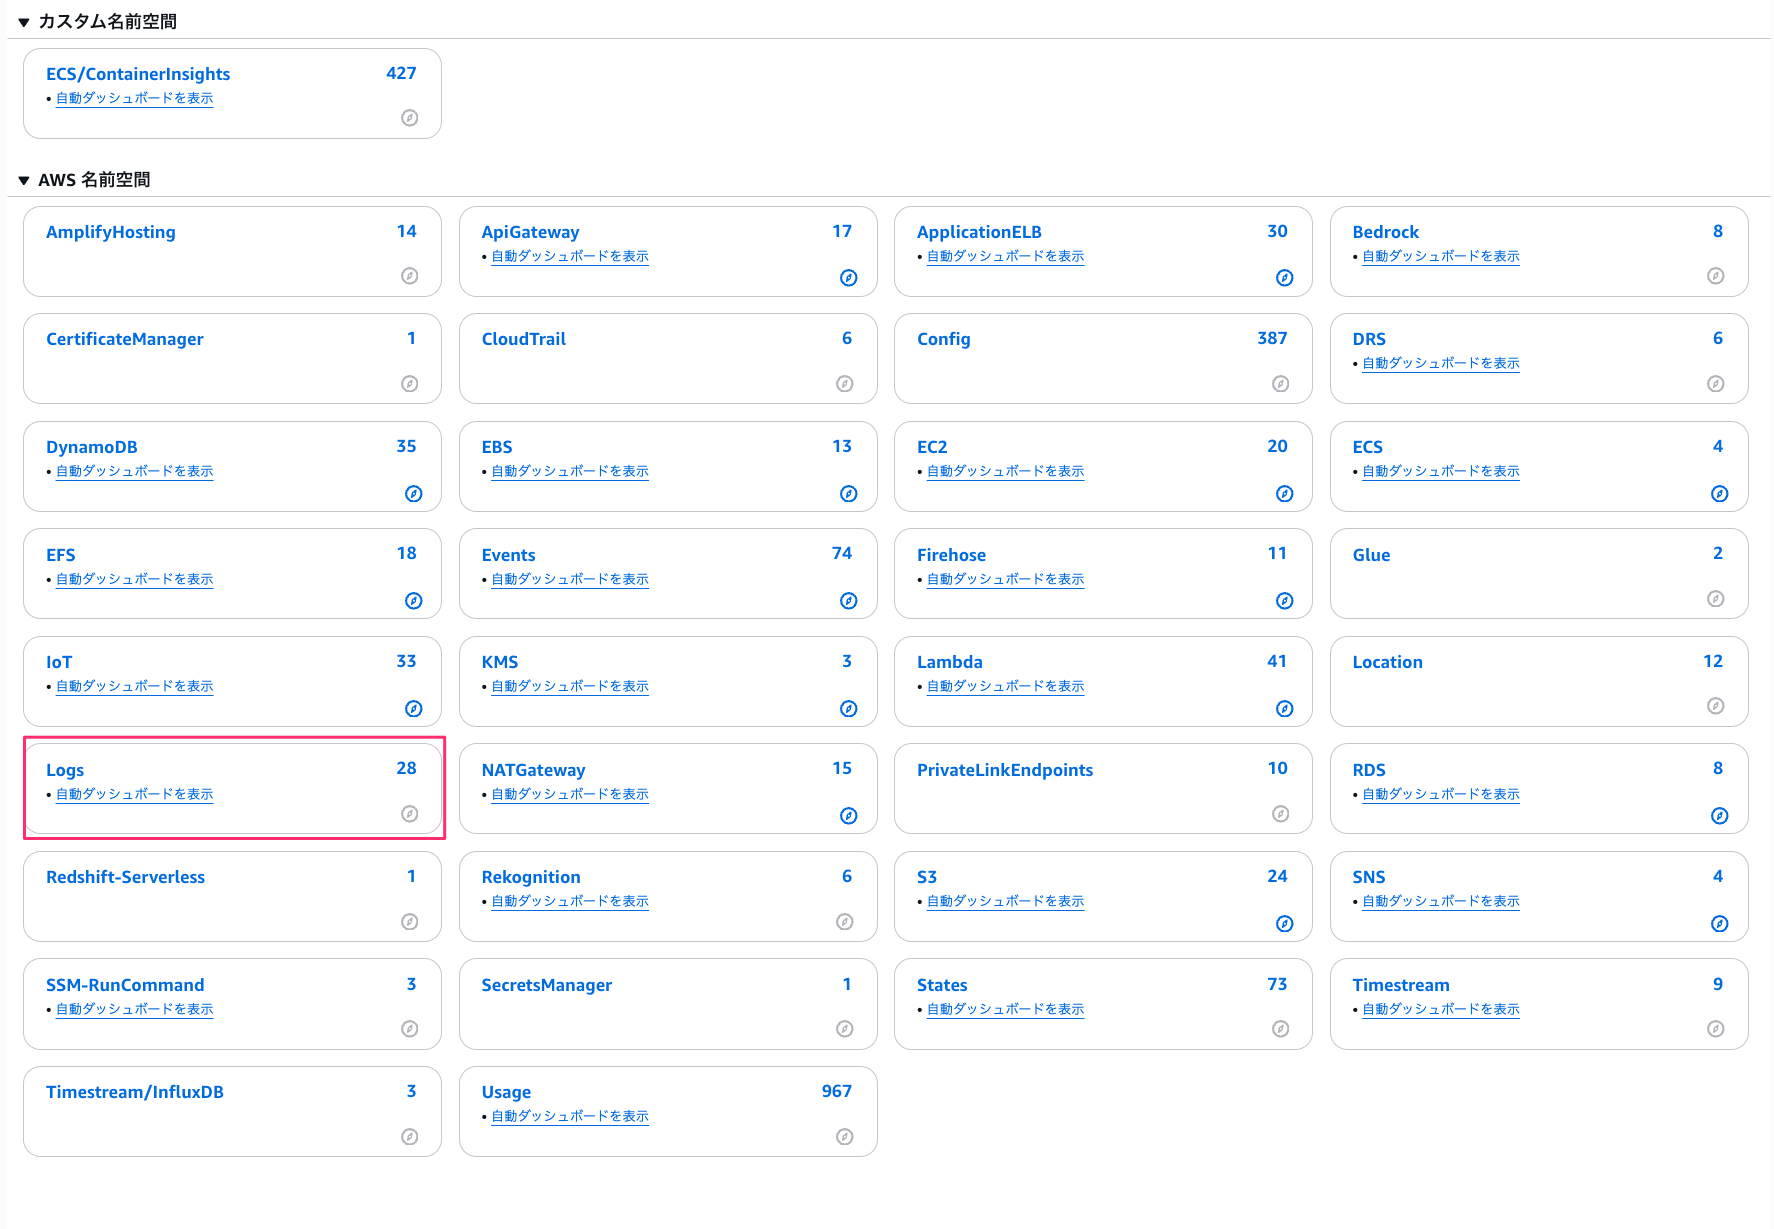
You can check this by selecting AWS/Logs from CloudWatch metrics and then selecting the relevant log group as follows:
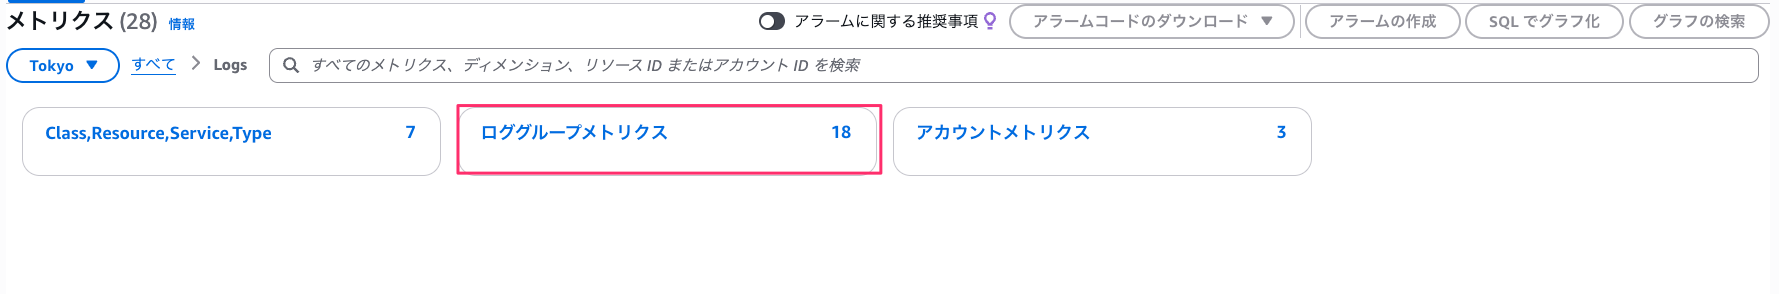
Select the IncomingBytes metric for the CloudWatch Logs log group you want to check.
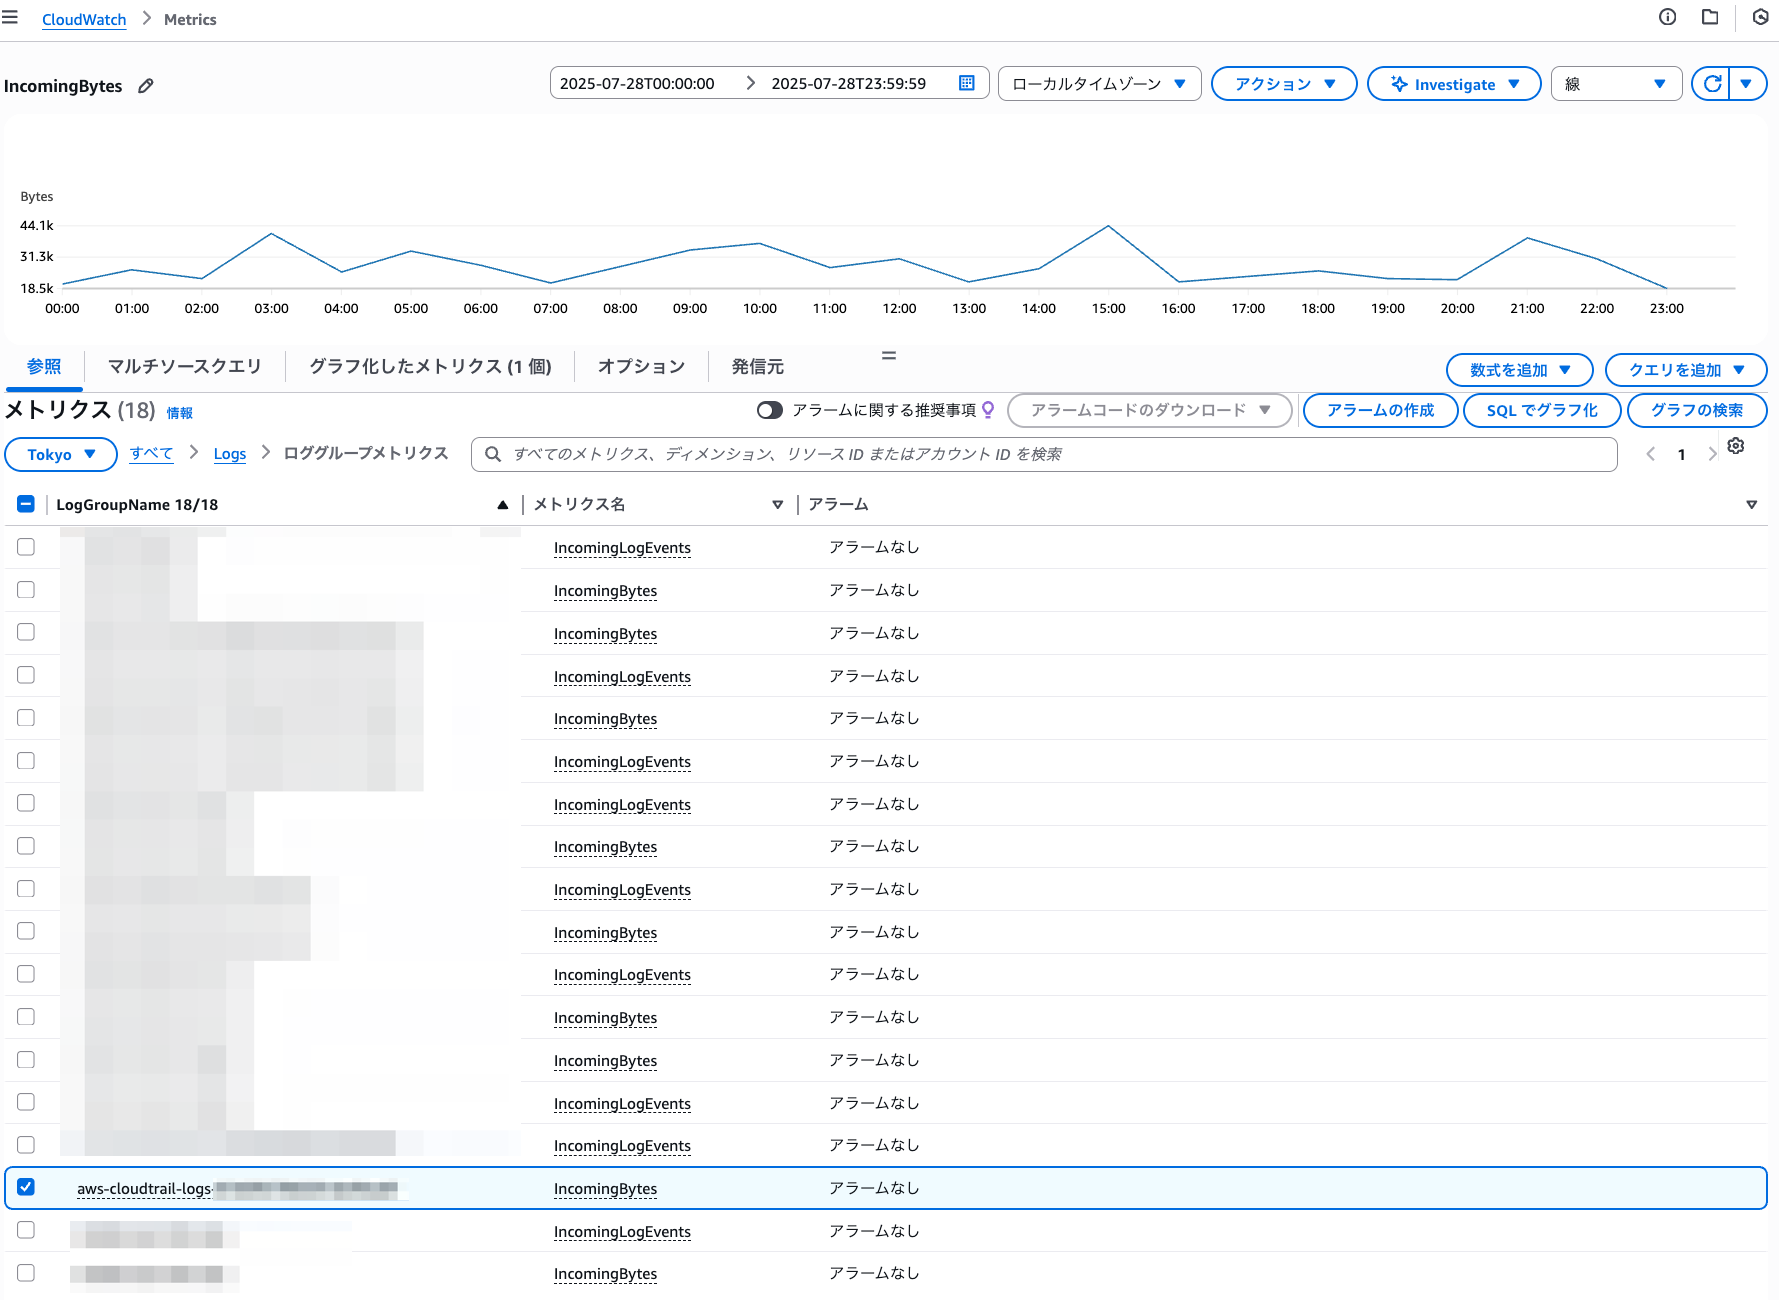
Next, select the date/time range you want to check, set the statistic to "Sum," and choose the desired "Period."

References
Monitoring with CloudWatch Metrics
IncomingBytes
The volume of log events uploaded to CloudWatch Logs (uncompressed bytes). When used with the LogGroupName dimension, this is the volume of log events uploaded to the log group (uncompressed bytes).
Valid dimension: LogGroupName
Valid statistics: Sum
Unit: Bytes
How do I check the size of a log group in Amazon CloudWatch?
Which log group is causing my CloudWatch Logs billing to increase suddenly?
The IncomingBytes metric shows the amount of data ingested into CloudWatch log groups in near real-time.
This metric helps you determine:
- Which log groups are contributing most to your bill
- Whether there's a sudden spike in incoming data to a log group or a gradual increase due to a new application
- The amount of data pushed during a specific period


![[新リージョン] ニュージーランドリージョンがローンチされました](https://images.ctfassets.net/ct0aopd36mqt/wp-thumbnail-cd6bca3e0ea12bce10d34b5c73117202/e7dcb00f209227795370c8effc01051d/aws-eyecatch.png)
