![[Amazon FSx for NetApp ONTAP] Tried delivering audit logs of administrative activities to CloudWatch Logs using a Syslog VPC endpoint](https://images.ctfassets.net/ct0aopd36mqt/wp-thumbnail-9e9d102dfa6d7896319b16fe069cdf55/c3bbbeab42ba5764c5a573e979719805/amazon-fsx-for-netapp-ontap?w=3840&fm=webp)
[Amazon FSx for NetApp ONTAP] Tried delivering audit logs of administrative activities to CloudWatch Logs using a Syslog VPC endpoint
This page has been translated by machine translation. View original
I Want to Store Audit Logs of Management Activities for a Long Period Without Setting Up a Dedicated Syslog Server
Hello, I'm Nonpi (@non____97).
Have you ever wanted to store audit logs of management activities for Amazon FSx for NetApp ONTAP (hereinafter FSxN) for a long period without setting up a dedicated Syslog server? I have.
The management activity audit logs for FSxN (hereinafter simply "audit logs") are retained for a maximum of 48 days or 4,800MB, whichever comes first. This is because the audit log rotation conditions are either once per day or when the size exceeds 100MB, with 48 generations being retained.
Since outputting more than 100MB of logs per day would require something very unusual, it's generally best to think of it as 48 days' worth.
However, there are cases where 48 days is insufficient depending on an organization's audit log retention policy. There may be cases where logs must be reliably retained for six months or more than a month.
In such cases, you would want to deliver audit logs to CloudWatch Logs or an S3 bucket. However, as introduced in the article below, it is not possible to deliver directly from FSxN to these services.
As a workaround, you can build a Syslog server, deliver logs to it, and then forward them from the Syslog server to CloudWatch Logs or an S3 bucket.
At this point, one of FSxN's constraints is that the Syslog forwarding destination must exist in the same subnet as the FSxN file system's subnet. This essentially means setting up a Syslog server dedicated to the FSxN file system.
We already don't want to maintain EC2 instances in the first place. Availability is also a concern. If the Syslog server goes down due to an AZ failure, logs cannot be output during that time. As a countermeasure, even if you try to set up a Syslog server in Multi-AZ, you need to devise a way to operate it as an Active/Standby HA cluster, otherwise logs will be delivered twice during normal operation. This reduces the operability of logs. It's also concerning that the cost of log delivery and storage would double.
This way, there's too much to think about just to output logs.
This time, with an update, CloudWatch Logs now supports ingestion via Syslog.
This will resolve all the previous pain points at once. Let me actually try it out.
Summary Up Front
- It has become easy to deliver FSxN management activity audit logs to CloudWatch Logs
- Since log streams are created per VPC endpoint, if you don't create a VPC endpoint for each use case, various logs will be mixed together
- Since EMS events can now also be delivered via Syslog, it has become possible to understand ONTAP internal events that were previously unrecognizable from the AWS side and leverage them in operations
Tried It Out
Verification Environment
The verification environment is as follows.
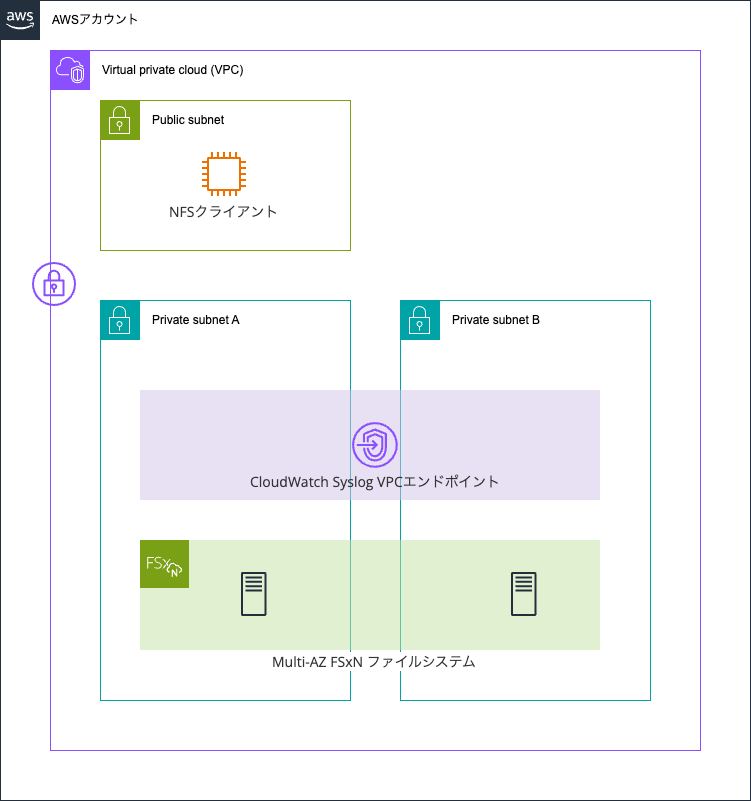
A Multi-AZ FSxN file system is running. The VPC endpoint for Syslog CloudWatch Logs is operating in the same subnet as the FSxN file system.
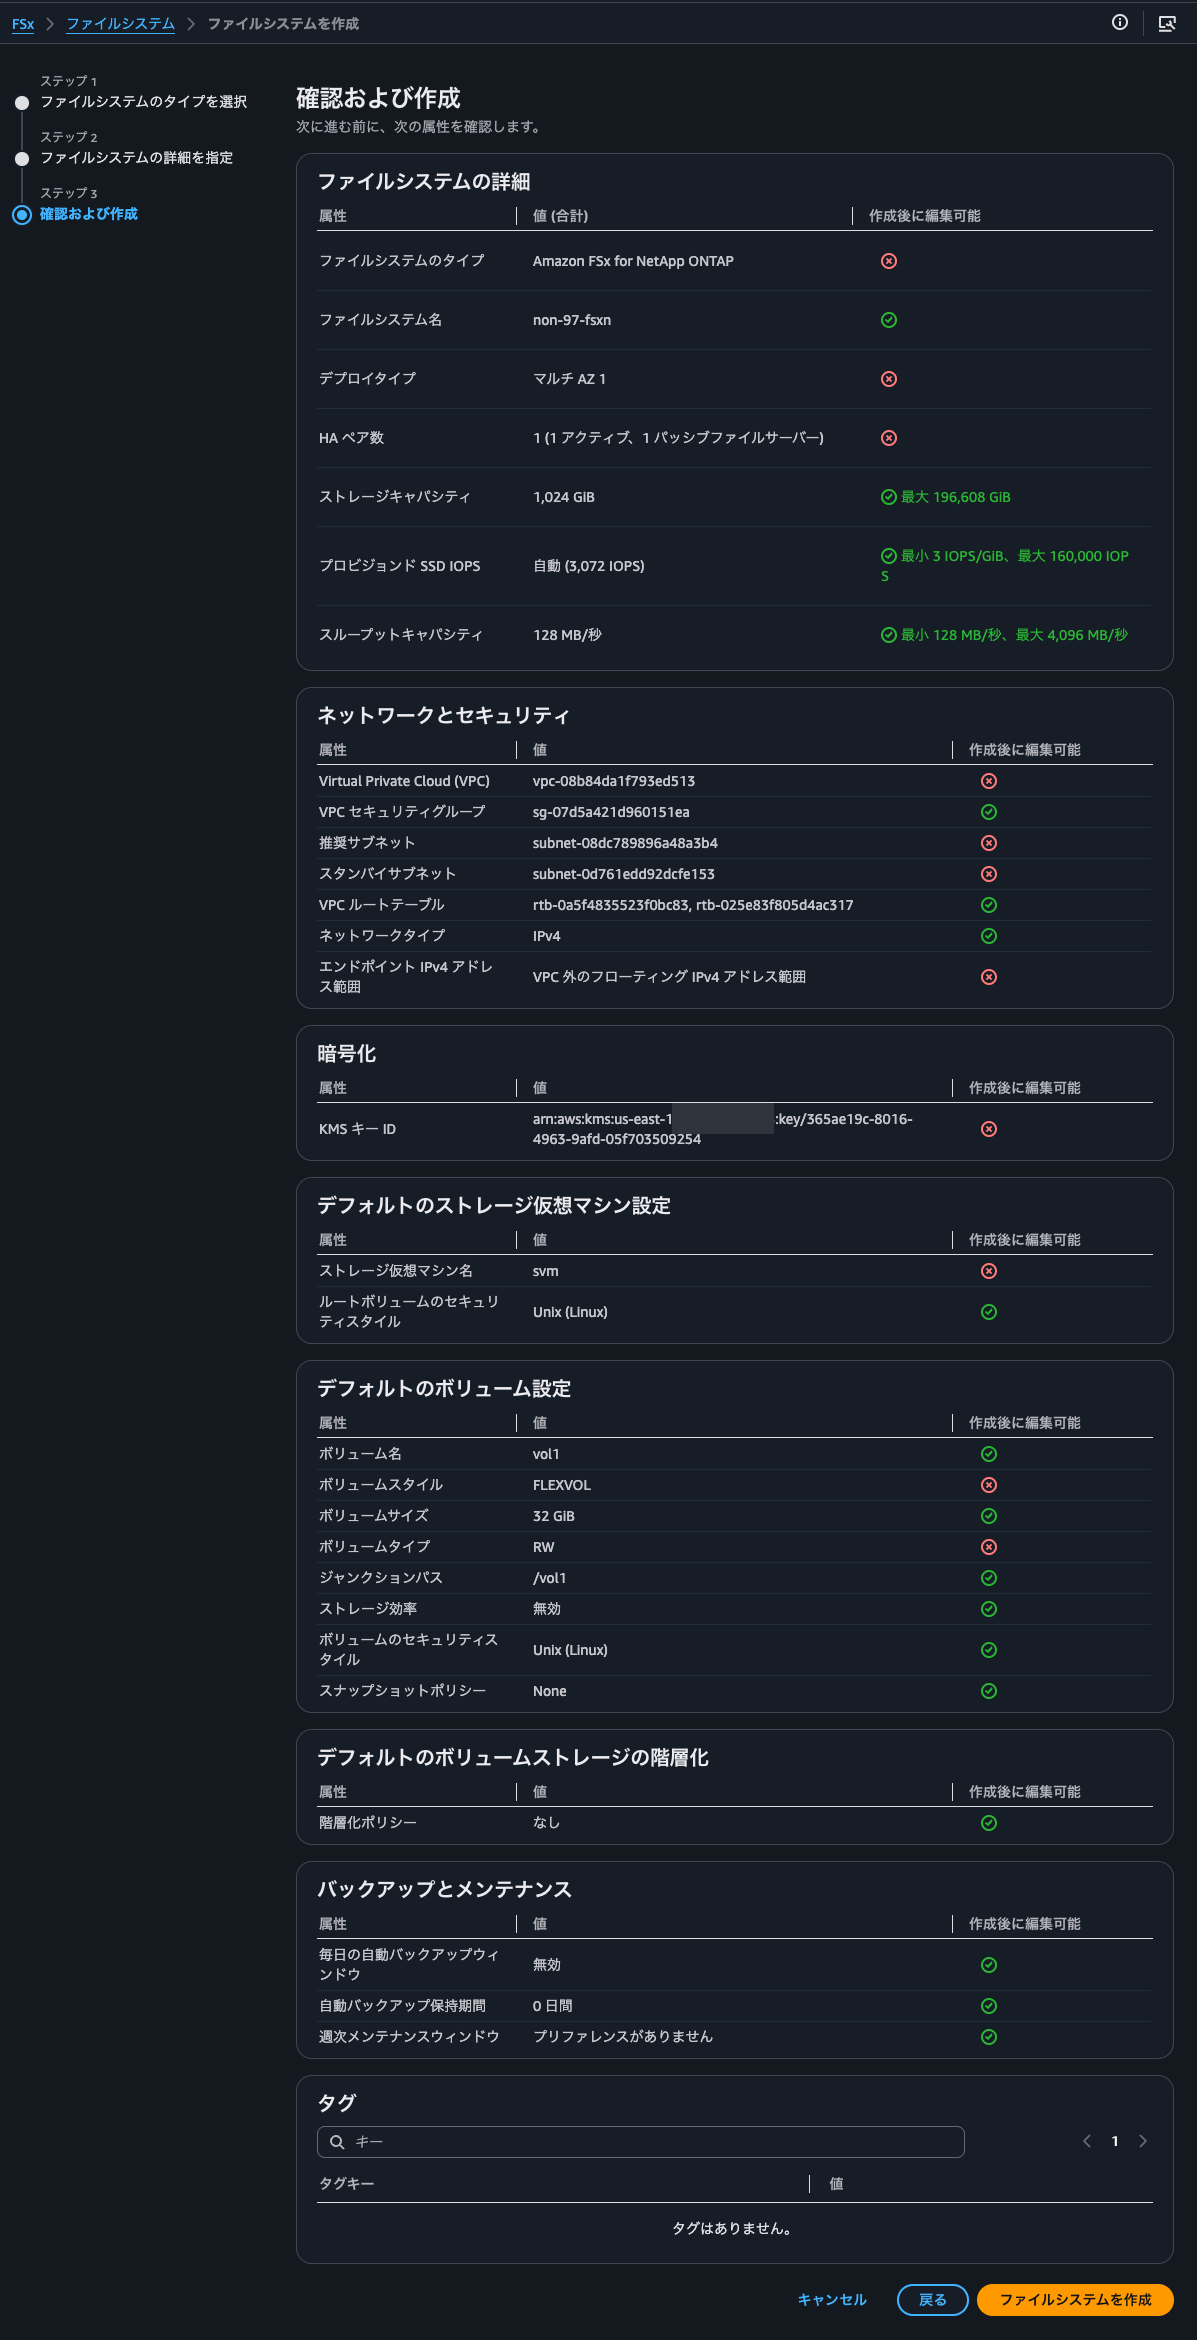
The FSxN file system was created as follows.
Creating a Security Group
Let's create a security group before creating the VPC endpoint.
The CloudWatch Logs Syslog ingestion feature supports the following protocols/ports.
| Protocol | Port | Notes |
|---|---|---|
| TCP + TLS | 6514 | Encrypted in transit. Recommended for compliance requirements. |
| TCP plaintext | 1514 | Plaintext over AWS PrivateLink (network-isolated). |
| UDP | 514 | Best-effort delivery. |
Excerpt: Syslog ingestion - Amazon CloudWatch Logs
On the ONTAP side, all of these are supported.
[-protocol {udp-unencrypted|tcp-unencrypted|tcp-encrypted}] - Log Forwarding Protocol
The protocols are used for sending messages to the destination. The protocols can be one of the following values:udp-unencrypted - User Datagram Protocol with no security
tcp-unencrypted - Transmission Control Protocol with no security
tcp-encrypted - Transmission Control Protocol with Transport Layer Security (TLS)
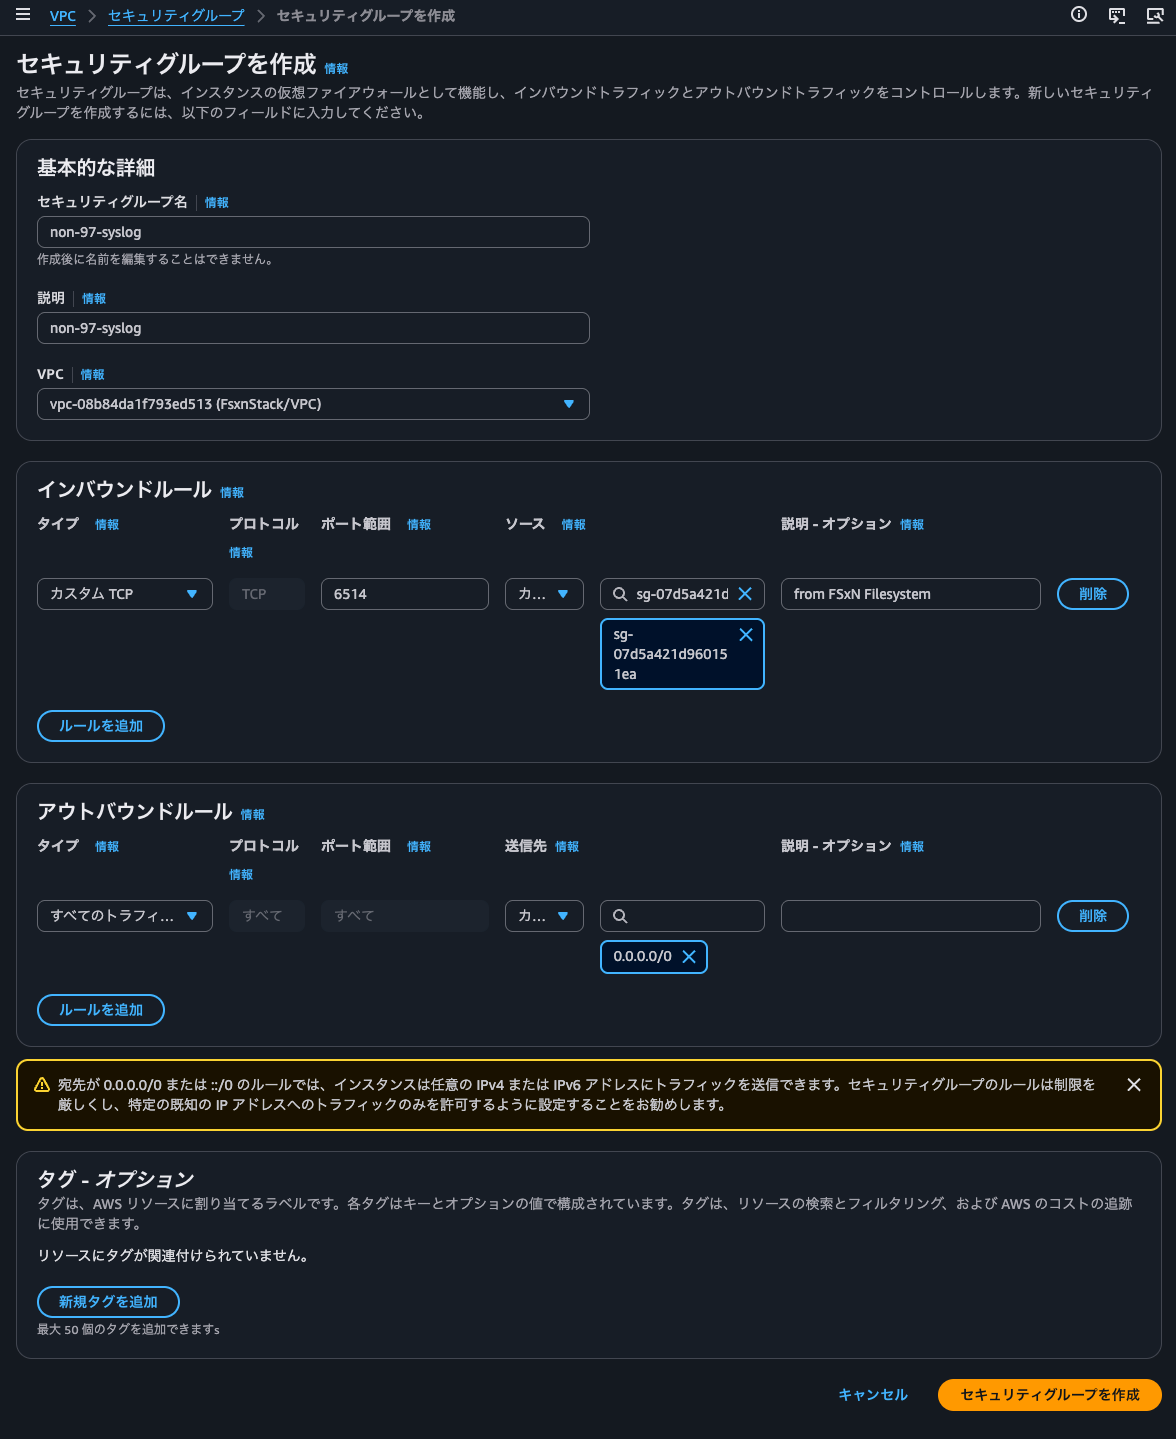
Wanting reliable delivery and considering that log volume is not that high, I judged that the impact would be minimal even with TCP, so I chose TCP/6514 this time.
In the security group attached to the VPC endpoint, we allow TCP/6514 traffic from the security group attached to the FSxN file system.
Creating a VPC Endpoint
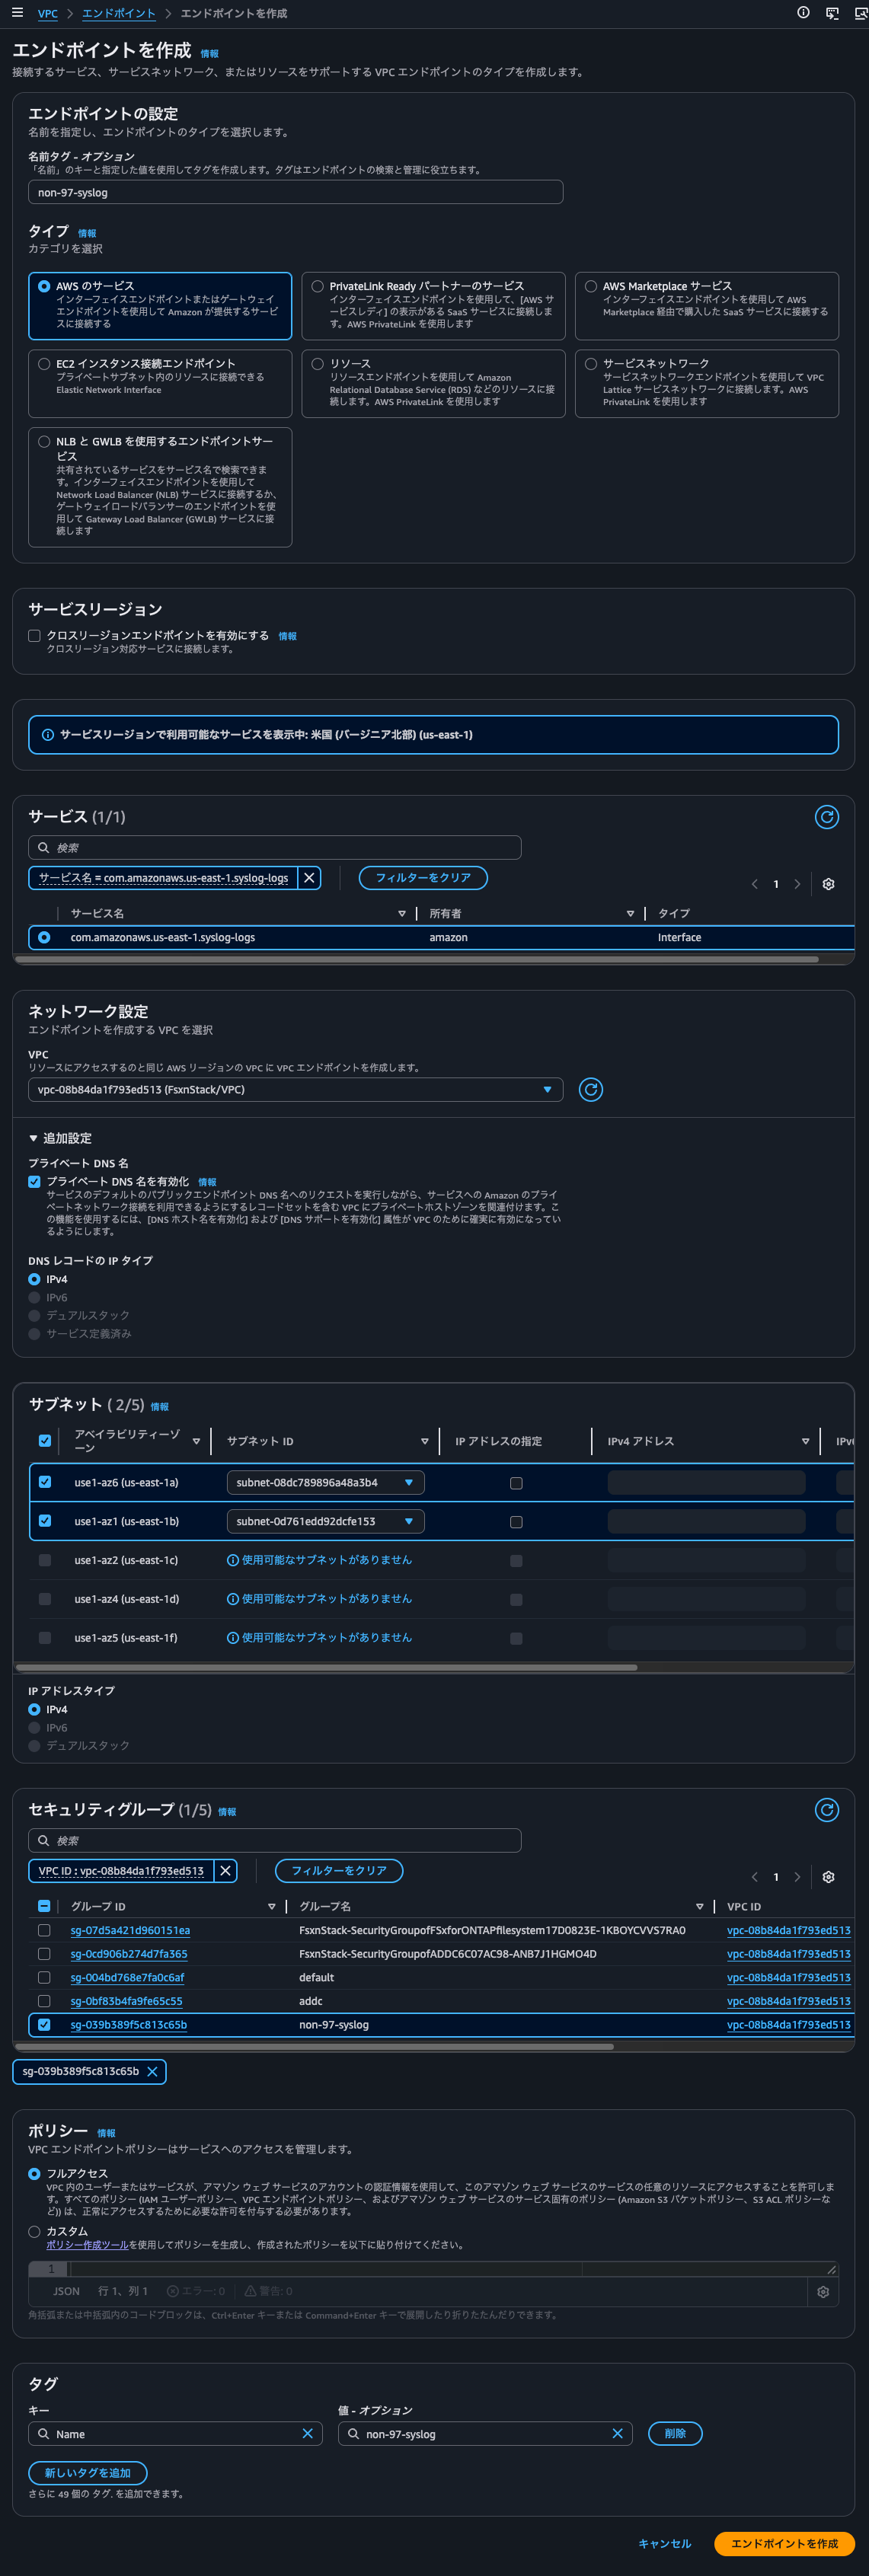
We will create a VPC endpoint.
syslog-logs.us-east-1.amazonaws.com is different from the regular CloudWatch Logs VPC endpoint service endpoint. We will create this in the same subnet as the FSxN file system.
Creation was completed in a few minutes.
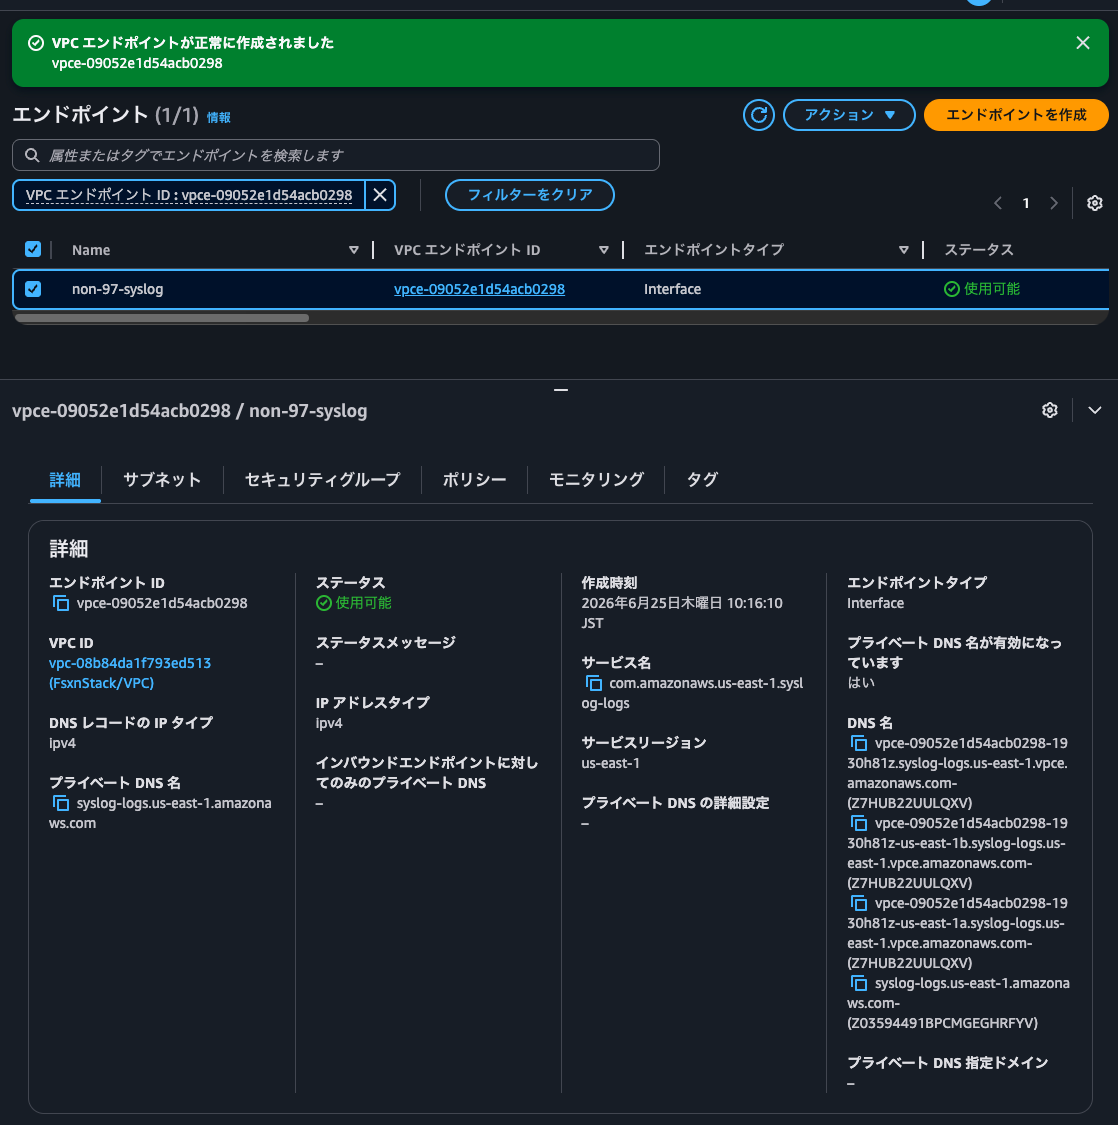
Let's try to resolve each DNS name.
First, from an EC2 instance within the VPC.
$ dig vpce-09052e1d54acb0298-1930h81z.syslog-logs.us-east-1.vpce.amazonaws.com

; <<>> DiG 9.18.33 <<>> vpce-09052e1d54acb0298-1930h81z.syslog-logs.us-east-1.vpce.amazonaws.com
;; global options: +cmd
;; Got answer:
;; ->>HEADER<<- opcode: QUERY, status: NOERROR, id: 62189
;; flags: qr rd ra; QUERY: 1, ANSWER: 2, AUTHORITY: 0, ADDITIONAL: 1

;; OPT PSEUDOSECTION:
; EDNS: version: 0, flags:; udp: 4096
;; QUESTION SECTION:
;vpce-09052e1d54acb0298-1930h81z.syslog-logs.us-east-1.vpce.amazonaws.com. IN A

;; ANSWER SECTION:
vpce-09052e1d54acb0298-1930h81z.syslog-logs.us-east-1.vpce.amazonaws.com. 60 IN A 10.0.1.226
vpce-09052e1d54acb0298-1930h81z.syslog-logs.us-east-1.vpce.amazonaws.com. 60 IN A 10.0.1.105

;; Query time: 0 msec
;; SERVER: 10.0.1.2#53(10.0.1.2) (UDP)
;; WHEN: Thu Jun 25 01:18:27 UTC 2026
;; MSG SIZE  rcvd: 133

$ dig vpce-09052e1d54acb0298-1930h81z-us-east-1b.syslog-logs.us-east-1.vpce.amazonaws.com

; <<>> DiG 9.18.33 <<>> vpce-09052e1d54acb0298-1930h81z-us-east-1b.syslog-logs.us-east-1.vpce.amazonaws.com
;; global options: +cmd
;; Got answer:
;; ->>HEADER<<- opcode: QUERY, status: NOERROR, id: 37740
;; flags: qr rd ra; QUERY: 1, ANSWER: 1, AUTHORITY: 0, ADDITIONAL: 1

;; OPT PSEUDOSECTION:
; EDNS: version: 0, flags:; udp: 4096
;; QUESTION SECTION:
;vpce-09052e1d54acb0298-1930h81z-us-east-1b.syslog-logs.us-east-1.vpce.amazonaws.com. IN        A

;; ANSWER SECTION:
vpce-09052e1d54acb0298-1930h81z-us-east-1b.syslog-logs.us-east-1.vpce.amazonaws.com. 60 IN A 10.0.1.226

;; Query time: 10 msec
;; SERVER: 10.0.1.2#53(10.0.1.2) (UDP)
;; WHEN: Thu Jun 25 01:18:35 UTC 2026
;; MSG SIZE  rcvd: 128

$ dig vpce-09052e1d54acb0298-1930h81z-us-east-1a.syslog-logs.us-east-1.vpce.amazonaws.com

; <<>> DiG 9.18.33 <<>> vpce-09052e1d54acb0298-1930h81z-us-east-1a.syslog-logs.us-east-1.vpce.amazonaws.com
;; global options: +cmd
;; Got answer:
;; ->>HEADER<<- opcode: QUERY, status: NOERROR, id: 801
;; flags: qr rd ra; QUERY: 1, ANSWER: 1, AUTHORITY: 0, ADDITIONAL: 1

;; OPT PSEUDOSECTION:
; EDNS: version: 0, flags:; udp: 4096
;; QUESTION SECTION:
;vpce-09052e1d54acb0298-1930h81z-us-east-1a.syslog-logs.us-east-1.vpce.amazonaws.com. IN        A

;; ANSWER SECTION:
vpce-09052e1d54acb0298-1930h81z-us-east-1a.syslog-logs.us-east-1.vpce.amazonaws.com. 60 IN A 10.0.1.105

;; Query time: 0 msec
;; SERVER: 10.0.1.2#53(10.0.1.2) (UDP)
;; WHEN: Thu Jun 25 01:18:41 UTC 2026
;; MSG SIZE  rcvd: 128

$ dig syslog-logs.us-east-1.amazonaws.com

; <<>> DiG 9.18.33 <<>> syslog-logs.us-east-1.amazonaws.com
;; global options: +cmd
;; Got answer:
;; ->>HEADER<<- opcode: QUERY, status: NOERROR, id: 44540
;; flags: qr rd ra; QUERY: 1, ANSWER: 2, AUTHORITY: 0, ADDITIONAL: 1

;; OPT PSEUDOSECTION:
; EDNS: version: 0, flags:; udp: 4096
;; QUESTION SECTION:
;syslog-logs.us-east-1.amazonaws.com. IN        A

;; ANSWER SECTION:
syslog-logs.us-east-1.amazonaws.com. 60 IN A    10.0.1.105
syslog-logs.us-east-1.amazonaws.com. 60 IN A    10.0.1.226

;; Query time: 10 msec
;; SERVER: 10.0.1.2#53(10.0.1.2) (UDP)
;; WHEN: Thu Jun 25 01:18:46 UTC 2026
;; MSG SIZE  rcvd: 96
All names resolved successfully.
Let's also resolve the names from the local client PC.
> dig vpce-09052e1d54acb0298-1930h81z.syslog-logs.us-east-1.vpce.amazonaws.com

; <<>> DiG 9.10.6 <<>> vpce-09052e1d54acb0298-1930h81z.syslog-logs.us-east-1.vpce.amazonaws.com
;; global options: +cmd
;; Got answer:
;; ->>HEADER<<- opcode: QUERY, status: NOERROR, id: 60682
;; flags: qr rd ra; QUERY: 1, ANSWER: 2, AUTHORITY: 0, ADDITIONAL: 1

;; OPT PSEUDOSECTION:
; EDNS: version: 0, flags:; udp: 4096
;; QUESTION SECTION:
;vpce-09052e1d54acb0298-1930h81z.syslog-logs.us-east-1.vpce.amazonaws.com. IN A

;; ANSWER SECTION:
vpce-09052e1d54acb0298-1930h81z.syslog-logs.us-east-1.vpce.amazonaws.com. 60 IN A 10.0.1.105
vpce-09052e1d54acb0298-1930h81z.syslog-logs.us-east-1.vpce.amazonaws.com. 60 IN A 10.0.1.226

;; Query time: 26 msec
;; SERVER: 127.0.2.2#53(127.0.2.2)
;; WHEN: Thu Jun 25 10:20:25 JST 2026
;; MSG SIZE  rcvd: 205

> dig vpce-09052e1d54acb0298-1930h81z-us-east-1b.syslog-logs.us-east-1.vpce.amazonaws.com

; <<>> DiG 9.10.6 <<>> vpce-09052e1d54acb0298-1930h81z-us-east-1b.syslog-logs.us-east-1.vpce.amazonaws.com
;; global options: +cmd
;; Got answer:
;; ->>HEADER<<- opcode: QUERY, status: NOERROR, id: 40625
;; flags: qr rd ra; QUERY: 1, ANSWER: 1, AUTHORITY: 0, ADDITIONAL: 1

;; OPT PSEUDOSECTION:
; EDNS: version: 0, flags:; udp: 4096
;; QUESTION SECTION:
;vpce-09052e1d54acb0298-1930h81z-us-east-1b.syslog-logs.us-east-1.vpce.amazonaws.com. IN A

;; ANSWER SECTION:
vpce-09052e1d54acb0298-1930h81z-us-east-1b.syslog-logs.us-east-1.vpce.amazonaws.com. 60 IN A 10.0.1.226

;; Query time: 69 msec
;; SERVER: 127.0.2.2#53(127.0.2.2)
;; WHEN: Thu Jun 25 10:20:40 JST 2026
;; MSG SIZE  rcvd: 211

> dig vpce-09052e1d54acb0298-1930h81z-us-east-1a.syslog-logs.us-east-1.vpce.amazonaws.com

; <<>> DiG 9.10.6 <<>> vpce-09052e1d54acb0298-1930h81z-us-east-1a.syslog-logs.us-east-1.vpce.amazonaws.com
;; global options: +cmd
;; Got answer:
;; ->>HEADER<<- opcode: QUERY, status: NOERROR, id: 2800
;; flags: qr rd ra; QUERY: 1, ANSWER: 1, AUTHORITY: 0, ADDITIONAL: 1

;; OPT PSEUDOSECTION:
; EDNS: version: 0, flags:; udp: 4096
;; QUESTION SECTION:
;vpce-09052e1d54acb0298-1930h81z-us-east-1a.syslog-logs.us-east-1.vpce.amazonaws.com. IN A

;; ANSWER SECTION:
vpce-09052e1d54acb0298-1930h81z-us-east-1a.syslog-logs.us-east-1.vpce.amazonaws.com. 60 IN A 10.0.1.105

;; Query time: 29 msec
;; SERVER: 127.0.2.2#53(127.0.2.2)
;; WHEN: Thu Jun 25 10:20:44 JST 2026
;; MSG SIZE  rcvd: 211

> dig syslog-logs.us-east-1.amazonaws.com

; <<>> DiG 9.10.6 <<>> syslog-logs.us-east-1.amazonaws.com
;; global options: +cmd
;; Got answer:
;; ->>HEADER<<- opcode: QUERY, status: NXDOMAIN, id: 34014
;; flags: qr rd ra; QUERY: 1, ANSWER: 0, AUTHORITY: 1, ADDITIONAL: 1

;; OPT PSEUDOSECTION:
; EDNS: version: 0, flags:; udp: 4096
;; QUESTION SECTION:
;syslog-logs.us-east-1.amazonaws.com. IN A

;; AUTHORITY SECTION:
us-east-1.amazonaws.com. 7200 IN SOA dns-external-route53.us-east-1.amazonaws.com. root.amazon.com. 1 3600 900 604800 900

;; Query time: 21 msec
;; SERVER: 127.0.2.2#53(127.0.2.2)
;; WHEN: Thu Jun 25 10:20:50 JST 2026
;; MSG SIZE  rcvd: 156
Only syslog-logs.us-east-1.amazonaws.com failed to resolve.
This means there is no public service endpoint, and a VPC endpoint is required.
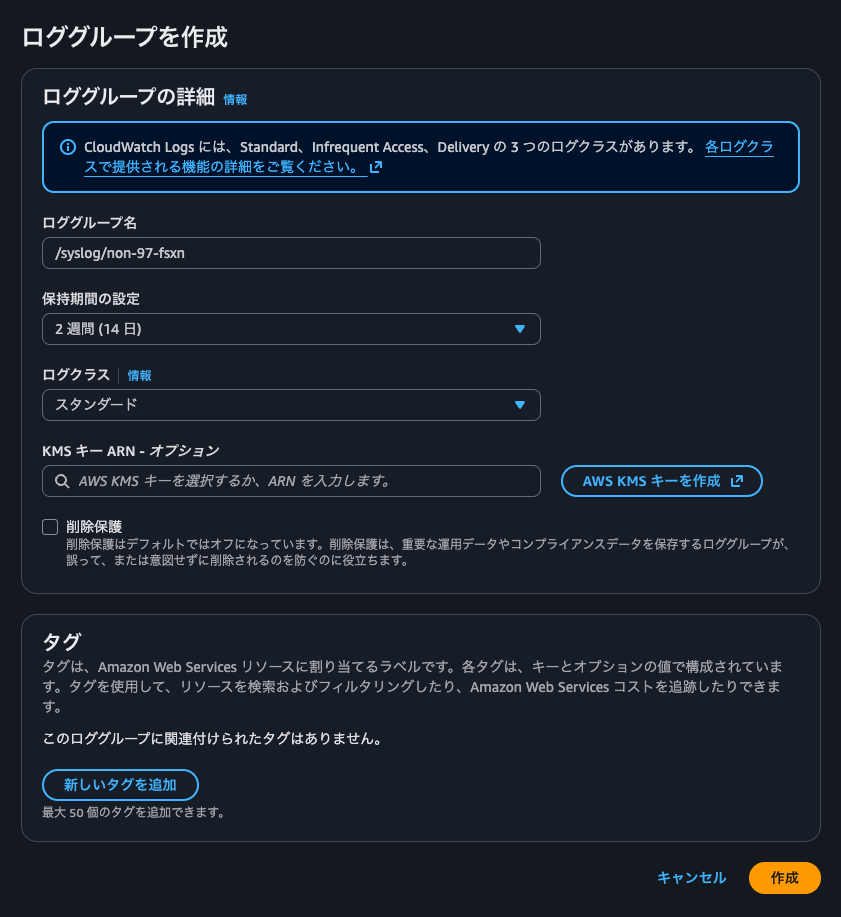
Creating a CloudWatch Logs Log Group
We will create a CloudWatch Logs log group as the delivery destination.
There are no special settings required at this stage.
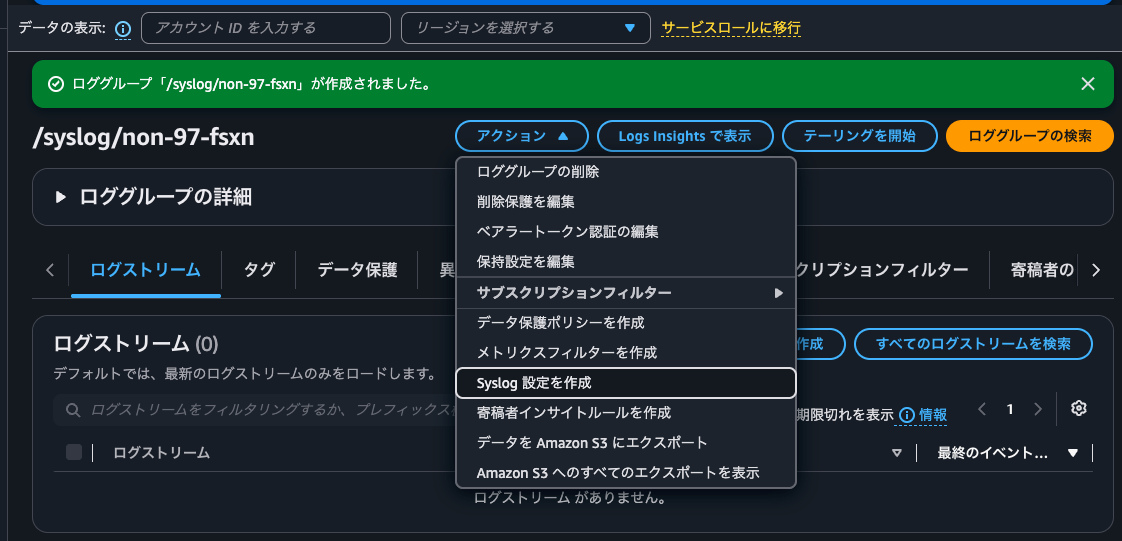
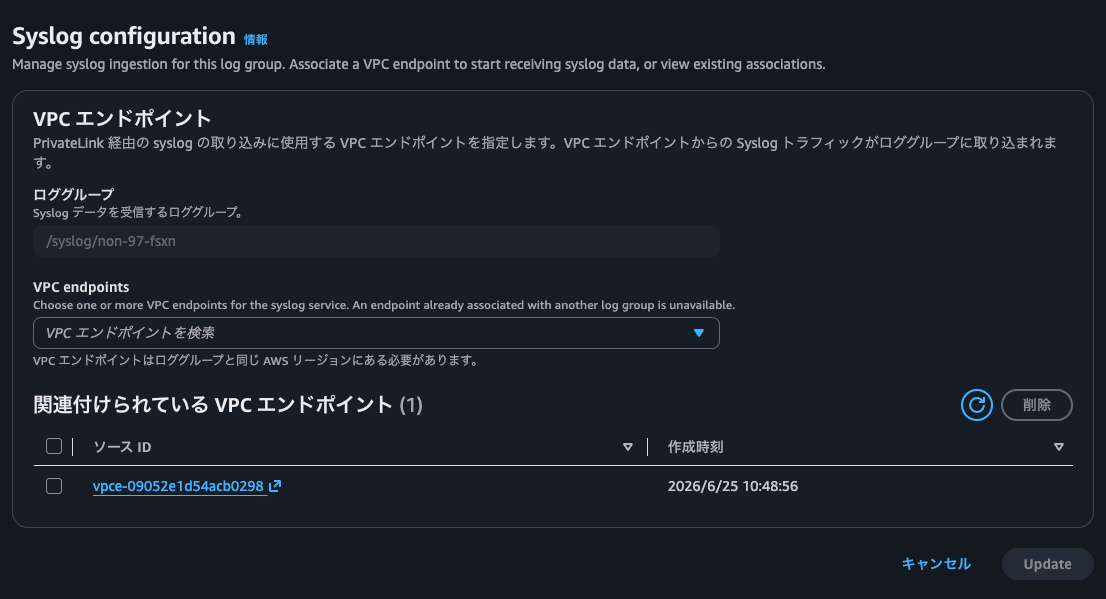
After creating the log group, configure the Syslog settings. Click Actions - Create Syslog configuration.
Specify the VPC endpoint created earlier and click Create.
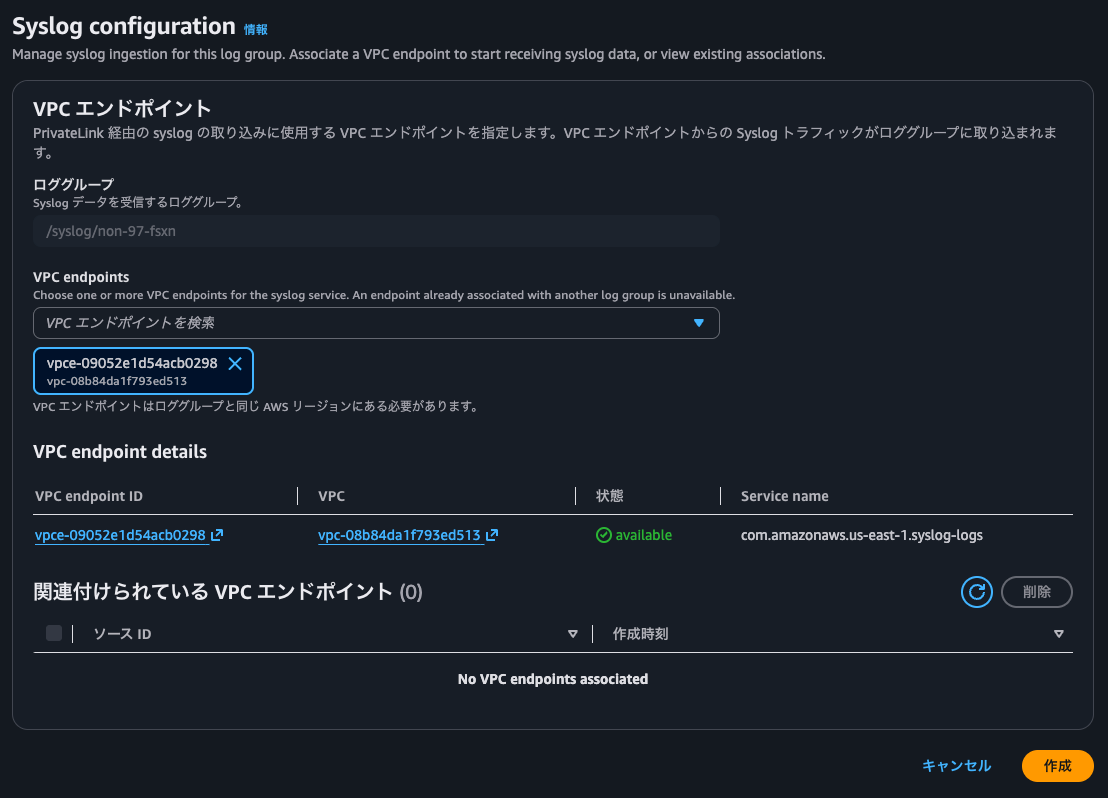
When complete, it will look like the following.
Finally, update the CloudWatch Logs resource policy to allow Syslog ingestion through the VPC endpoint.
> aws logs put-resource-policy \
  --policy-name syslog-ingestion \
  --policy-document '{
  "Version": "2012-10-17",
  "Statement": [
    {
      "Effect": "Allow",
      "Principal": {
        "Service": "syslog.logs.amazonaws.com"
      },
      "Action": [
        "logs:PutLogEvents",
        "logs:CreateLogStream"
      ],
      "Resource": "arn:aws:logs:us-east-1:<AWS Account ID>:log-group:/syslog/non-97-fsxn:*:*",
      "Condition": {
        "StringEquals": {
          "aws:SourceAccount": "<AWS Account ID>"
        },
        "ArnEquals": {
          "aws:SourceArn": "arn:aws:ec2:us-east-1:<AWS Account ID>:vpc-endpoint/vpce-09052e1d54acb0298"
        }
      }
    }
  ]
}'
{
    "resourcePolicy": {
        "policyName": "syslog-ingestion",
        "policyDocument": "{\n  \"Version\": \"2012-10-17\",\n  \"Statement\": [\n    {\n      \"Effect\": \"Allow\",\n      \"Principal\": {\n        \"Service\": \"syslog.logs.amazonaws.com\"\n      },\n      \"Action\": [\n        \"logs:PutLogEvents\",\n        \"logs:CreateLogStream\"\n      ],\n      \"Resource\": \"arn:aws:logs:us-east-1:<AWS Account ID>:log-group:/syslog/non-97-fsxn:*:*\",\n      \"Condition\": {\n        \"StringEquals\": {\n          \"aws:SourceAccount\": \"<AWS Account ID>\"\n        },\n        \"ArnEquals\": {\n          \"aws:SourceArn\": \"arn:aws:ec2:us-east-1:<AWS Account ID>:vpc-endpoint/vpce-09052e1d54acb0298\"\n        }\n      }\n    }\n  ]\n}",
        "lastUpdatedTime": 1782352394718,
        "policyScope": "ACCOUNT"
    }
}
Syslog Configuration for Management Activity Audit Logs
From here, the configuration is on the FSxN side.
Connect to the FSxN file system via SSH to operate through the ONTAP CLI.
::> version
NetApp Release 9.17.1P6: Wed Mar 25 15:38:10 UTC 2026
The current audit logs are as follows.
::> security audit log show -fields timestamp, node, application, vserver, username, input, state, message -application ssh -state Error|Success -timestamp >"Thu Jun 25 00:50:00 2026"
timestamp                  node                      application vserver                username          input                     state   message
-------------------------- ------------------------- ----------- ---------------------- ----------------- ------------------------- ------- -------
"Thu Jun 25 00:58:19 2026" FsxId08042f911cbc0ead3-02 ssh         FsxId08042f911cbc0ead3 fsx-control-plane set -privilege diagnostic Success -
"Thu Jun 25 00:58:19 2026" FsxId08042f911cbc0ead3-02 ssh         FsxId08042f911cbc0ead3 fsx-control-plane Logging out               Success -
"Thu Jun 25 00:58:19 2026" FsxId08042f911cbc0ead3-02 ssh         FsxId08042f911cbc0ead3 fsx-control-plane set -privilege diagnostic Success -
"Thu Jun 25 00:58:19 2026" FsxId08042f911cbc0ead3-02 ssh         FsxId08042f911cbc0ead3 fsx-control-plane security login unlock -username diag
                                                                                                                                    Success -
"Thu Jun 25 00:58:19 2026" FsxId08042f911cbc0ead3-02 ssh         FsxId08042f911cbc0ead3 fsx-control-plane Logging out               Success -
"Thu Jun 25 01:08:19 2026" FsxId08042f911cbc0ead3-02 ssh         FsxId08042f911cbc0ead3 fsx-control-plane set -privilege diagnostic Success -
"Thu Jun 25 01:08:19 2026" FsxId08042f911cbc0ead3-02 ssh         FsxId08042f911cbc0ead3 fsx-control-plane Logging out               Success -
"Thu Jun 25 01:08:19 2026" FsxId08042f911cbc0ead3-02 ssh         FsxId08042f911cbc0ead3 fsx-control-plane set -privilege diagnostic Success -
"Thu Jun 25 01:08:19 2026" FsxId08042f911cbc0ead3-02 ssh         FsxId08042f911cbc0ead3 fsx-control-plane security login unlock -username diag
                                                                                                                                    Success -
"Thu Jun 25 01:08:19 2026" FsxId08042f911cbc0ead3-02 ssh         FsxId08042f911cbc0ead3 fsx-control-plane Logging out               Success -
"Thu Jun 25 01:18:19 2026" FsxId08042f911cbc0ead3-02 ssh         FsxId08042f911cbc0ead3 fsx-control-plane set -privilege diagnostic Success -
"Thu Jun 25 01:18:19 2026" FsxId08042f911cbc0ead3-02 ssh         FsxId08042f911cbc0ead3 fsx-control-plane Logging out               Success -
"Thu Jun 25 01:18:19 2026" FsxId08042f911cbc0ead3-02 ssh         FsxId08042f911cbc0ead3 fsx-control-plane set -privilege diagnostic Success -
"Thu Jun 25 01:18:19 2026" FsxId08042f911cbc0ead3-02 ssh         FsxId08042f911cbc0ead3 fsx-control-plane security login unlock -username diag
                                                                                                                                    Success -
"Thu Jun 25 01:18:19 2026" FsxId08042f911cbc0ead3-02 ssh         FsxId08042f911cbc0ead3 fsx-control-plane Logging out               Success -
"Thu Jun 25 01:22:33 2026" FsxId08042f911cbc0ead3-01 ssh         FsxId08042f911cbc0ead3 fsxadmin          Logging in                Success -
16 entries were displayed.
Let's verify that these logs are being forwarded.
Before configuring Syslog, let's confirm that name resolution is possible using the VPC endpoint's DNS name.
In FSxN, the DNS servers currently being referenced cannot be confirmed.
::> dns show
This table is currently empty.

::> set diag

Warning: These diagnostic commands are for use by NetApp personnel only.
Do you want to continue? {y|n}: y

::*> dns show
This table is currently empty.
If Route 53 VPC Resolver is being used in the background, name resolution of syslog-logs.us-east-1.amazonaws.com should be possible.
Since there doesn't seem to be a command in FSxN to perform DNS name resolution directly, we'll judge based on the name resolution result that occurs during a ping.
::*> network ping -node FsxId08042f911cbc0ead3-01 -vserver FsxId08042f911cbc0ead3 -destination vpce-09052e1d54acb0298-1930h81z.syslog-logs.us-east-1.vpce.amazonaws.com -count 1 -show-detail true
PING vpce-09052e1d54acb0298-1930h81z.syslog-logs.us-east-1.vpce.amazonaws.com (10.0.1.226): 56 data bytes

--- vpce-09052e1d54acb0298-1930h81z.syslog-logs.us-east-1.vpce.amazonaws.com ping statistics ---
1 packets transmitted, 0 packets received, 100.0% packet loss

::*> network ping -node FsxId08042f911cbc0ead3-01 -vserver FsxId08042f911cbc0ead3 -destination vpce-09052e1d54acb0298-1930h81z.syslog-logs.us-east-1.vpce.amazonaws.com -count 1 -show-detail true
PING vpce-09052e1d54acb0298-1930h81z.syslog-logs.us-east-1.vpce.amazonaws.com (10.0.1.105): 56 data bytes

--- vpce-09052e1d54acb0298-1930h81z.syslog-logs.us-east-1.vpce.amazonaws.com ping statistics ---
1 packets transmitted, 0 packets received, 100.0% packet loss

::*> network ping -node FsxId08042f911cbc0ead3-01 -vserver FsxId08042f911cbc0ead3 -destination syslog-logs.us-east-1.amazonaws.com -count 1 -show-detail true
ping: cannot resolve syslog-logs.us-east-1.amazonaws.com: Unknown host
Yes, only syslog-logs.us-east-1.amazonaws.com failed to resolve.
So it seems that Route 53 VPC Resolver is not being referenced in the background.
Let's now configure Syslog.
::*> cluster log-forwarding show
This table is currently empty.

::*> cluster log-forwarding create -destination vpce-09052e1d54acb0298-1930h81z.syslog-logs.us-east-1.vpce.amazonaws.com -port 6514 -protocol tcp-encrypted -facility local0 -verify-server true -force true -message-format rfc-5424

::*> cluster log-forwarding show
                                                Verify  Syslog
Destination Host         Port   Protocol        Server  Facility
------------------------ ------ --------------- ------  --------
vpce-09052e1d54acb0298-1930h81z.syslog-logs.us-east-1.vpce.amazonaws.com
                         6514   tcp-encrypted   true    local0
 IPspace: Default

::*> cluster log-forwarding show -instance

                    Destination Host: vpce-09052e1d54acb0298-1930h81z.syslog-logs.us-east-1.vpce.amazonaws.com
                    Destination Port: 6514
             Log Forwarding Protocol: tcp-encrypted
              IPspace of Destination: Default
  Verify Destination Server Identity: true
                     Syslog Facility: local0
Cached DNS of Last Successful Lookup: 10.0.1.226
               Syslog Message Format: rfc-5424
    Syslog Timestamp Format Override: no-override
     Syslog Hostname Format Override: no-override
The configuration is complete.
Checking Delivered Logs
Check CloudWatch Logs.
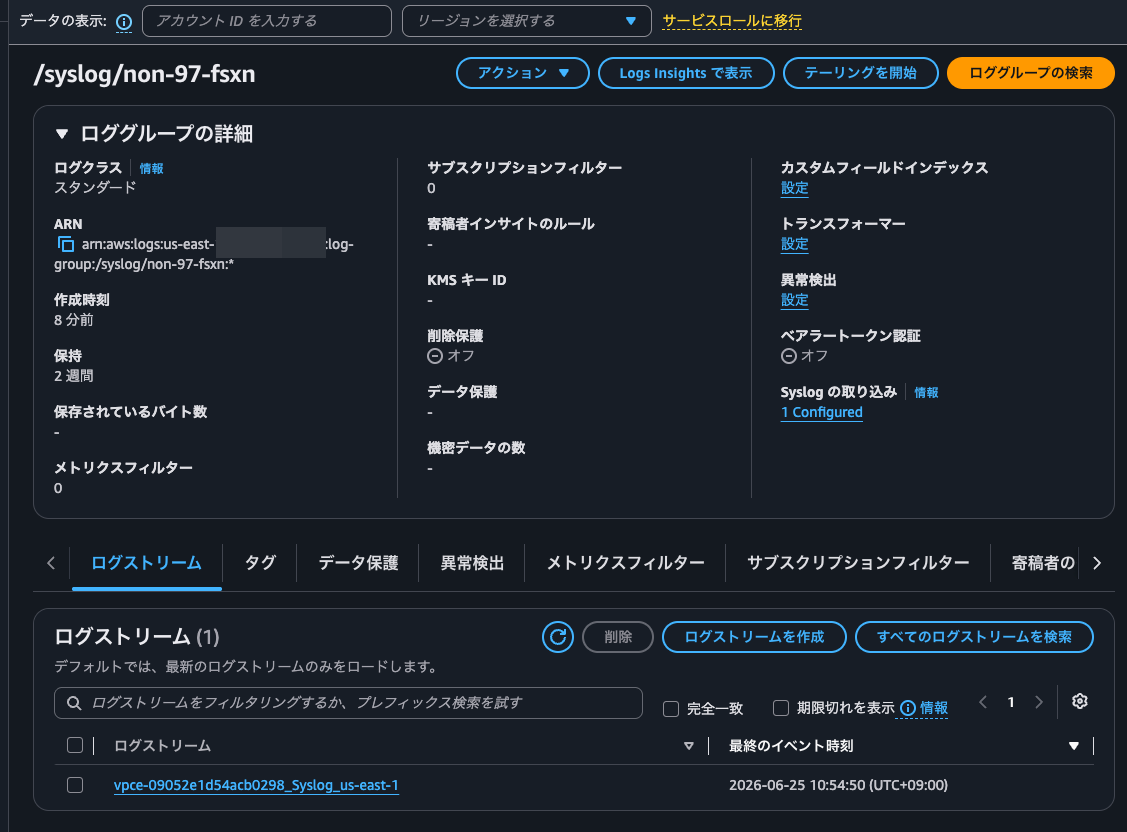
Yes, a log stream has been created. Since log streams appear to be created per VPC endpoint, it seems that VPC endpoints will need to be created separately for each purpose. Personally, I would have preferred prefixes to be created per facility.
The actual logs are as follows.
<134>1 2026-06-25T01:54:50+00:00 FsxId08042f911cbc0ead3-01 kern 5679 audit - : FsxId08042f911cbc0ead3-01: 00000002.0000a935 0000b89a Thu Jun 25 2026 01:54:49 +00:00 [kern_audit:info:5679] 8003e800000011af:8003e80000001291 :: FsxId08042f911cbc0ead3:ssh :: 10.0.1.21:50316 :: FsxId08042f911cbc0ead3:fsxadmin:fsxadmin :: cluster log-forwarding create -destination vpce-09052e1d54acb0298-1930h81z.syslog-logs.us-east-1.vpce.amazonaws.com -port 6514 -protocol tcp-encrypted -facility local0 -verify-server true -force true -message-format rfc-5424 :: Pending
<134>1 2026-06-25T01:54:50+00:00 FsxId08042f911cbc0ead3-01 kern 5679 audit - : FsxId08042f911cbc0ead3-01: 00000002.0000a936 0000b89a Thu Jun 25 2026 01:54:49 +00:00 [kern_audit:info:5679] 8003e800000011af:8003e80000001291 :: FsxId08042f911cbc0ead3:ssh :: 10.0.1.21:50316 :: FsxId08042f911cbc0ead3:fsxadmin:fsxadmin :: cluster log-forwarding create -destination vpce-09052e1d54acb0298-1930h81z.syslog-logs.us-east-1.vpce.amazonaws.com -port 6514 -protocol tcp-encrypted -facility local0 -verify-server true -force true -message-format rfc-5424 :: Success
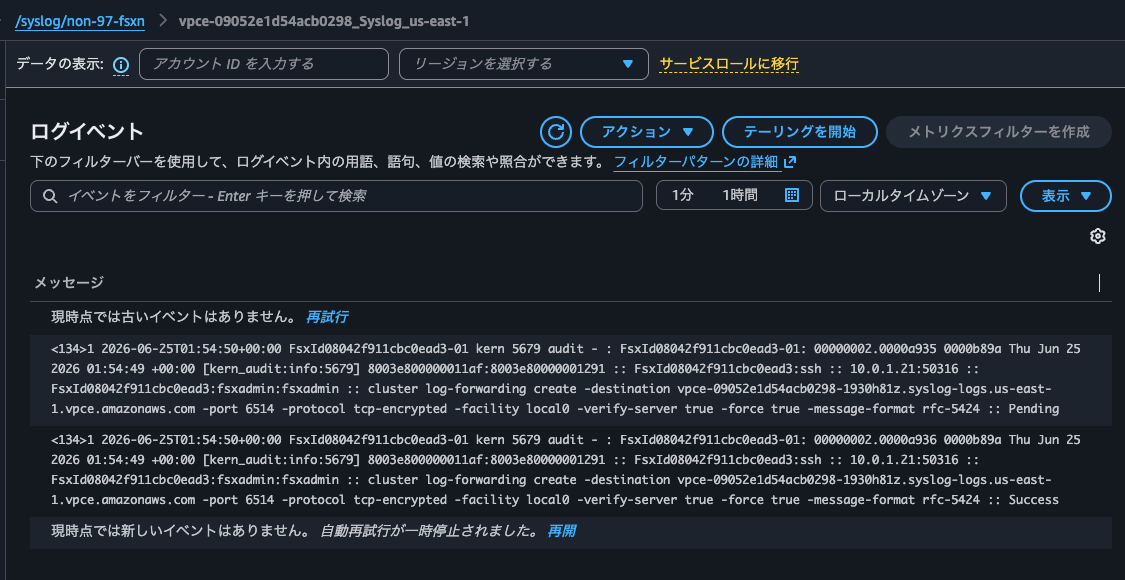
The operation log from when the Syslog was configured has been recorded. Looks great.
Let's run some additional commands.
::*> top
After waiting, the following log was delivered to CloudWatch Logs.
<134>1 2026-06-25T01:58:14+00:00 FsxId08042f911cbc0ead3-01 kern 5679 audit - : FsxId08042f911cbc0ead3-01: 00000002.0000a96e 0000c095 Thu Jun 25 2026 01:58:13 +00:00 [kern_audit:info:5679] 8003e800000011af:8003e800000012aa :: FsxId08042f911cbc0ead3:ssh :: 10.0.1.21:50316 :: FsxId08042f911cbc0ead3:fsxadmin:fsxadmin :: top :: Pending
<134>1 2026-06-25T01:58:14+00:00 FsxId08042f911cbc0ead3-01 kern 5679 audit - : FsxId08042f911cbc0ead3-01: 00000002.0000a96f 0000c095 Thu Jun 25 2026 01:58:13 +00:00 [kern_audit:info:5679] 8003e800000011af:8003e800000012aa :: FsxId08042f911cbc0ead3:ssh :: 10.0.1.21:50316 :: FsxId08042f911cbc0ead3:fsxadmin:fsxadmin :: top :: Success
After a while, not only the logs from operations I performed myself, but also logs from processes running in the background began to appear one after another.
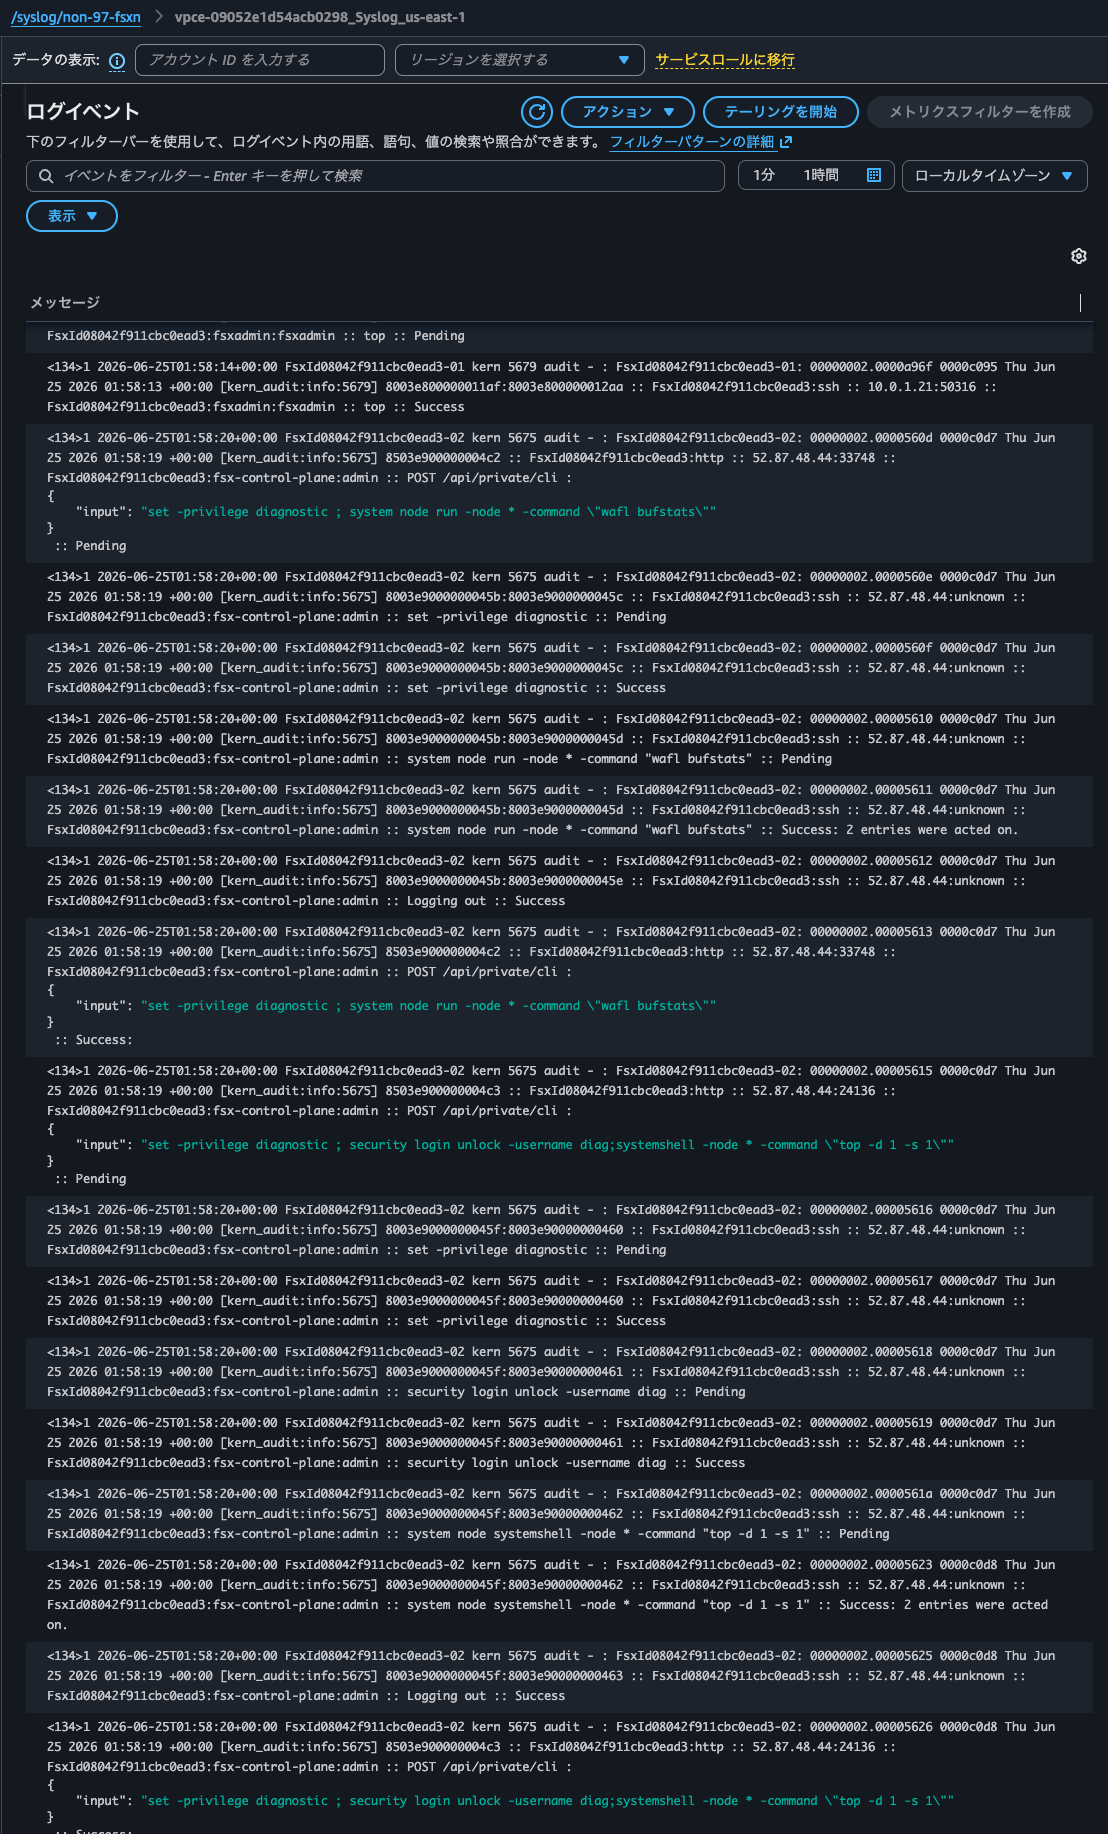
Since filtering these logs cannot be controlled on the FSxN side, they will need to be processed after the fact on the CloudWatch Logs side.
Next, let's check the logs using CloudWatch Logs Insights.
Run the following query.
SOURCE "arn:aws:logs:us-east-1:<AWSアカウントID>:log-group:/syslog/non-97-fsxn" START=-604800s END=0s |
fields @timestamp, @message
| parse @message "* :: * :: * :: * :: * :: *" as _hdr, access, client, principal, command, result
| filter result not like "Pending"
| filter principal not like "fsx-control-plane"
| parse principal "*:*:*" as _vs, _app, user
| parse client "*:*" as src_ip, _port
| sort @timestamp desc
| display @timestamp, src_ip, user, command, result
| limit 100
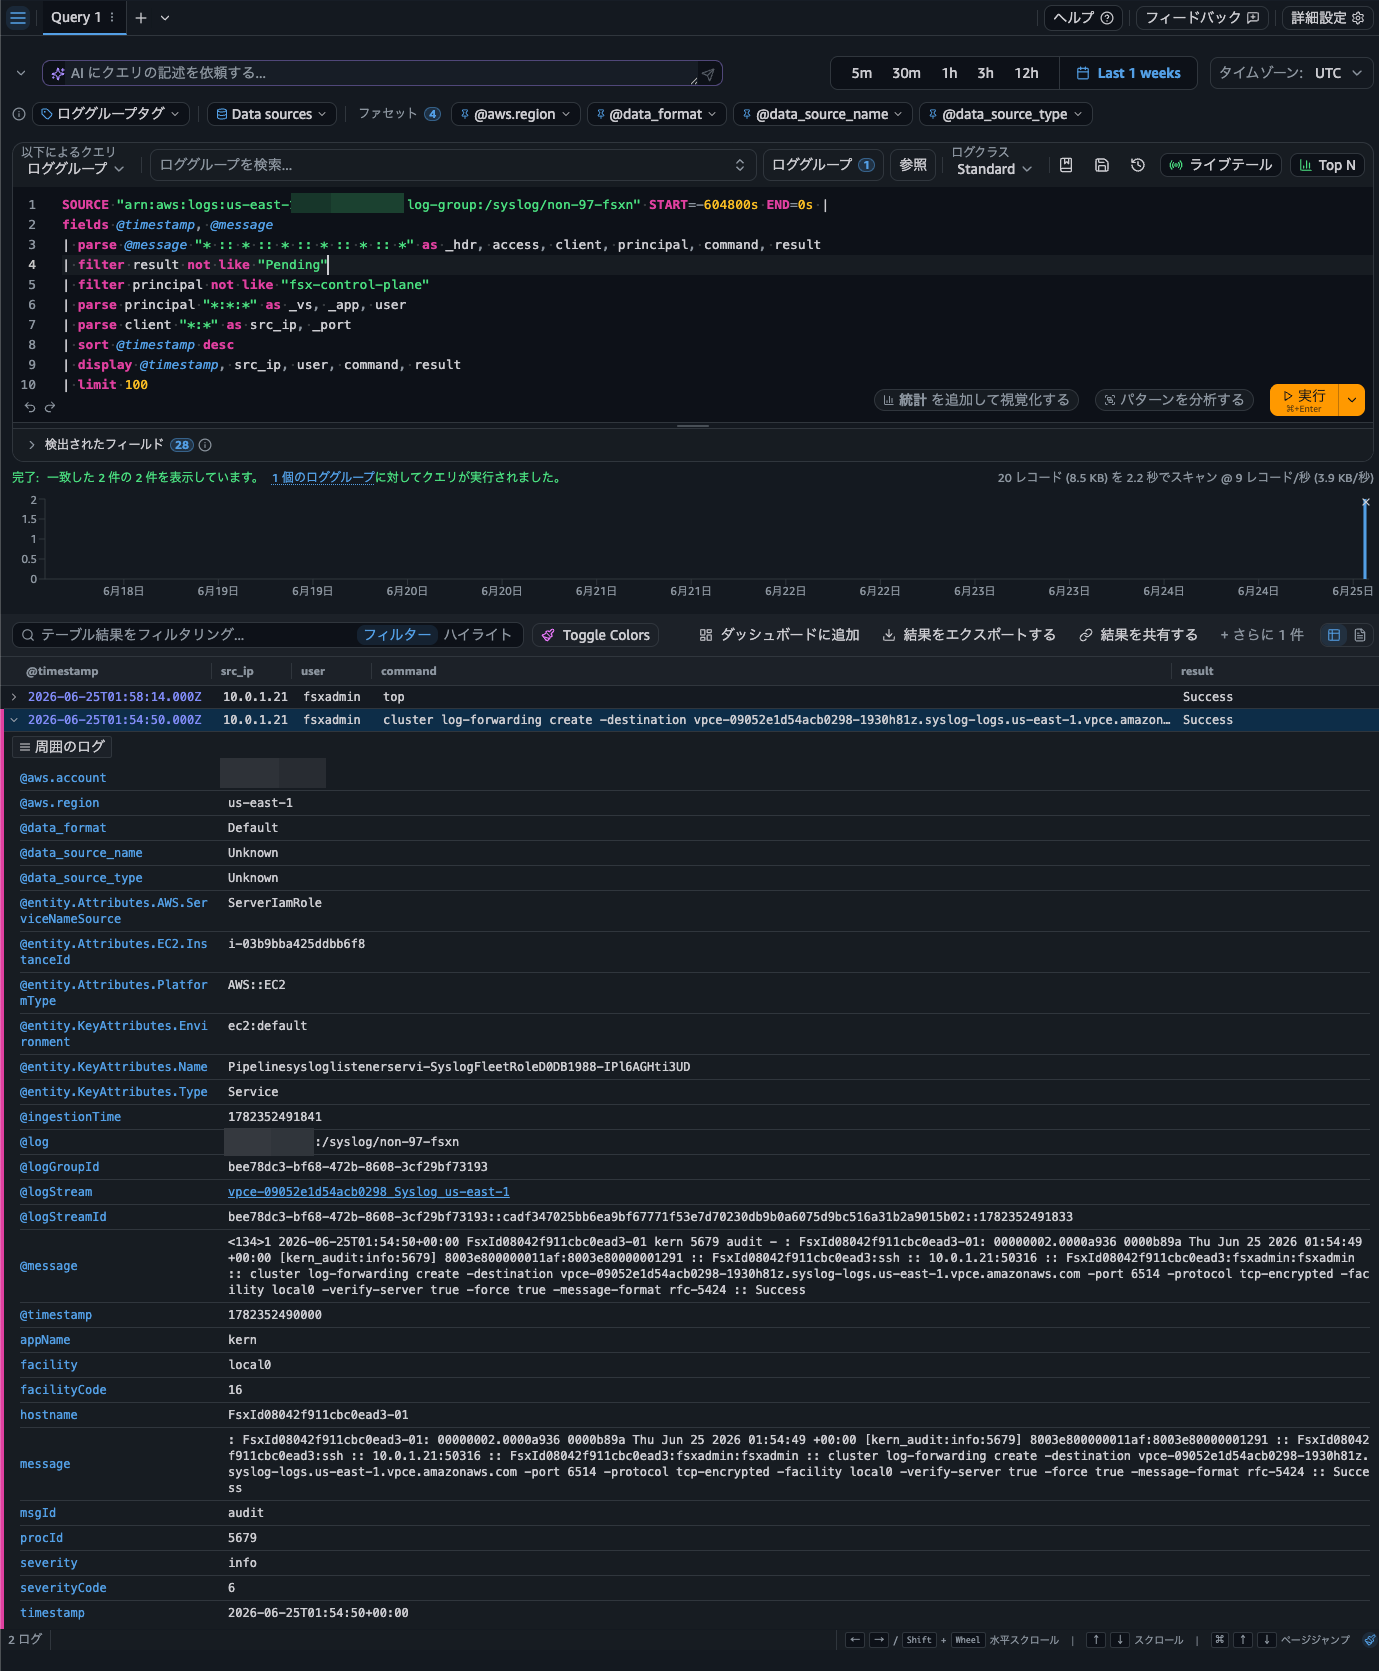
Nicely, only the logs from operations performed by the fsxadmin user were output.
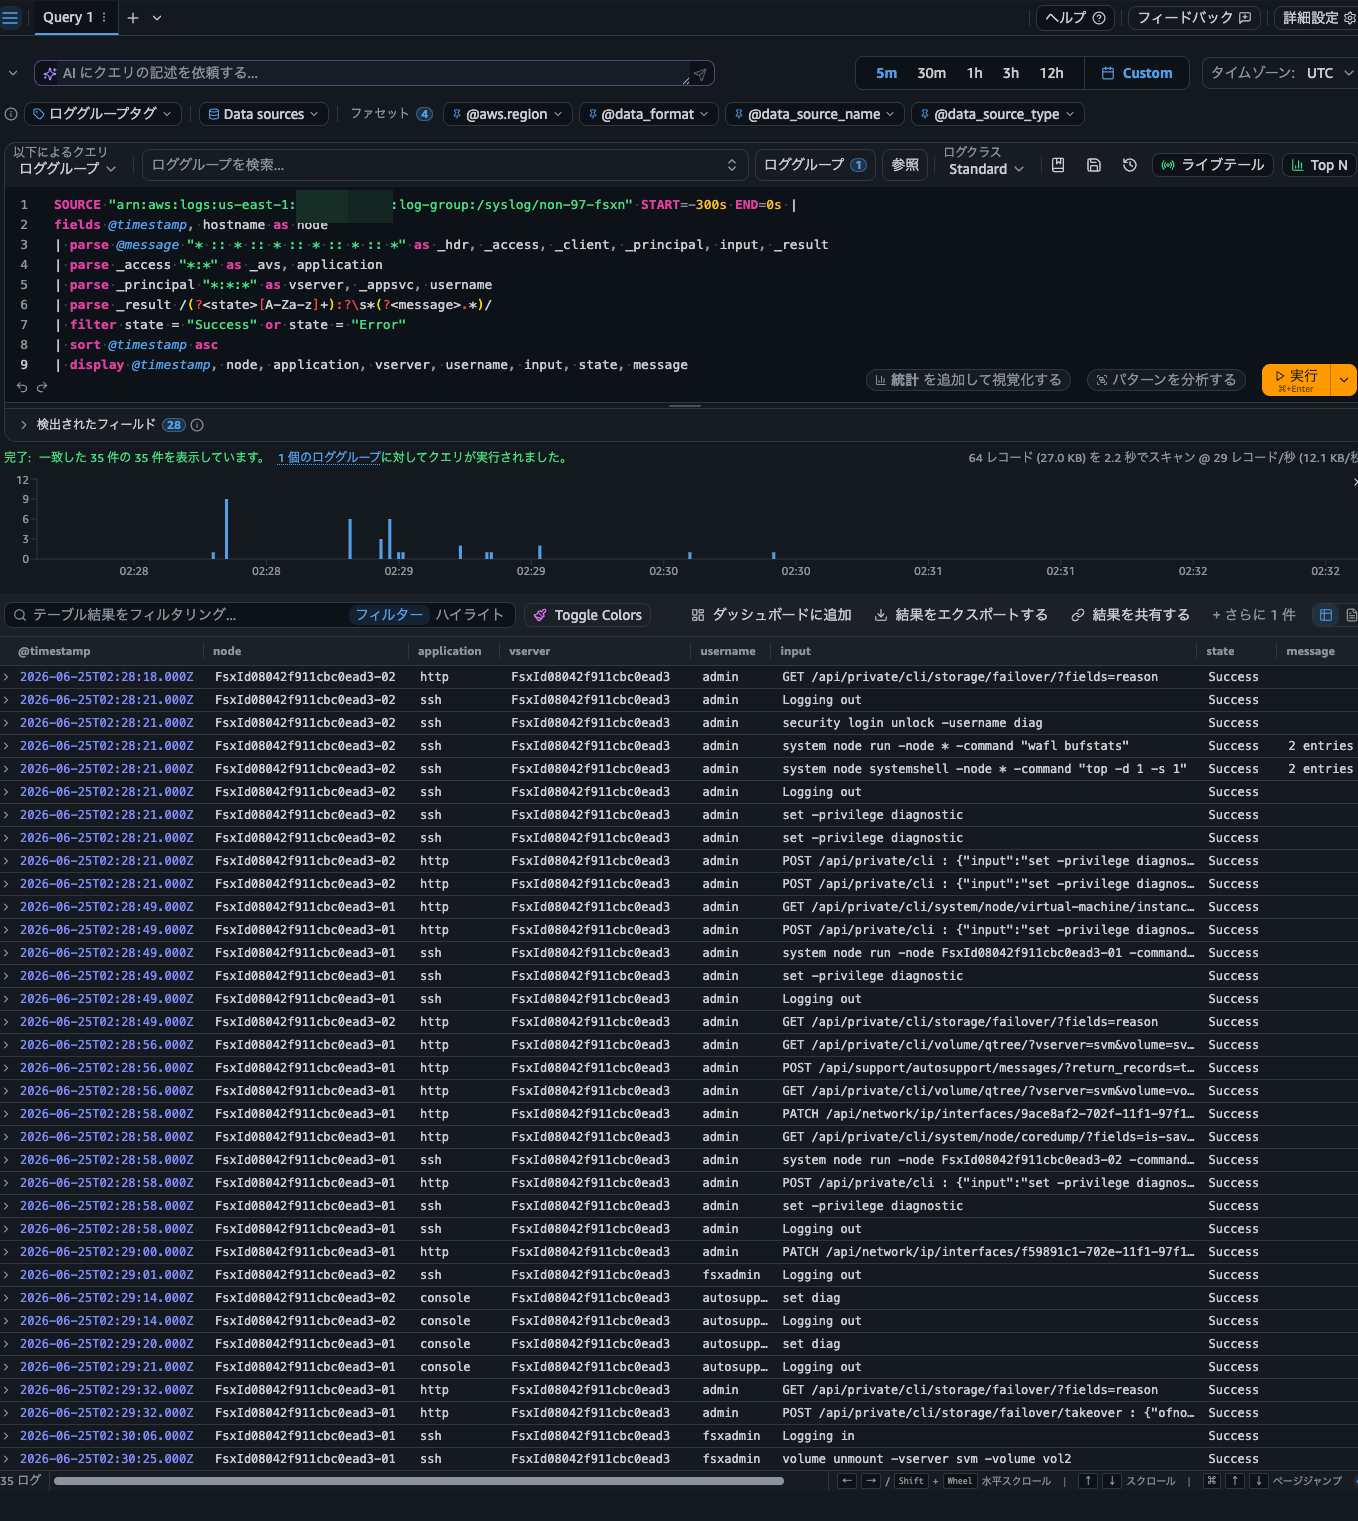
Next, run the following query.
SOURCE "arn:aws:logs:us-east-1:<AWSアカウントID>:log-group:/syslog/non-97-fsxn" START=-604800s END=0s |
fields @timestamp, hostname as node
| parse @message "* :: * :: * :: * :: * :: *" as _hdr, _access, _client, _principal, input, _result
| parse _access "*:*" as _avs, application
| parse _principal "*:*:*" as vserver, _appsvc, username
| parse _result /(?<state>[A-Za-z]+):?\s*(?<message>.*)/
| filter application = "ssh"
| filter state = "Success" or state = "Error"
| sort @timestamp desc
| display @timestamp, node, application, vserver, username, input, state, message
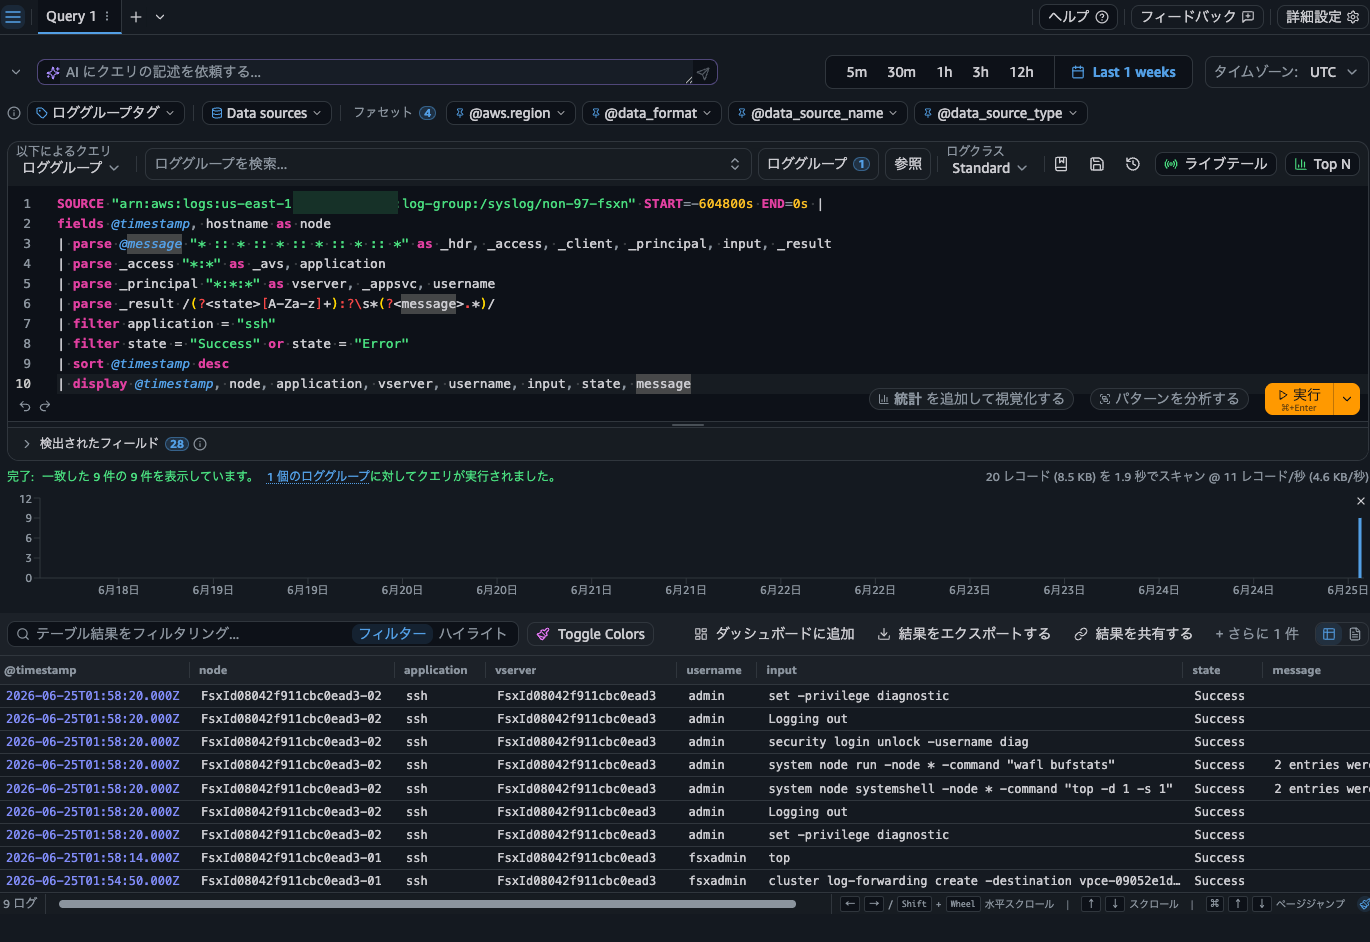
This one ran without any issues as well.
The output is
Checking Management Activity Audit Logs During FSxN Failover
I also want to confirm whether logs continue to be output during an FSxN failover.
Let's try it out.
We'll change the throughput capacity to trigger a failover.
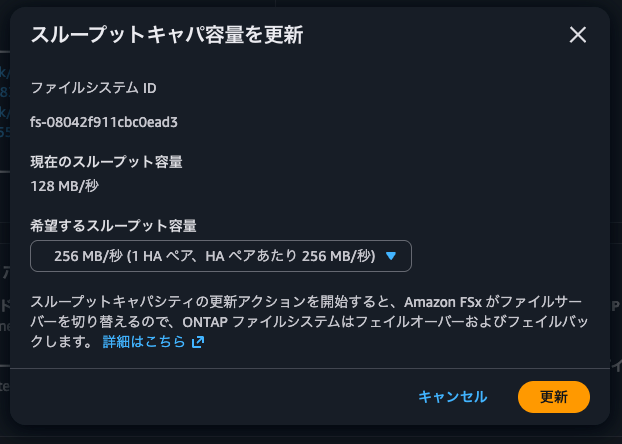
When the failover begins, the SSH connection is dropped.
After reconnecting and checking the LIFs, we can see that the LIFs for fsxadmin and NFS/SMB management have moved to node 02.
::> network interface show
            Logical    Status     Network            Current       Current Is
Vserver     Interface  Admin/Oper Address/Mask       Node          Port    Home
----------- ---------- ---------- ------------------ ------------- ------- ----
FsxId08042f911cbc0ead3
            fsxadmin     up/up    198.19.185.178/24  FsxId08042f911cbc0ead3-02
                                                                   e0e     false
            inter_1      up/-     10.0.1.69/26       FsxId08042f911cbc0ead3-01
                                                                   e0e     true
            inter_2      up/up    10.0.1.206/26      FsxId08042f911cbc0ead3-02
                                                                   e0e     true
svm
            iscsi_1      up/-     10.0.1.87/26       FsxId08042f911cbc0ead3-01
                                                                   e0e     true
            iscsi_2      up/up    10.0.1.249/26      FsxId08042f911cbc0ead3-02
                                                                   e0e     true
            nfs_smb_management_1
                         up/up    198.19.185.130/24  FsxId08042f911cbc0ead3-02
                                                                   e0e     false
6 entries were displayed.
In this state, we'll create a volume.
::> volume create -vserver svm -volume vol2 -aggregate aggr1 -size 1GB -state online -policy default -tiering-policy none
[Job 52] Job succeeded: Successful

::> vol show
Vserver   Volume       Aggregate    State      Type       Size  Available Used%
--------- ------------ ------------ ---------- ---- ---------- ---------- -----
svm       svm_root     aggr1        online     RW          1GB    972.4MB    0%
svm       vol1         aggr1        online     RW         32GB    30.40GB    0%
svm       vol2         aggr1        online     RW          1GB    972.5MB    0%
3 entries were displayed.

::> volume mount -vserver svm -volume vol2 -junction-path /vol2
Let's check the audit logs.
::> security audit log show -fields timestamp, node, application, vserver, username, input, state, message -application ssh -state Error|Success -timestamp >"Thu Jun 25 02:10:00 2026"
timestamp                  node                      application vserver                username input      state   message
-------------------------- ------------------------- ----------- ---------------------- -------- ---------- ------- -------
"Thu Jun 25 02:17:46 2026" FsxId08042f911cbc0ead3-02 ssh         FsxId08042f911cbc0ead3 fsxadmin Logging in Success -
"Thu Jun 25 02:18:19 2026" FsxId08042f911cbc0ead3-02 ssh         FsxId08042f911cbc0ead3 fsx-control-plane
                                                                                                 set -privilege diagnostic
                                                                                                            Success -
"Thu Jun 25 02:18:19 2026" FsxId08042f911cbc0ead3-02 ssh         FsxId08042f911cbc0ead3 fsx-control-plane
                                                                                                 Logging out
                                                                                                            Success -
"Thu Jun 25 02:18:19 2026" FsxId08042f911cbc0ead3-02 ssh         FsxId08042f911cbc0ead3 fsx-control-plane
                                                                                                 set -privilege diagnostic
                                                                                                            Success -
"Thu Jun 25 02:18:19 2026" FsxId08042f911cbc0ead3-02 ssh         FsxId08042f911cbc0ead3 fsx-control-plane
                                                                                                 security login unlock -username diag
                                                                                                            Success -
"Thu Jun 25 02:18:19 2026" FsxId08042f911cbc0ead3-02 ssh         FsxId08042f911cbc0ead3 fsx-control-plane
                                                                                                 Logging out
                                                                                                            Success -
"Thu Jun 25 02:18:32 2026" FsxId08042f911cbc0ead3-02 ssh         FsxId08042f911cbc0ead3 fsxadmin top        Success -
"Thu Jun 25 02:20:17 2026" FsxId08042f911cbc0ead3-02 ssh         FsxId08042f911cbc0ead3 fsxadmin volume create -vserver svm -volume vol2 -aggregate aggr1 -size 1GB -state online -policy default -tiering-policy none
                                                                                                            Success -
"Thu Jun 25 02:24:30 2026" FsxId08042f911cbc0ead3-02 ssh         FsxId08042f911cbc0ead3 fsxadmin volume mount -vserver svm -volume vol2 -junction-path /vol2
                                                                                                            Success -
9 entries were displayed.
We can see that commands are being accepted on node 02.
Now, let's run the following query in CloudWatch Logs Insights.
SOURCE "arn:aws:logs:us-east-1:<AWSアカウントID>:log-group:/syslog/non-97-fsxn" START=-1800s END=0s |
fields @timestamp, hostname as node
| parse @message "* :: * :: * :: * :: * :: *" as _hdr, _access, _client, _principal, input, _result
| parse _access "*:*" as _avs, application
| parse _principal "*:*:*" as vserver, _appsvc, username
| parse _result /(?<state>[A-Za-z]+):?\s*(?<message>.*)/
| filter state = "Success" or state = "Error"
| sort @timestamp asc
| display @timestamp, node, application, vserver, username, input, state, message
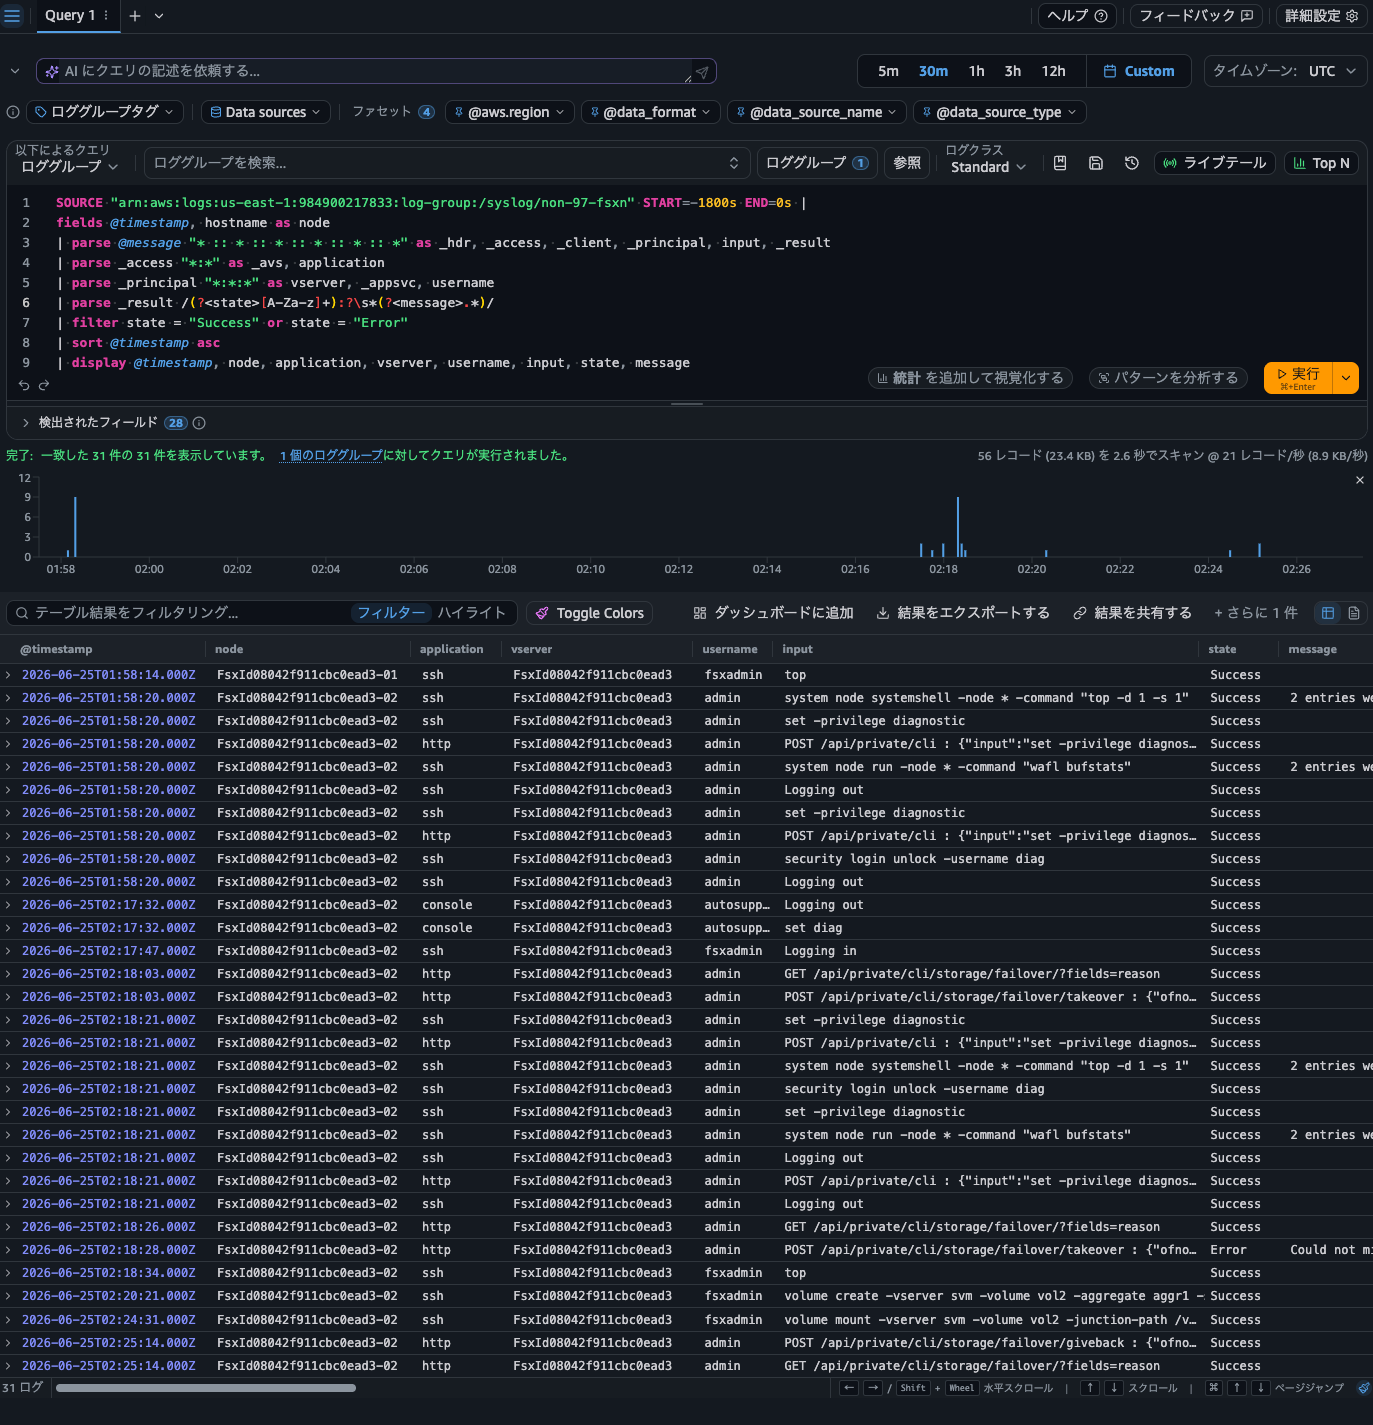
Yes, we were able to confirm that the logs for the volume creation and mount commands executed during the failover were being delivered. That's great to see. Incidentally, comparing the timestamp in the log record with the CloudWatch Logs timestamp, the delivery takes about 1 to 4 seconds.
The throughput capacity change completed, and the failback finished.
Let's unmount the volume.
::> vol unmount -vserver svm -volume vol2

::> network interface show
            Logical    Status     Network            Current       Current Is
Vserver     Interface  Admin/Oper Address/Mask       Node          Port    Home
----------- ---------- ---------- ------------------ ------------- ------- ----
FsxId08042f911cbc0ead3
            fsxadmin     up/up    198.19.185.178/24  FsxId08042f911cbc0ead3-01
                                                                   e0e     true
            inter_1      up/up    10.0.1.69/26       FsxId08042f911cbc0ead3-01
                                                                   e0e     true
            inter_2      up/-     10.0.1.206/26      FsxId08042f911cbc0ead3-02
                                                                   e0e     true
svm
            iscsi_1      up/up    10.0.1.87/26       FsxId08042f911cbc0ead3-01
                                                                   e0e     true
            iscsi_2      up/-     10.0.1.249/26      FsxId08042f911cbc0ead3-02
                                                                   e0e     true
            nfs_smb_management_1
                         up/up    198.19.185.130/24  FsxId08042f911cbc0ead3-01
                                                                   e0e     true
6 entries were displayed.

::> vol unmount -vserver svm -volume vol2
The audit logs at this time are as follows.
This time, we can also confirm from the logs that fsxadmin unmounted the volume on node 01.
Syslog Forwarding of EMS Events
Next, let's try to see if we can forward EMS events via Syslog.
In past attempts, it was not possible to forward EMS events via Syslog on the FSxN side.
Let's try to check it out.
::> set diag

Warning: These diagnostic commands are for use by NetApp personnel only.
Do you want to continue? {y|n}: y

::*> event notification ?
  create                      Create an event notification
  delete                      Delete event notifications
  destination>                Create, modify, delete and view event notification destinations.
  history>                    The history directory
  modify                      Modify event notifications
  show                        Display event notifications
Yes, it looks like it might be possible.
In other words, it has now become possible to detect events through logs delivered to CloudWatch Logs that could not previously be detected at the AWS layer via CloudWatch metrics, and to notify administrators or respond automatically. That's exciting.
Let's actually try it out.
First, define the delivery destination.
::*> event notification destination create -name syslog -syslog vpce-09052e1d54acb0298-1930h81z.syslog-logs.us-east-1.vpce.amazonaws.com -syslog-port 6514 -syslog-transport tcp-encrypted -syslog-message-format rfc-5424

::*> event notification destination show
Name            Type        Destination
--------------  ----------  ---------------------
syslog          syslog      vpce-09052e1d54acb0298-1930h81z.syslog-logs.us-east-1.vpce.amazonaws.com (port: 6514, transport: tcp-encrypted)

::*> event notification destination show -instance

                Destination Name: syslog
             Type of Destination: syslog
                     Destination: vpce-09052e1d54acb0298-1930h81z.syslog-logs.
                                  us-east-1.vpce.amazonaws.com (port: 6514,
                                  transport: tcp-encrypted)
 Server CA Certificates Present?: true
   Client Certificate Issuing CA: -
Client Certificate Serial Number: -
       Client Certificate Valid?: -
                     Syslog Port: 6514
                Syslog Transport: tcp-encrypted
           Syslog Message Format: rfc-5424
Syslog Timestamp Format Override: no-override
 Syslog Hostname Format Override: no-override
      System-Defined Destination: false
             Access Control Role: fsxadmin
Now let's configure the Syslog delivery settings for EMS events. We will use a filter that already exists by default.
::*> event filter show
Filter      Rule Rule                                    SNMP Trap
Name        Posn Type     Message Name     Severity      Type      Parameters
----------- ---- -------- ---------------- ------------- --------- -----------
default-trap-events
            1    include  *                EMERGENCY, ALERT
                                                         *         *=*
            2    include  callhome.*       ERROR         *         *=*
            3    include  *                *             Standard, Built-in
                                                                   *=*
            4    exclude  *                *             *         *=*
important-events
            1    include  *                EMERGENCY, ALERT
                                                         *         *=*
            2    include  callhome.*       ERROR         *         *=*
            3    exclude  *                *             *         *=*
no-info-debug-events
            1    include  *                EMERGENCY, ALERT, ERROR, NOTICE
                                                         *         *=*
            2    exclude  *                *             *         *=*
9 entries were displayed.

::*> event notification create -filter-name no-info-debug-events -destinations syslog -access-control-role fsxadmin

::*> event notification show
ID   Filter Name                     Destinations
---- ------------------------------  -----------------
2    no-info-debug-events            syslog

::*> event notification show -instance

         Internal Event Notification ID: 101
                  Event Notification ID: 2
                      Event Filter Name: no-info-debug-events
List of Event Notification Destinations: syslog
                    Access Control Role: fsxadmin
Configuration is complete.
Let's try issuing a test EMS event.
::*> event notification destination check -node FsxId08042f911cbc0ead3-01 -destination-name syslog
Event "ems.eut.notice" was successfully sent to the specified destination.
Checking CloudWatch Logs, the following output was found.
<13>1 2026-06-25T02:56:33+00:00 FsxId08042f911cbc0ead3-01 notifyd - ems.eut.notice - A dummy syslog formatted string for a NOTICE event with value '0'.
<134>1 2026-06-25T02:56:34+00:00 FsxId08042f911cbc0ead3-01 kern 6223 audit - : FsxId08042f911cbc0ead3-01: 00000004.00005718 0000531d Thu Jun 25 2026 02:56:33 +00:00 [kern_audit:info:6223] 8003e800000002bf:8003e80000000541 :: FsxId08042f911cbc0ead3:ssh :: 10.0.1.21:55784 :: FsxId08042f911cbc0ead3:fsxadmin:fsxadmin :: event notification destination check -node FsxId08042f911cbc0ead3-01 -destination-name syslog :: Success
It is being delivered successfully. Since we are using the same VPC endpoint as before, it is being output to the same log stream, which makes it a bit harder to distinguish.
Let's actually have some EMS events delivered.
Looking at the event catalog, it appeared that a password change would generate an event.
::*> event catalog show -message-name *passwd*
Message                          Severity         SNMP Trap Type
-------------------------------- ---------------- -----------------
passwd.changed                   NOTICE           Severity-based
Let's change the password to trigger an EMS event.
::*> security login password -username fsxadmin

Enter your current password:
Enter a new password:
Enter it again:

::*> event log show -time >"6/25/2026 03:00:00"
Time                Node             Severity      Event
------------------- ---------------- ------------- ---------------------------
6/25/2026 03:07:32  FsxId08042f911cbc0ead3-01
                                     NOTICE        passwd.changed: passwd for user 'fsxadmin' changed.
However, no matter how long we waited, this log was not delivered to CloudWatch Logs.
I thought the filter might be the issue and investigated, but it didn't appear to be a problem.
::*> event filter test -filter-name no-info-debug-events -message-name passwd.changed
The message-name "passwd.changed" is included in the given filter.
Looking through various catalogs, it appeared that an EMS event would be generated when a disk-full condition occurs.
Let's set the volume size to 20MB and write 1GB of data to it.
::*> volume modify -volume vol1 -vserver svm -size 20MB
Volume modify successful on volume vol1 of Vserver svm.

::*> volume show
Vserver   Volume       Aggregate    State      Type       Size  Available Used%
--------- ------------ ------------ ---------- ---- ---------- ---------- -----
svm       svm_root     aggr1        online     RW          1GB    972.2MB    0%
svm       vol1         aggr1        online     RW         20MB    18.59MB    2%
svm       vol2         aggr1        online     RW          1GB    972.5MB    0%
3 entries were displayed.
$ sudo mount -t nfs svm-004edd82ad16c9420.fs-08042f911cbc0ead3.fsx.us-east-1.amazonaws.com:/vol1 /mnt/fsxn/
$ df -hT -t nfs4
Filesystem                                                                   Type  Size  Used Avail Use% Mounted on
svm-004edd82ad16c9420.fs-08042f911cbc0ead3.fsx.us-east-1.amazonaws.com:/vol1 nfs4   19M  384K   19M   2% /mnt/fsxn

$ sudo dd if=/dev/urandom of=/mnt/fsxn/random_pattern_binary_block_1GiB bs=1M count=1024
dd: error writing '/mnt/fsxn/random_pattern_binary_block_1GiB': No space left on device
94+0 records in
93+0 records out
97517568 bytes (98 MB, 93 MiB) copied, 0.457489 s, 213 MB/s
The write terminated midway.
Checking the EMS events, it was confirmed that an event was indeed generated due to the disk-full condition.
::*> event log show -time >"6/25/2026 03:00:00"
Time                Node             Severity      Event
------------------- ---------------- ------------- ---------------------------
6/25/2026 03:33:31  FsxId08042f911cbc0ead3-01
                                     ALERT         monitor.volume.full: Volume "vol1@vserver:97f93ade-702f-11f1-97f1-2bf30b9c5c7a" is full (using or reserving 100% of space and 0% of inodes).
6/25/2026 03:33:31  FsxId08042f911cbc0ead3-01
                                     ALERT         wafl.vol.full: Insufficient space on volume vol1@vserver:97f93ade-702f-11f1-97f1-2bf30b9c5c7a to perform operation. 72.0KB was requested but only 28.0KB was available.
6/25/2026 03:23:26  FsxId08042f911cbc0ead3-01
                                     NOTICE        passwd.changed: passwd for user 'fsxadmin' changed.
6/25/2026 03:07:32  FsxId08042f911cbc0ead3-01
                                     NOTICE        passwd.changed: passwd for user 'fsxadmin' changed.
4 entries were displayed.
Also, checking CloudWatch Logs, the following logs were delivered.
<1>1 2026-06-25T03:33:31+00:00 FsxId08042f911cbc0ead3-01 kernel - monitor.volume.full - Volume "vol1@vserver:97f93ade-702f-11f1-97f1-2bf30b9c5c7a" is full (using or reserving 100% of space and 0% of inodes).
<1>1 2026-06-25T03:33:31+00:00 FsxId08042f911cbc0ead3-01 kernel - wafl.vol.full - Insufficient space on volume vol1@vserver:97f93ade-702f-11f1-97f1-2bf30b9c5c7a to perform operation. 72.0KB was requested but only 28.0KB was available.
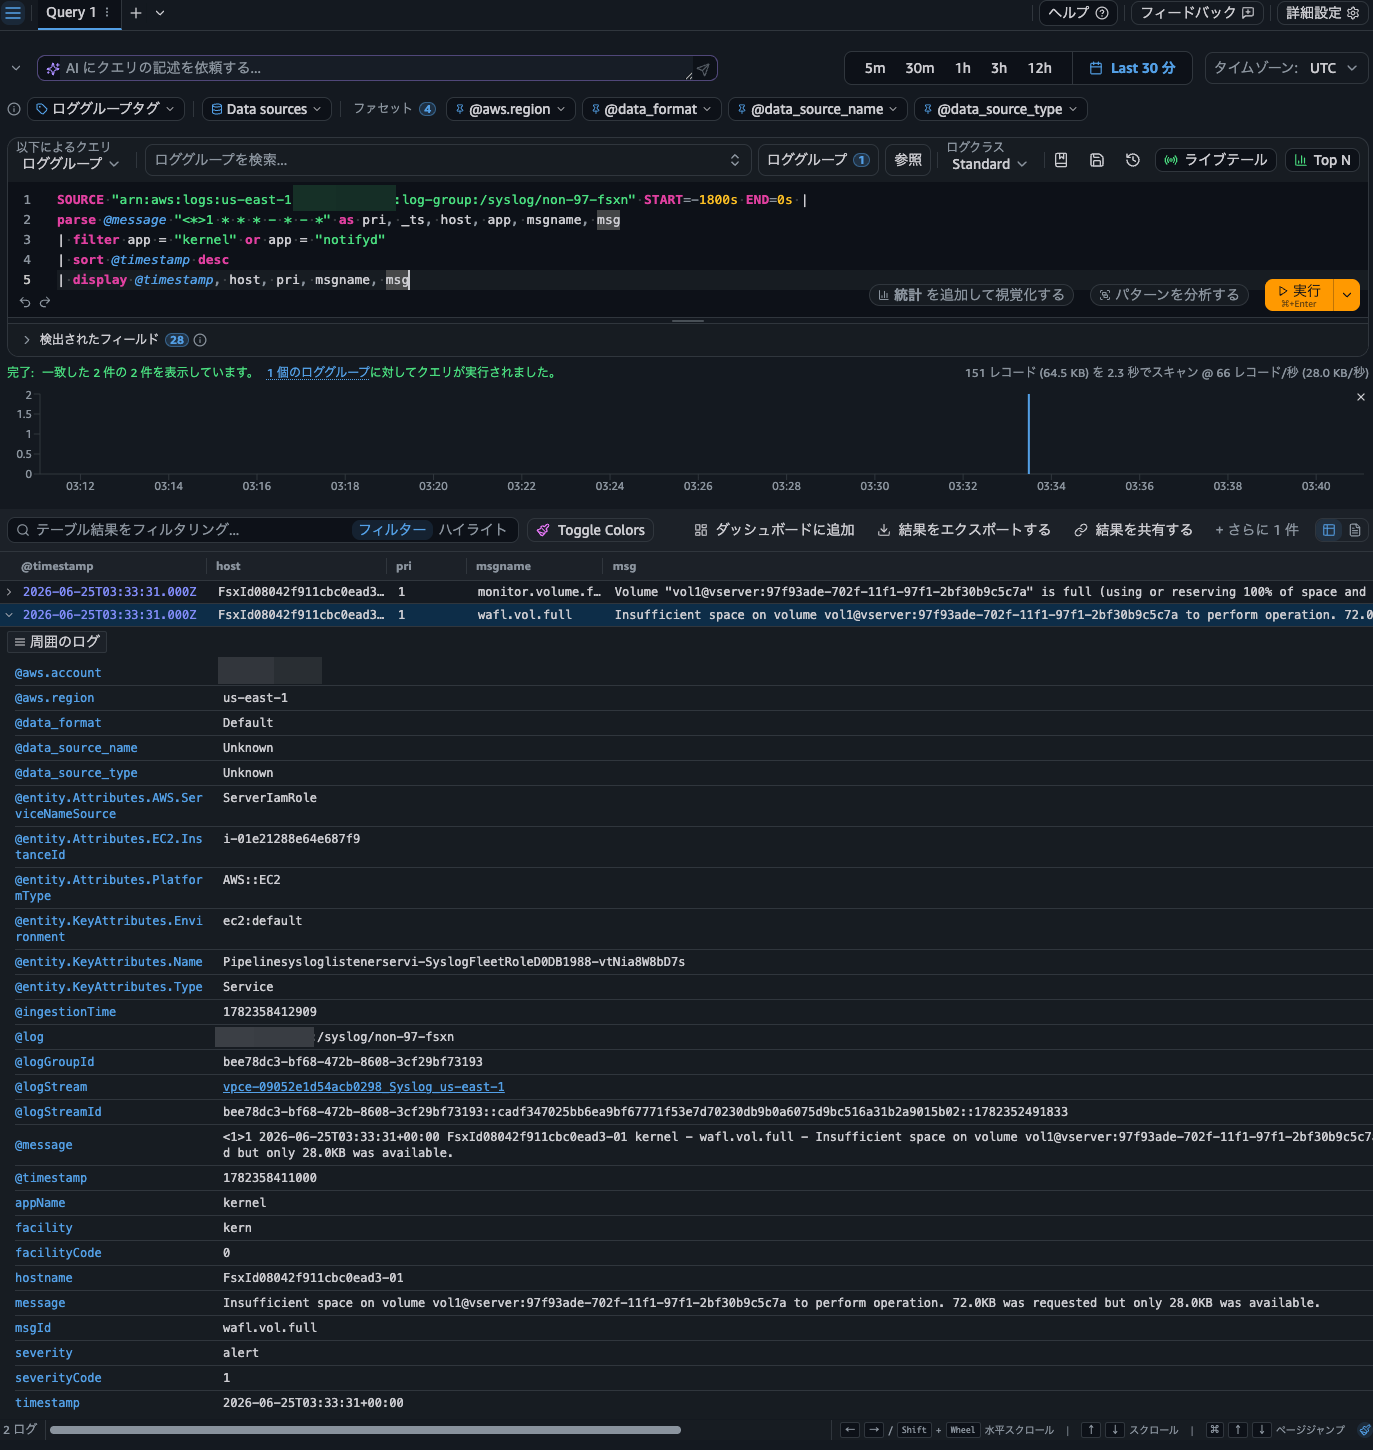
You can also query with Logs Insights as follows.
SOURCE "arn:aws:logs:us-east-1:<AWS Account ID>:log-group:/syslog/non-97-fsxn" START=-1800s END=0s |
parse @message "<*>1 * * * - * - *" as pri, _ts, host, app, msgname, msg
| filter app = "kernel" or app = "notifyd"
| sort @timestamp desc
| display @timestamp, host, pri, msgname, msg
It Has Become Easier to Meet Requirements for Long-Term Log Retention and Operations That Trigger Notifications or Actions from EMS Events
We delivered audit logs of management activities for Amazon FSx for NetApp ONTAP to CloudWatch Logs using a Syslog VPC endpoint.
I feel it has become easier to meet requirements for long-term log retention and operations that trigger notifications or actions based on EMS events. Personally, this was a very welcome update.
I hope this article helps someone.
That's all from Nonpi (@non____97) of the Cloud Business Division, Consulting Department!
