![[新機能プレビュー] Amazon Q in QuickSight Scenarios で既存のシナリオにデータをアップロードで追加してみた](https://images.ctfassets.net/ct0aopd36mqt/3aqf4zA8eWdIL3CoGscPpm/224083826f6e4dd7b971c4967b706ad8/reinvent-2024-try-jp.jpg?w=3840&fm=webp)
[新機能プレビュー] Amazon Q in QuickSight Scenarios で既存のシナリオにデータをアップロードで追加してみた
この記事は公開されてから1年以上経過しています。情報が古い可能性がありますので、ご注意ください。
コーヒーが好きな emi です。
以下ブログで現在パブリックプレビュー中の Amazon Q in QuickSight Scenarios で新規シナリオの作成をやってみました。
データタブを見るとデータはいくつも追加でアップロードできそうに見えました。そこで、既存のデータファイルに追加で別のファイルを追加し、二つのデータを合わせた推論ができるか試してみました。
先に結果
複数データを跨ぐ推論が可能でした。
データを組み合わせた分析を行わせる場合は内部的にデータを結合するようなので、プライマリキーの型を一致させる必要がありそうです。
既存のシナリオ
[新機能プレビュー] Amazon Q in QuickSight Scenarios でアップロードした CSV ファイルに自然言語(英語)で質問し AI によるインサイトを得てみた | DevelopersIO で作成済みの既存のシナリオで試します。
既存のシナリオは Amazon Q in QuickSight でトピックを作成しデータセットに Q&A してみた | DevelopersIO で使った「部署ごとに保持しているお菓子の在庫」を記載した CSV ファイルをアップロードして作成しています。
CSV データを追加でアップロードする
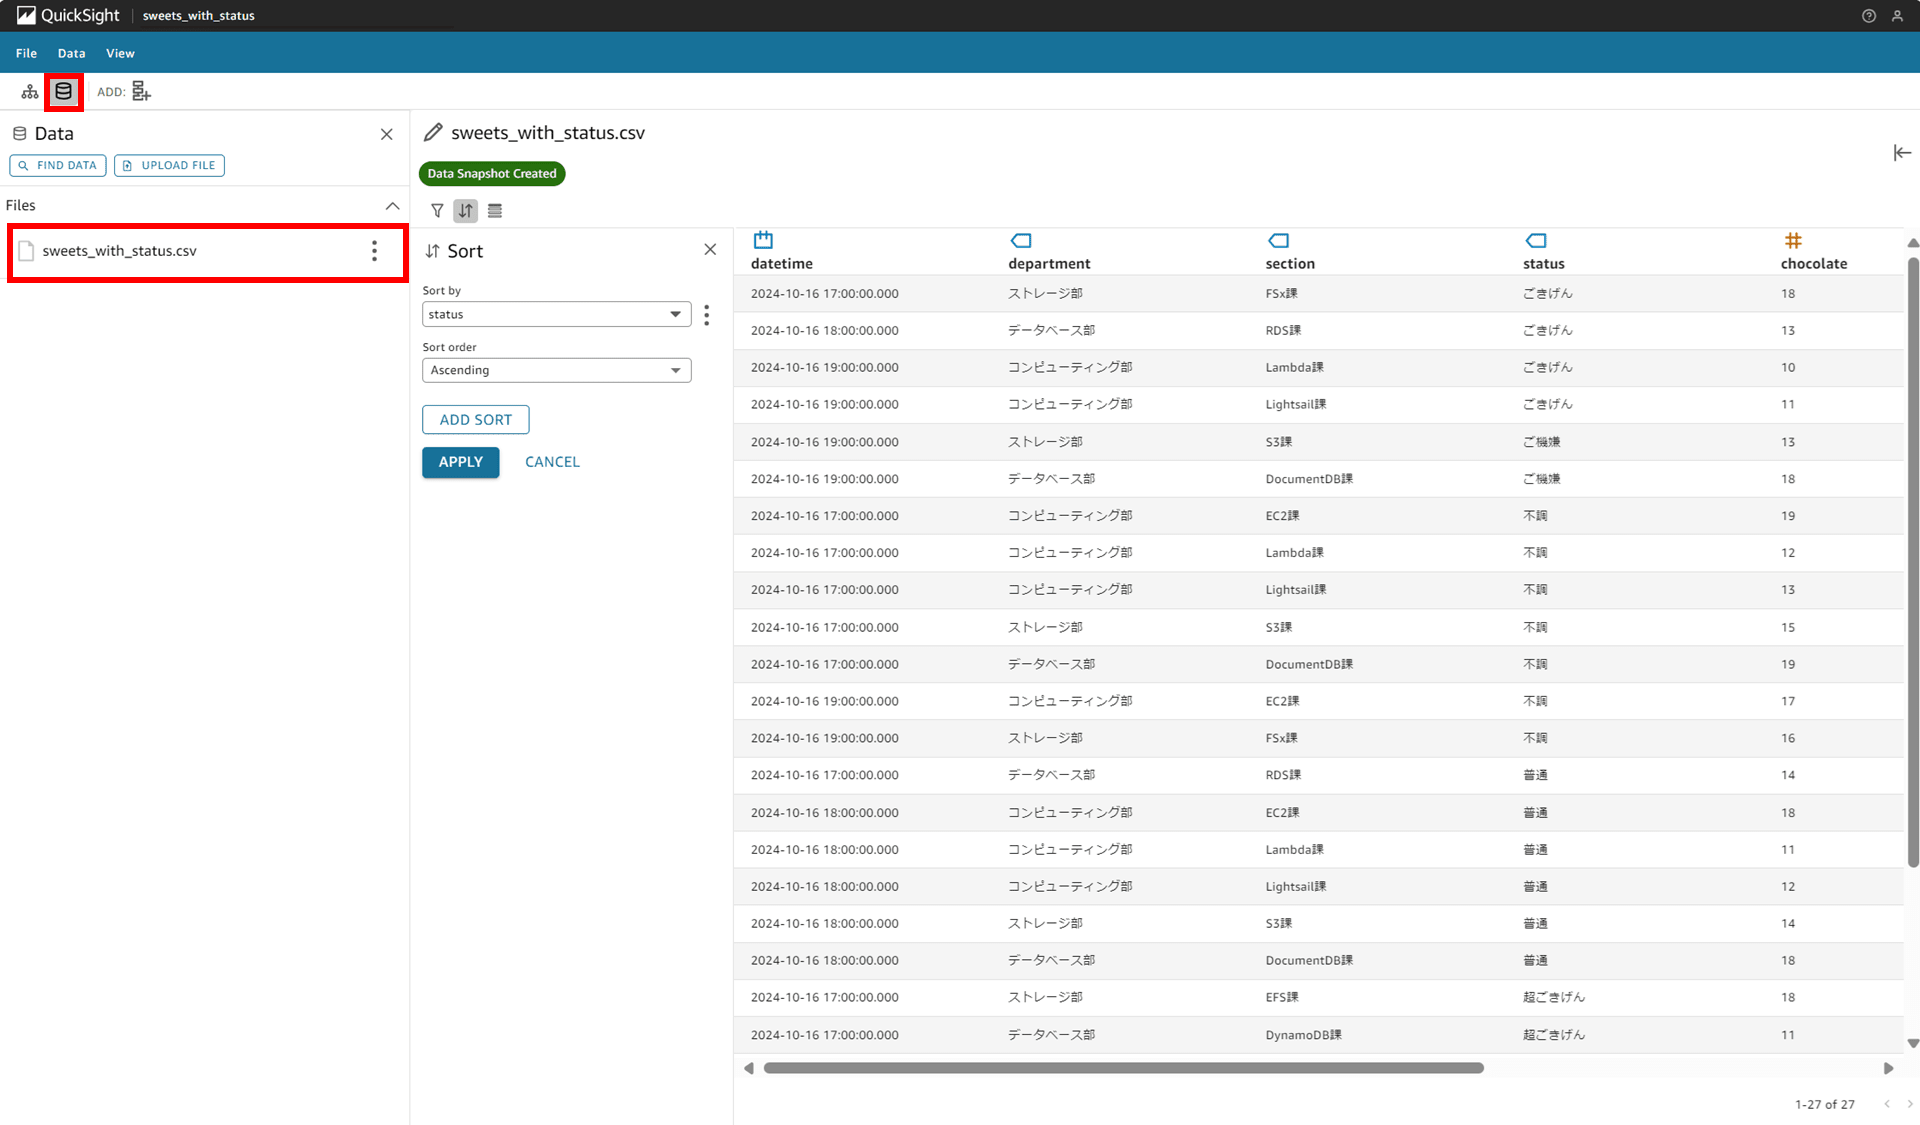
[新機能プレビュー] Amazon Q in QuickSight Scenarios でシナリオのデータをフィルタしたりソートしたりしてみた | DevelopersIO で少し型をいじったりしましたが、以下のような CSV データでシナリオを作成しています。
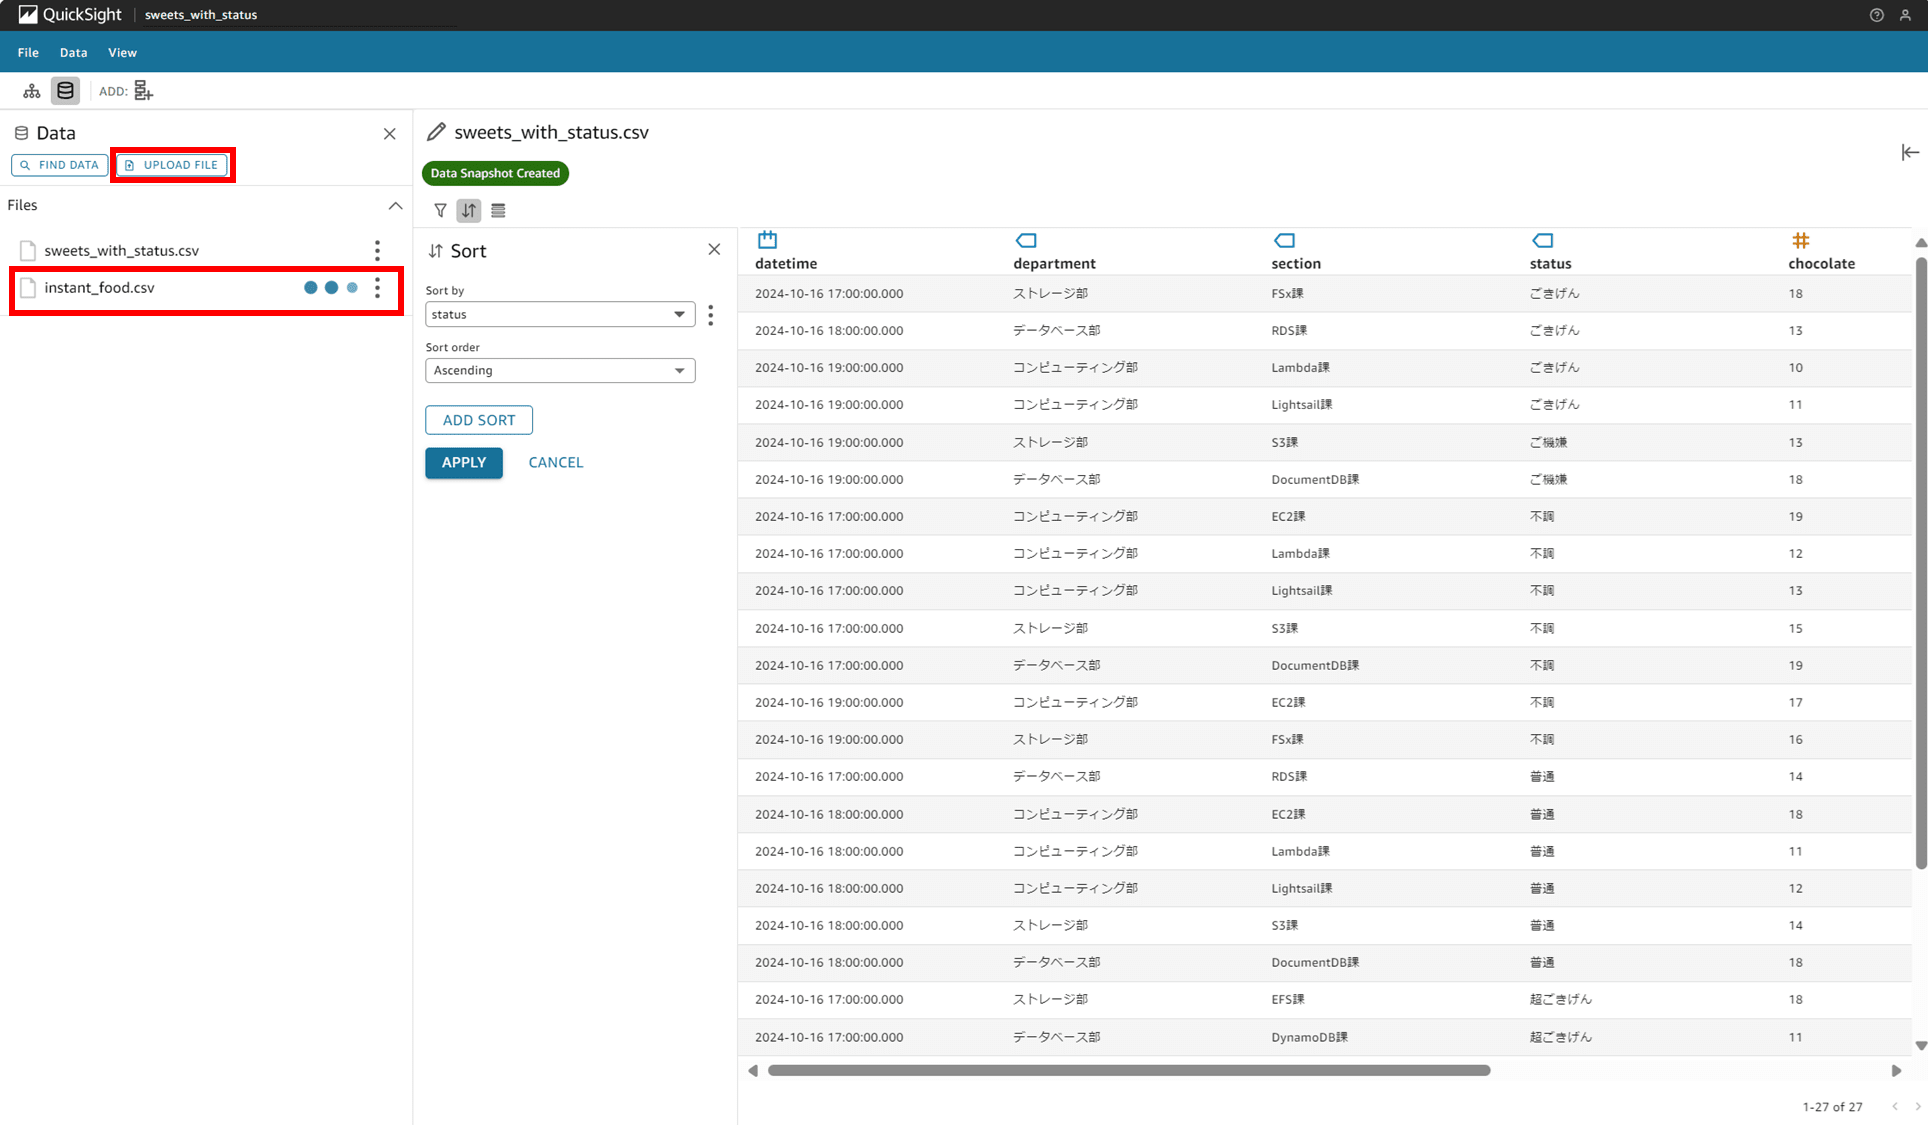
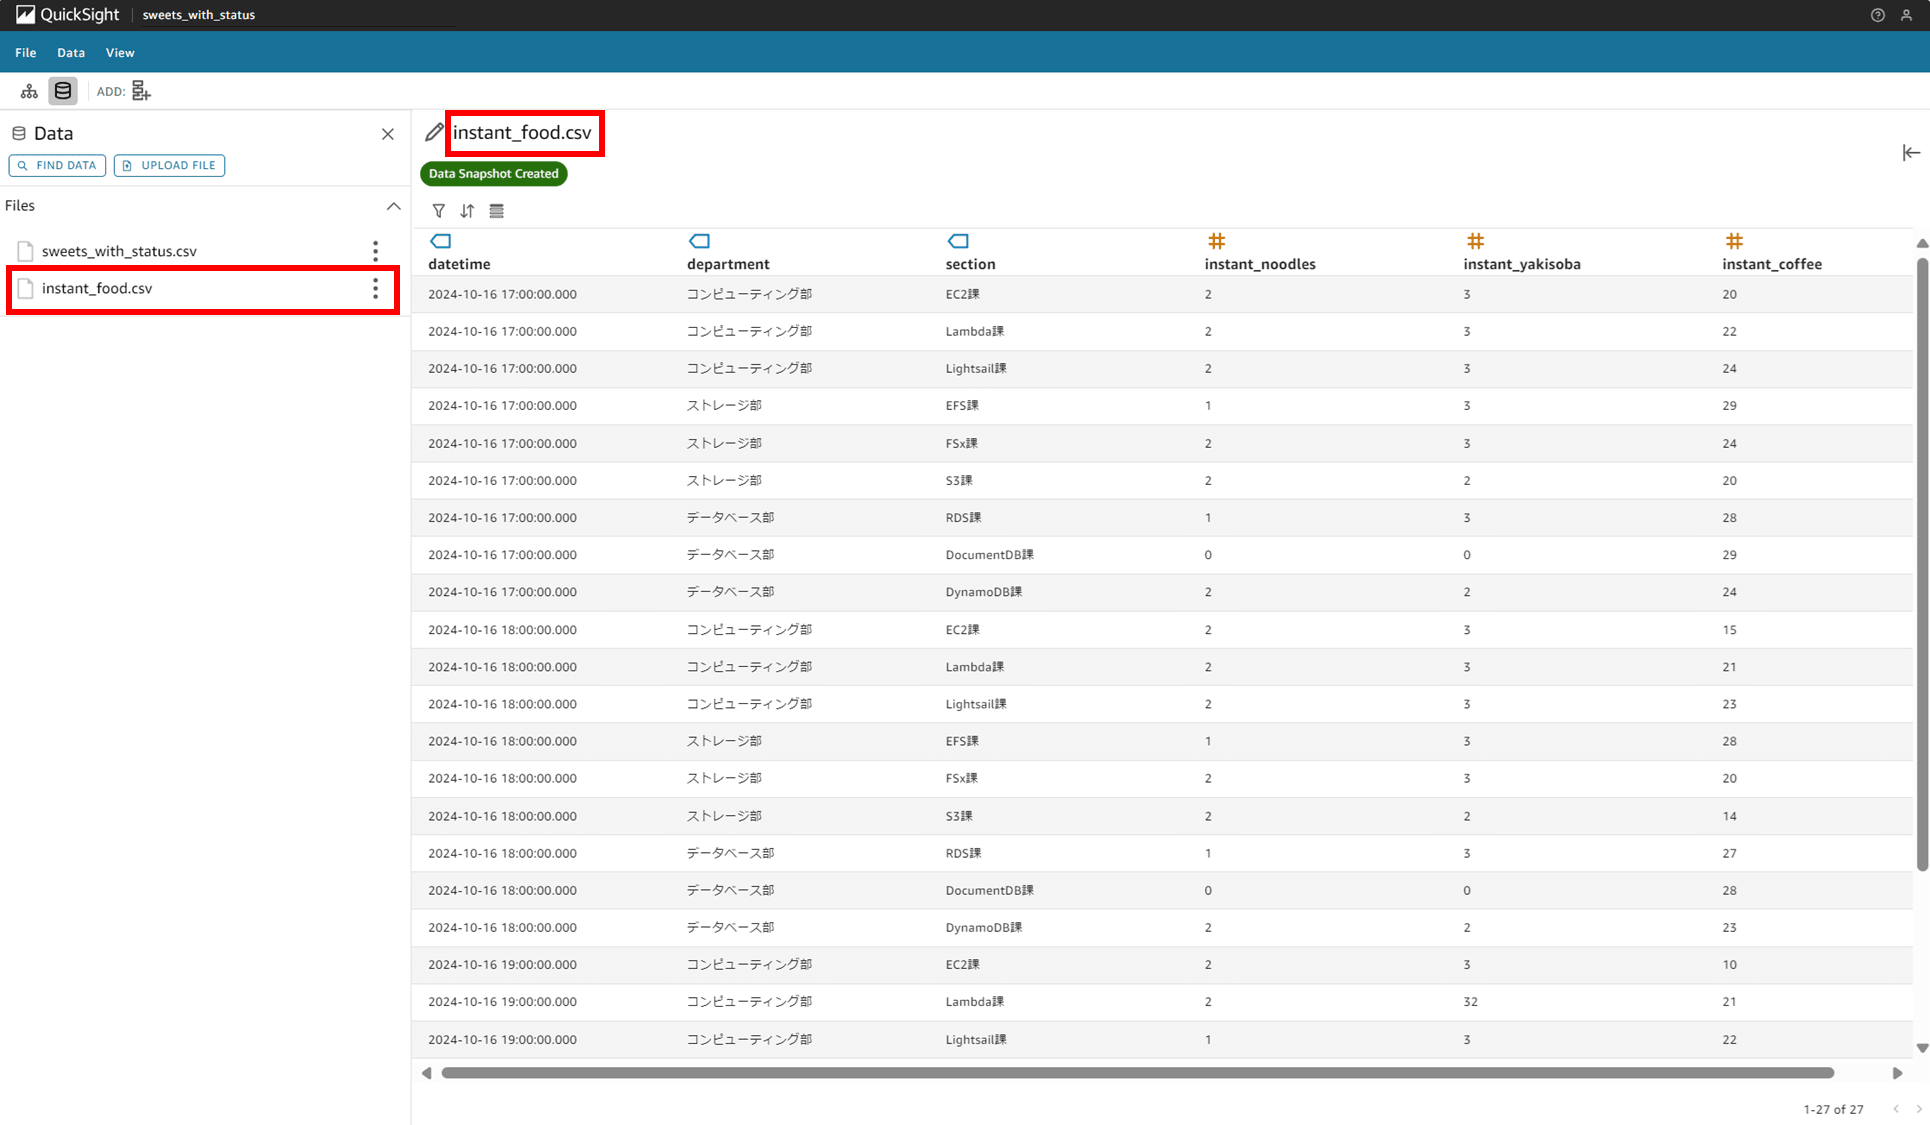
今回は「instant_food.csv」という CSV ファイルを追加でアップロードしました。約 2KB のファイルですが、アップロードは数秒で終わりました。
追加したデータと既存のデータ両方に関連するプロンプトを入力する
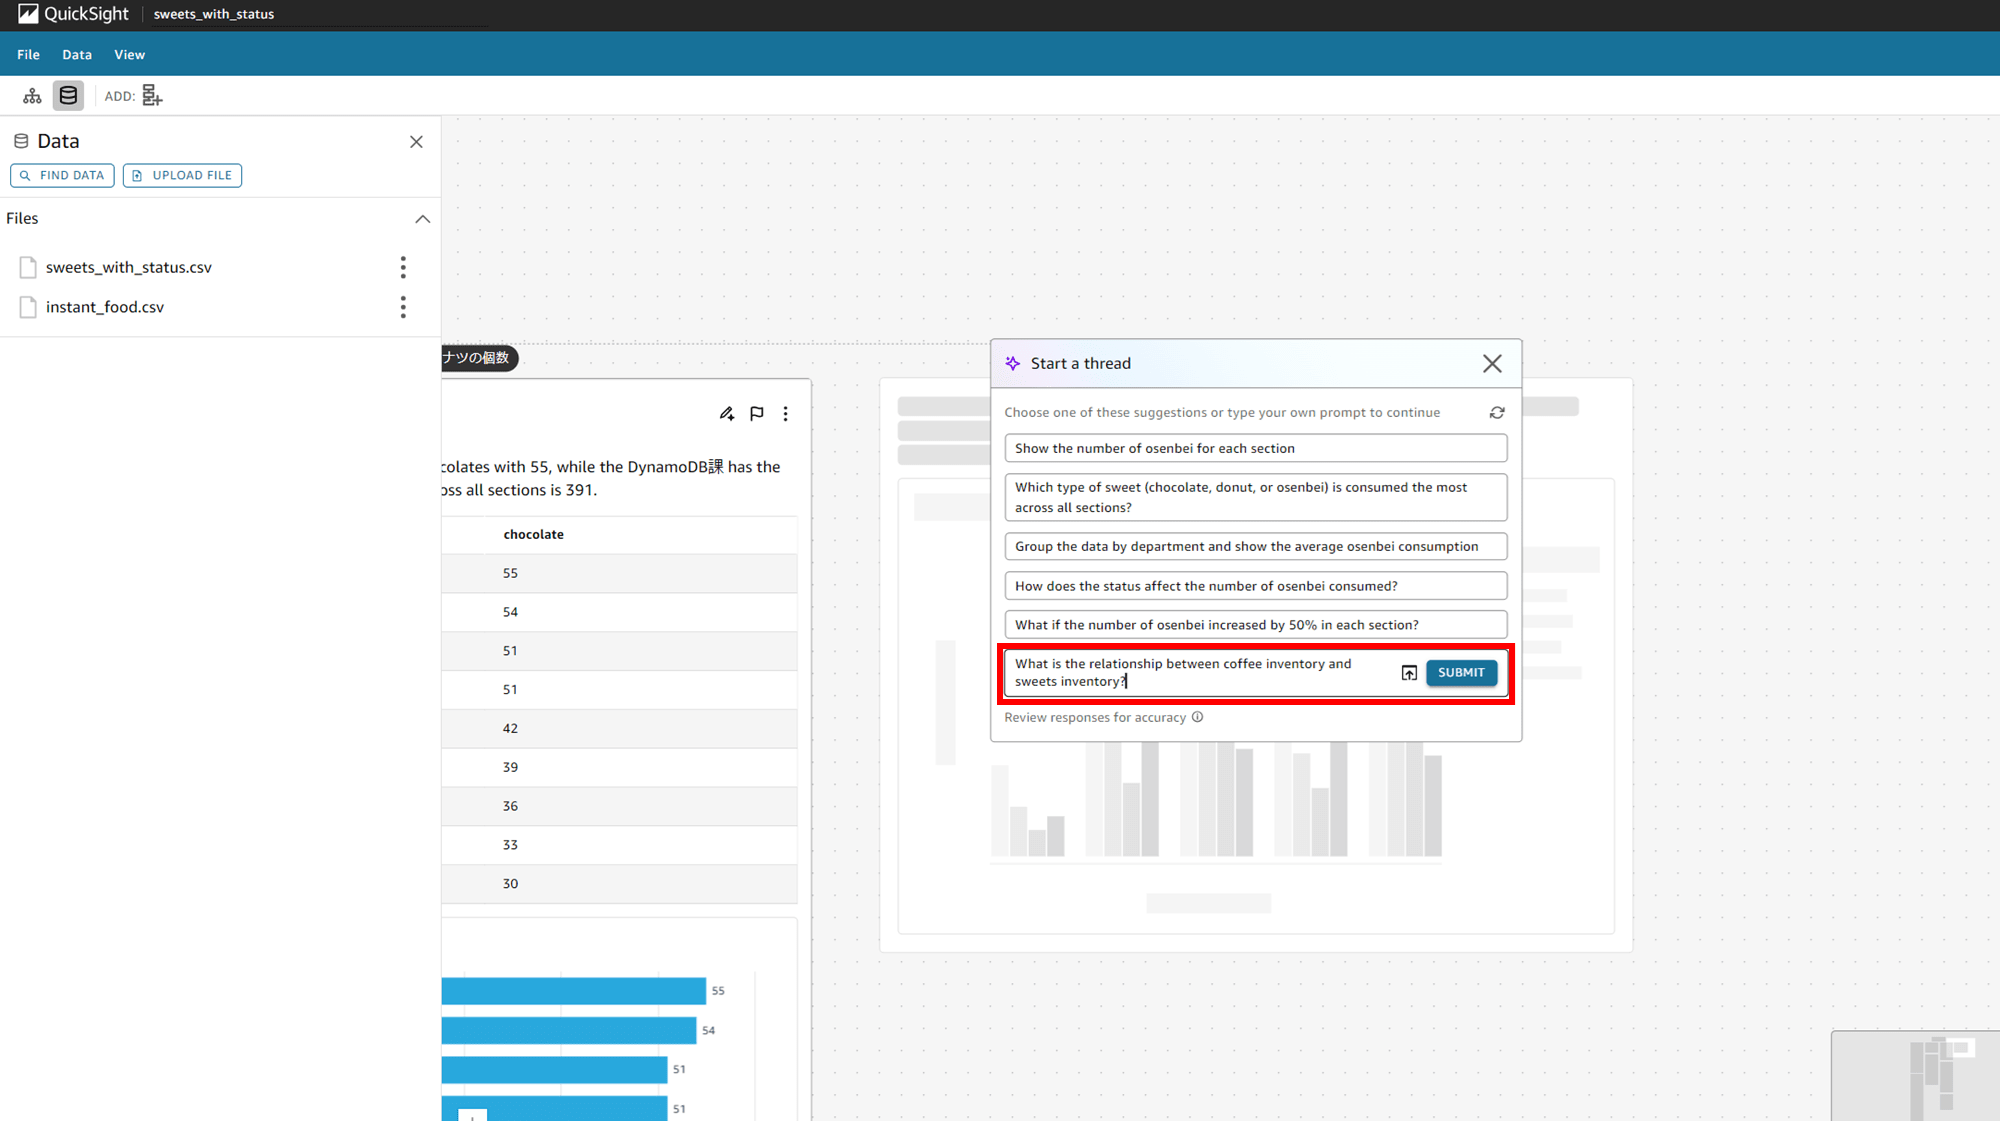
ではシナリオ側でプロンプトを入力します。
「What is the relationship between coffee inventory and sweets inventory?(コーヒーの在庫と sweets の在庫の関係は?)」
と入力しました。
途中経過として以下が出力されました。
Step 1: Combine the coffee and sweets inventory data into a single dataset for analysis.
(機械翻訳)ステップ 1:コーヒーとスイーツのインベントリデータを 1 つのデータセットに統合し、分析する。
どうやら内部で二つの CSV ファイルのデータを結合しようとしているみたいです。
1 分ほど待ち、推論が終わると以下のようになりました。
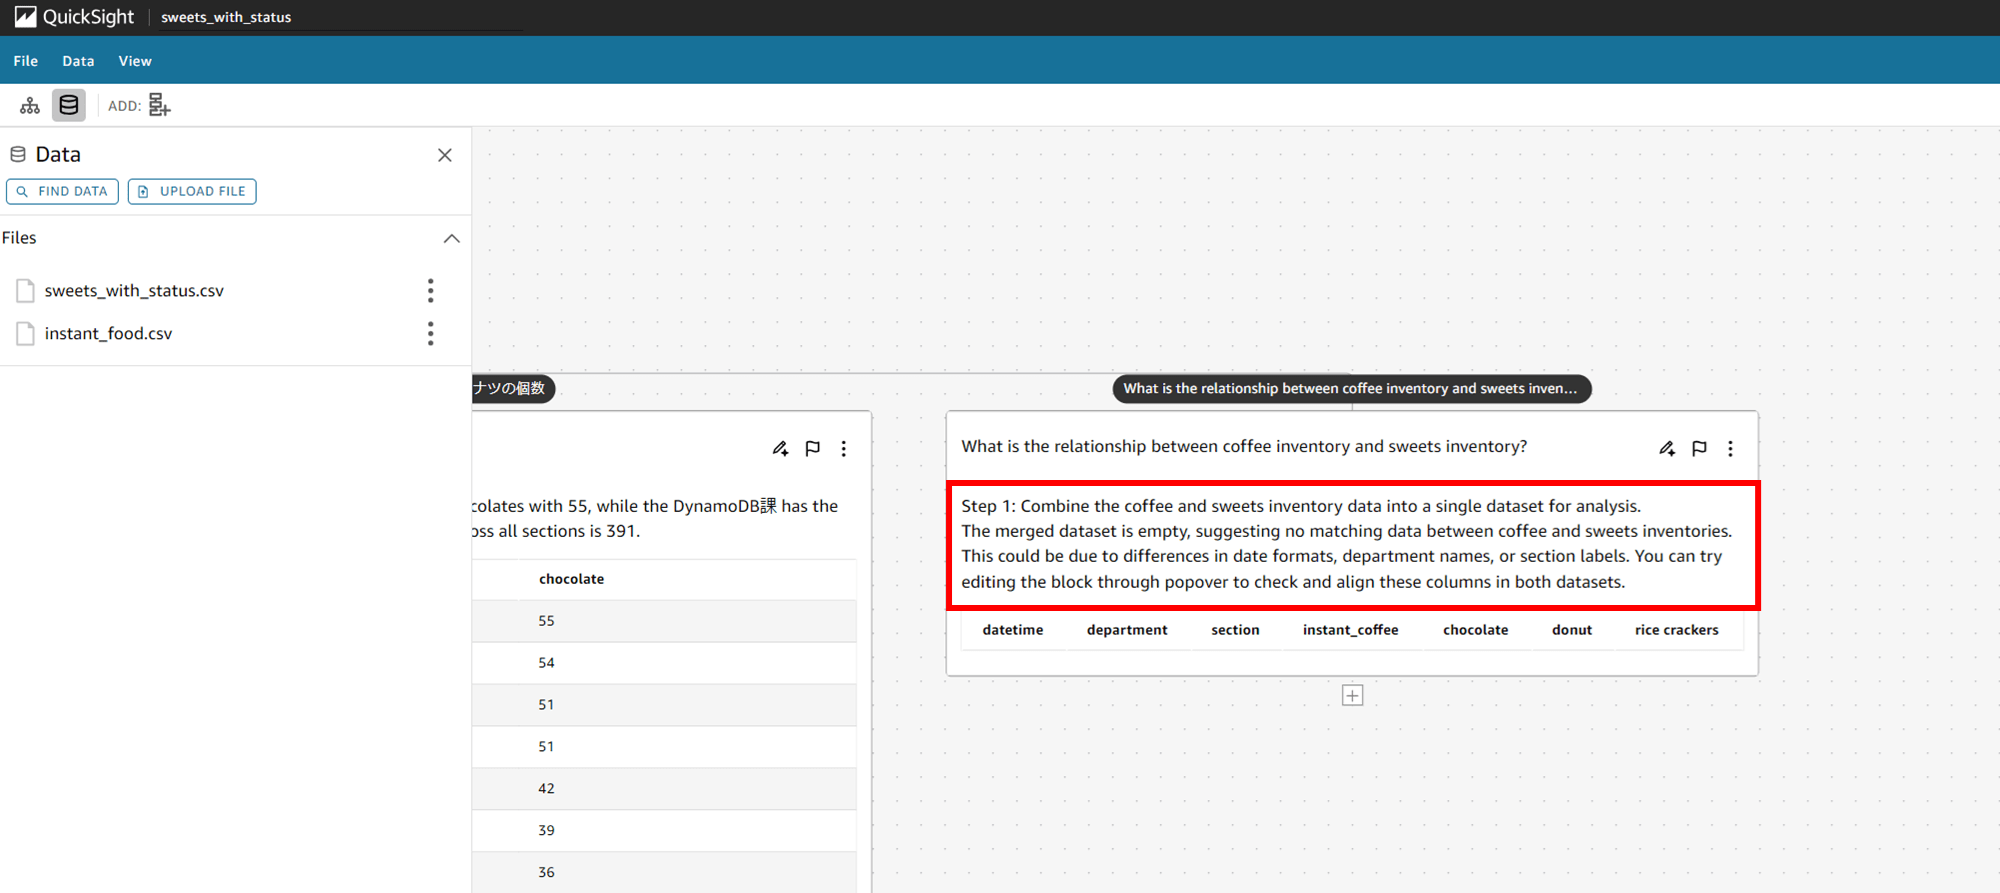
The merged dataset is empty, suggesting no matching data between coffee and sweets inventories. This could be due to differences in date formats, department names, or section labels. You can try editing the block through popover to check and align these columns in both datasets.
(機械翻訳)結合されたデータセットは空であり、コーヒーと菓子の在庫データが一致しないことを示唆する。これは、日付フォーマット、部署名、セクションラベルの違いによる可能性があります。ポップオーバーでブロックを編集して、両方のデータセットでこれらの列をチェックし、整列させてみてください。
なるほど。データがうまく結合できないようです。
追加したデータの型を修正
データを確認します。
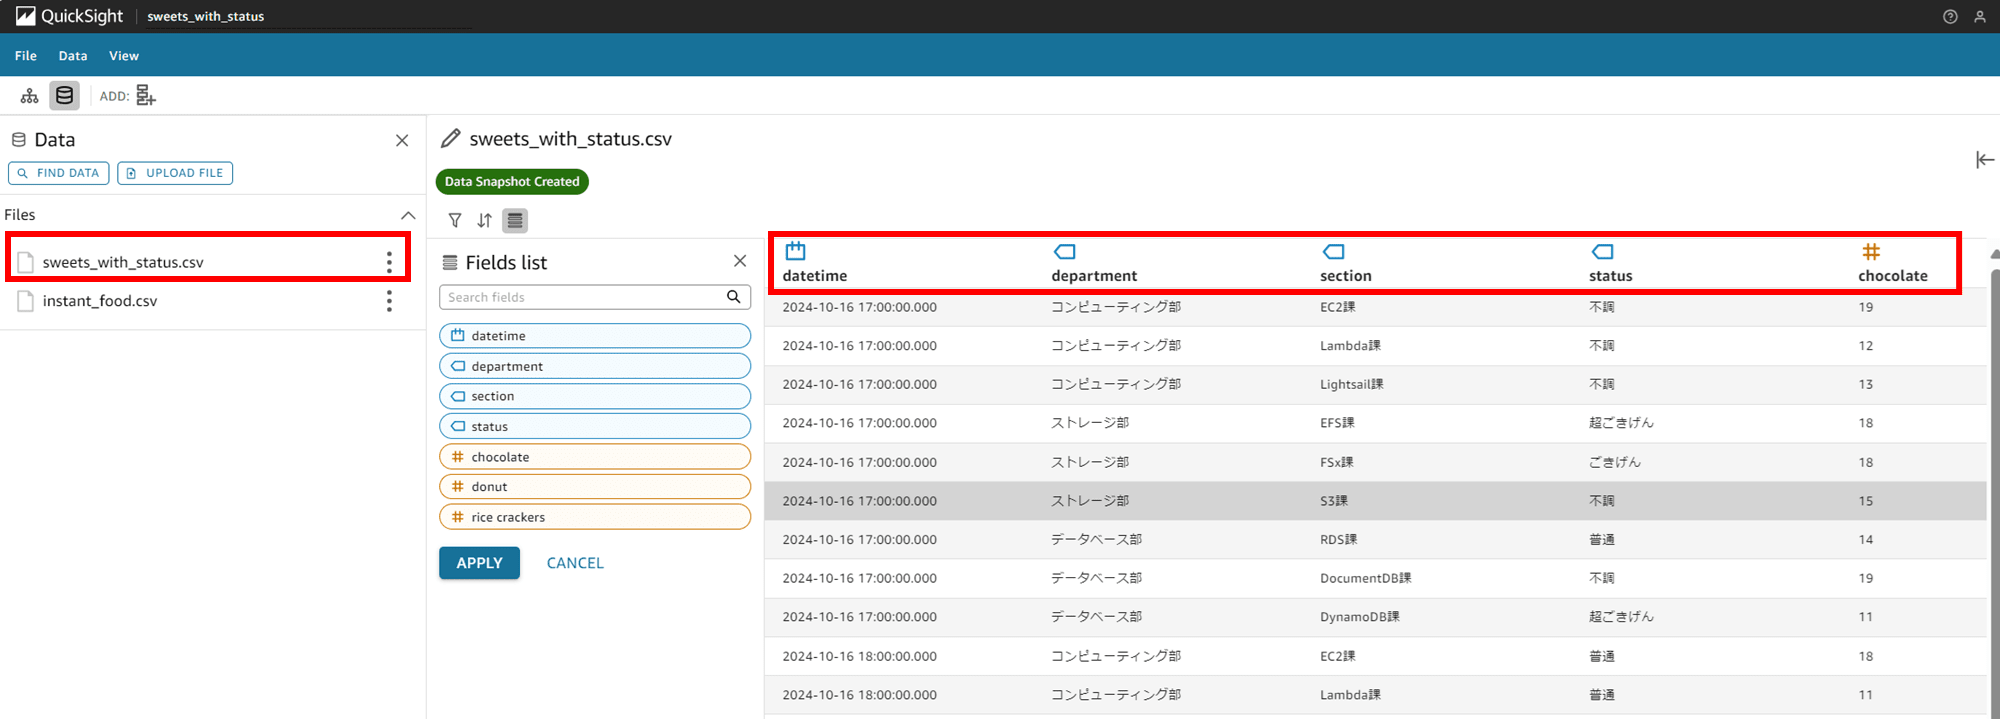
「sweets_with_status.csv」に対して 3. Fields list で Change data type の操作を実行し datetaime の型を String 型から date 型に変えたのが原因かもしれません。
「instant_food.csv」でも同様に、datetaime の型を String 型から date 型に変更します。
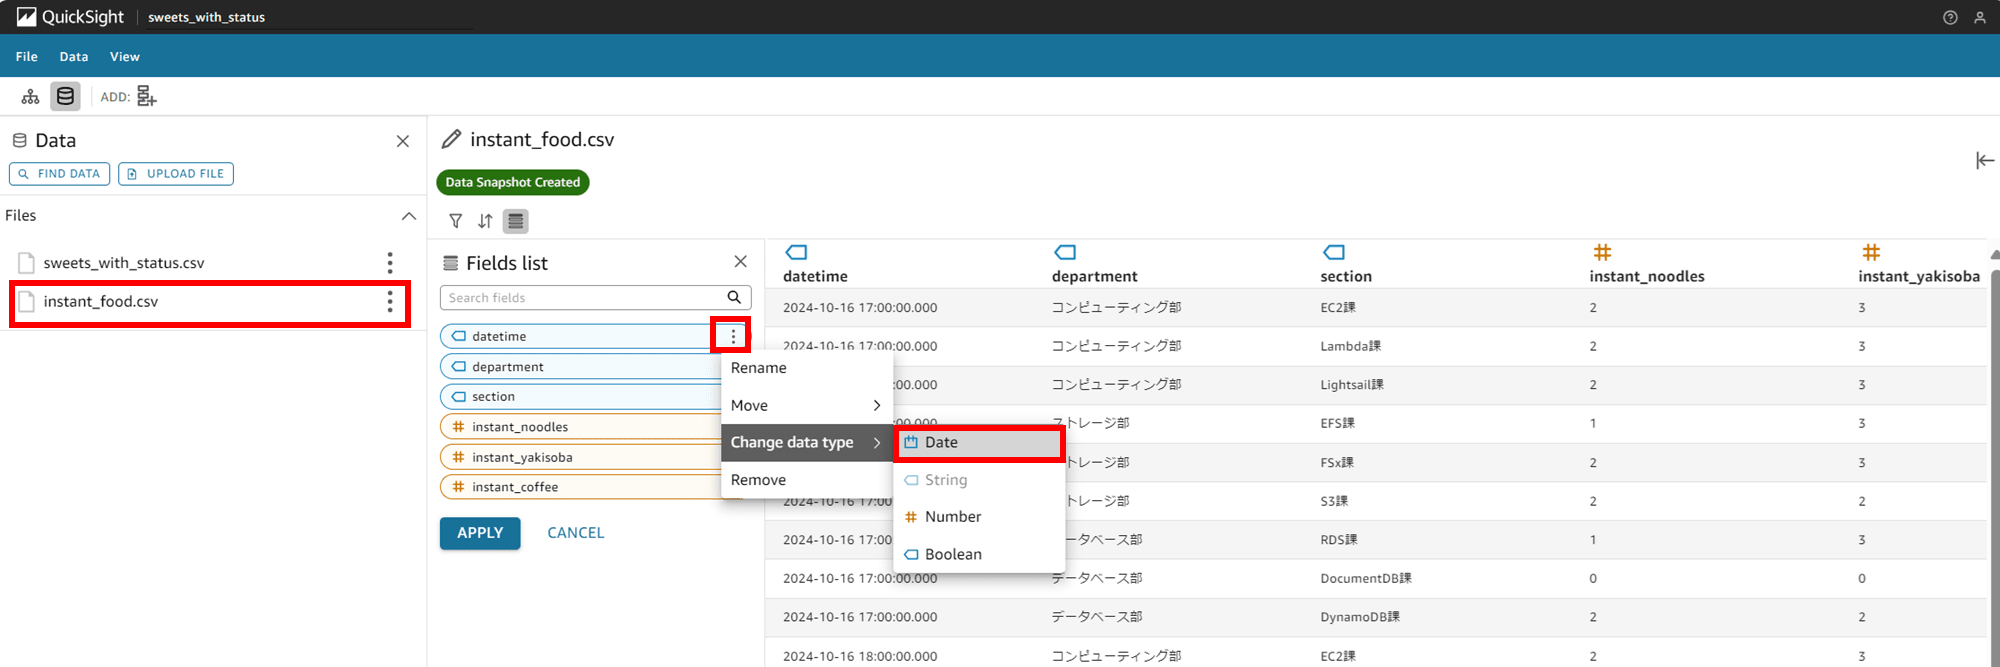
APPLY で変更を保存します。
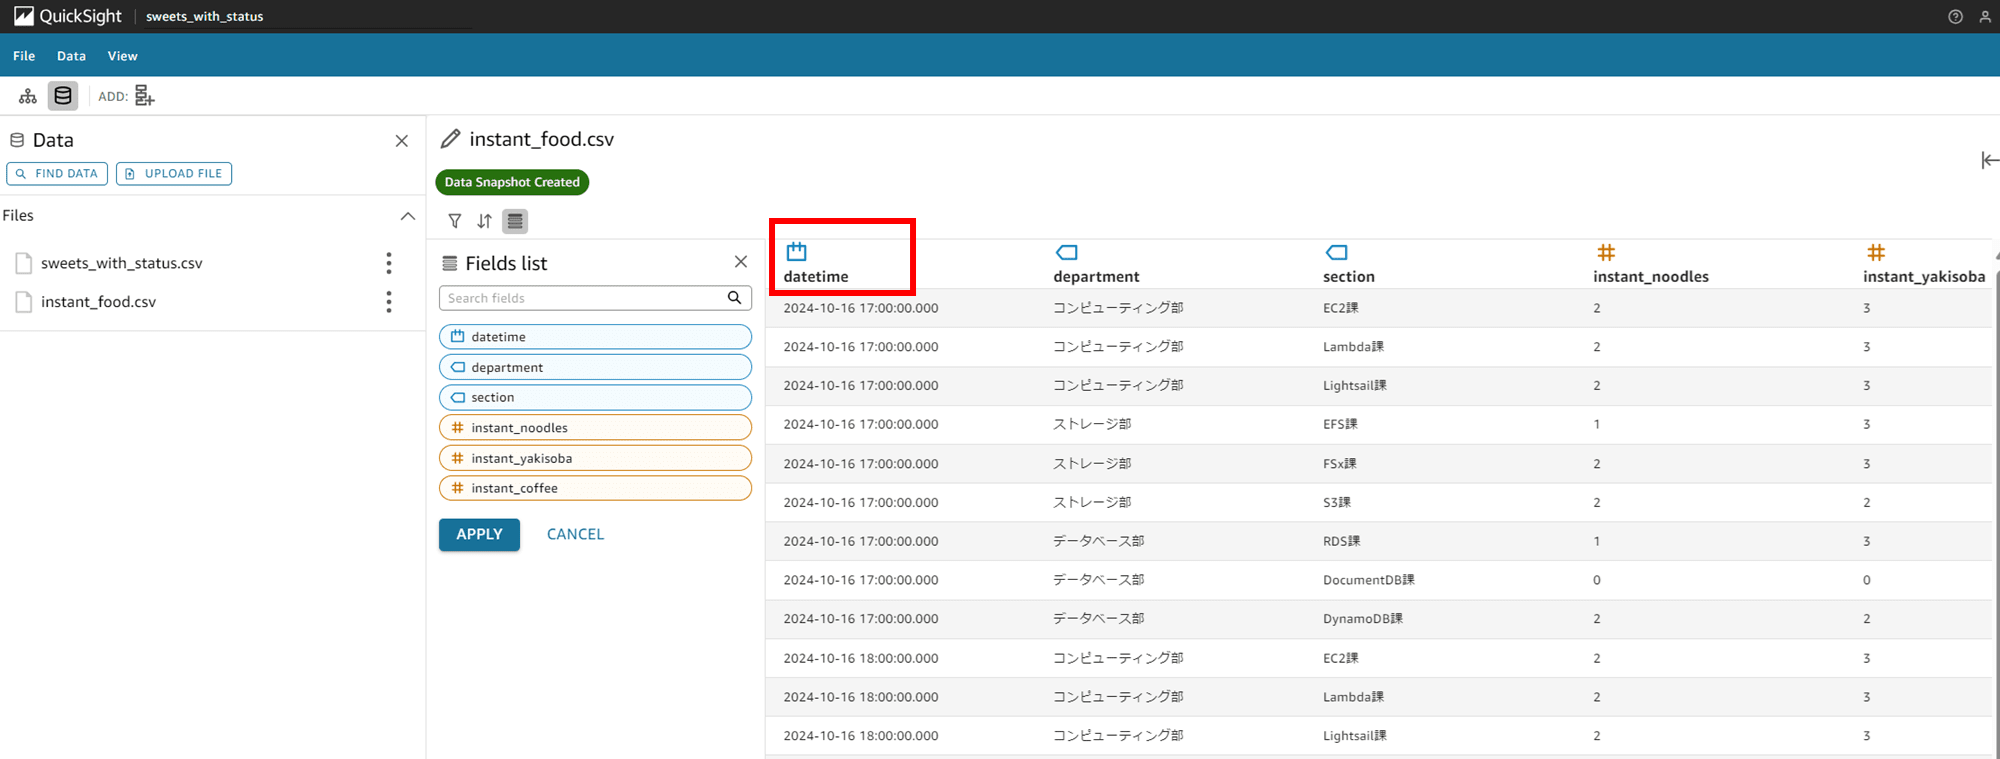
推論を再試行
再度シナリオに戻り、先ほどのブロックを Modify block で編集します。プロンプトは先ほどと同じ
「What is the relationship between coffee inventory and sweets inventory?(コーヒーの在庫と sweets の在庫の関係は?)」
としました。
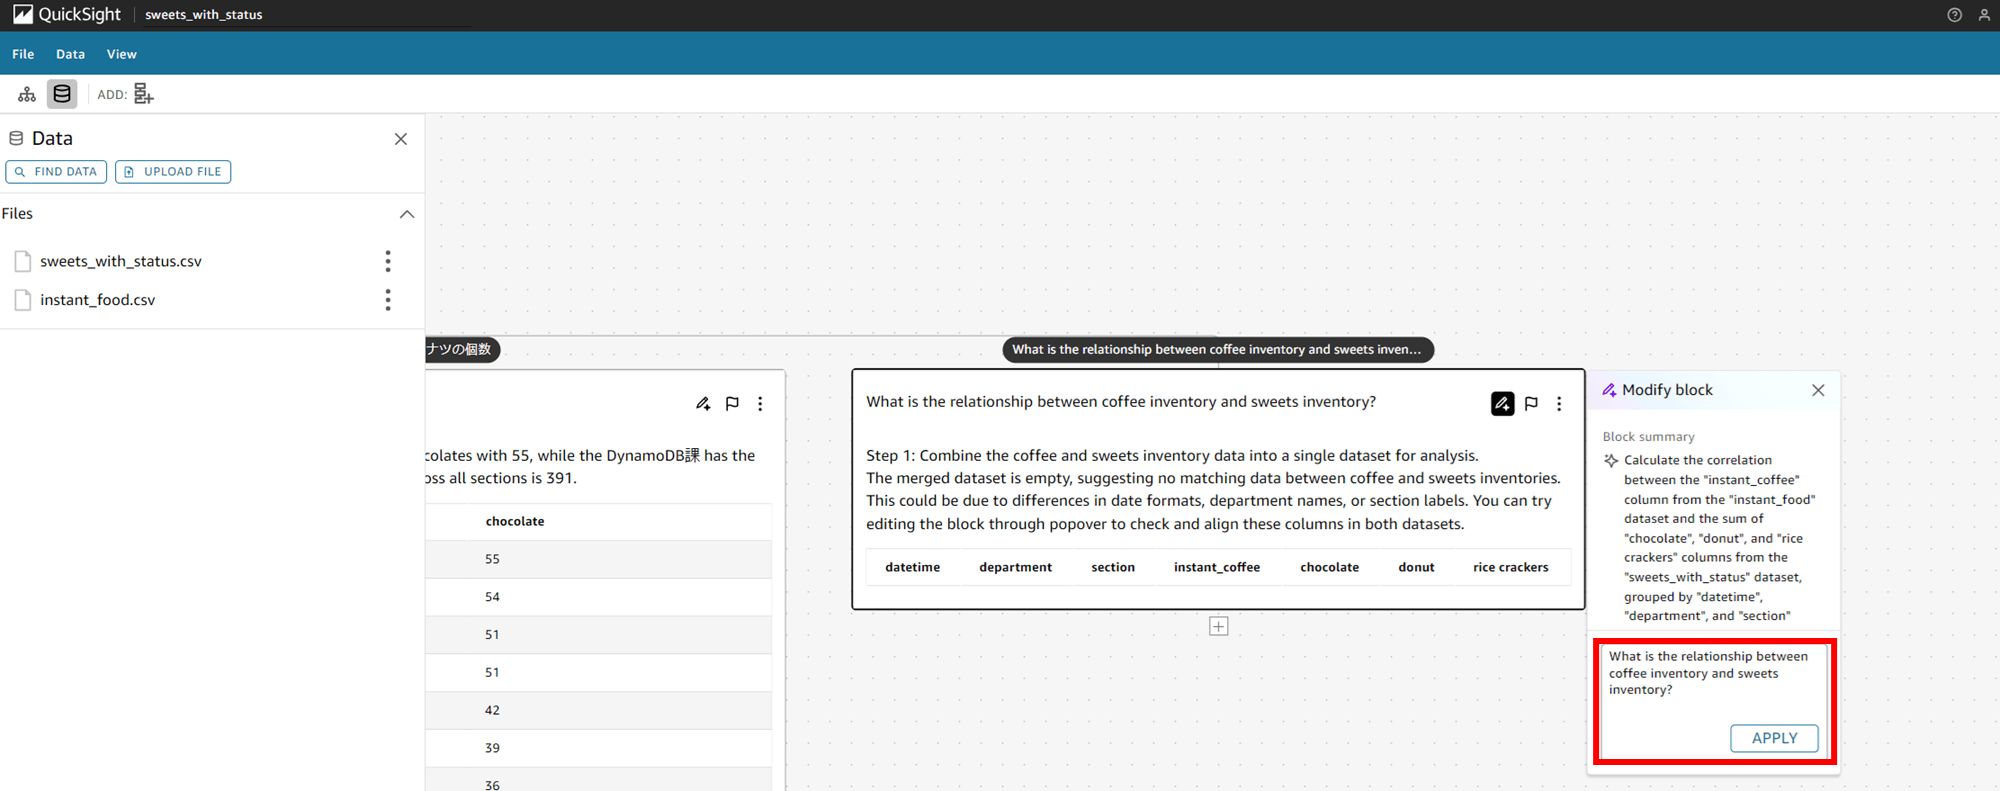
推論で 3 分ほど待った途中経過
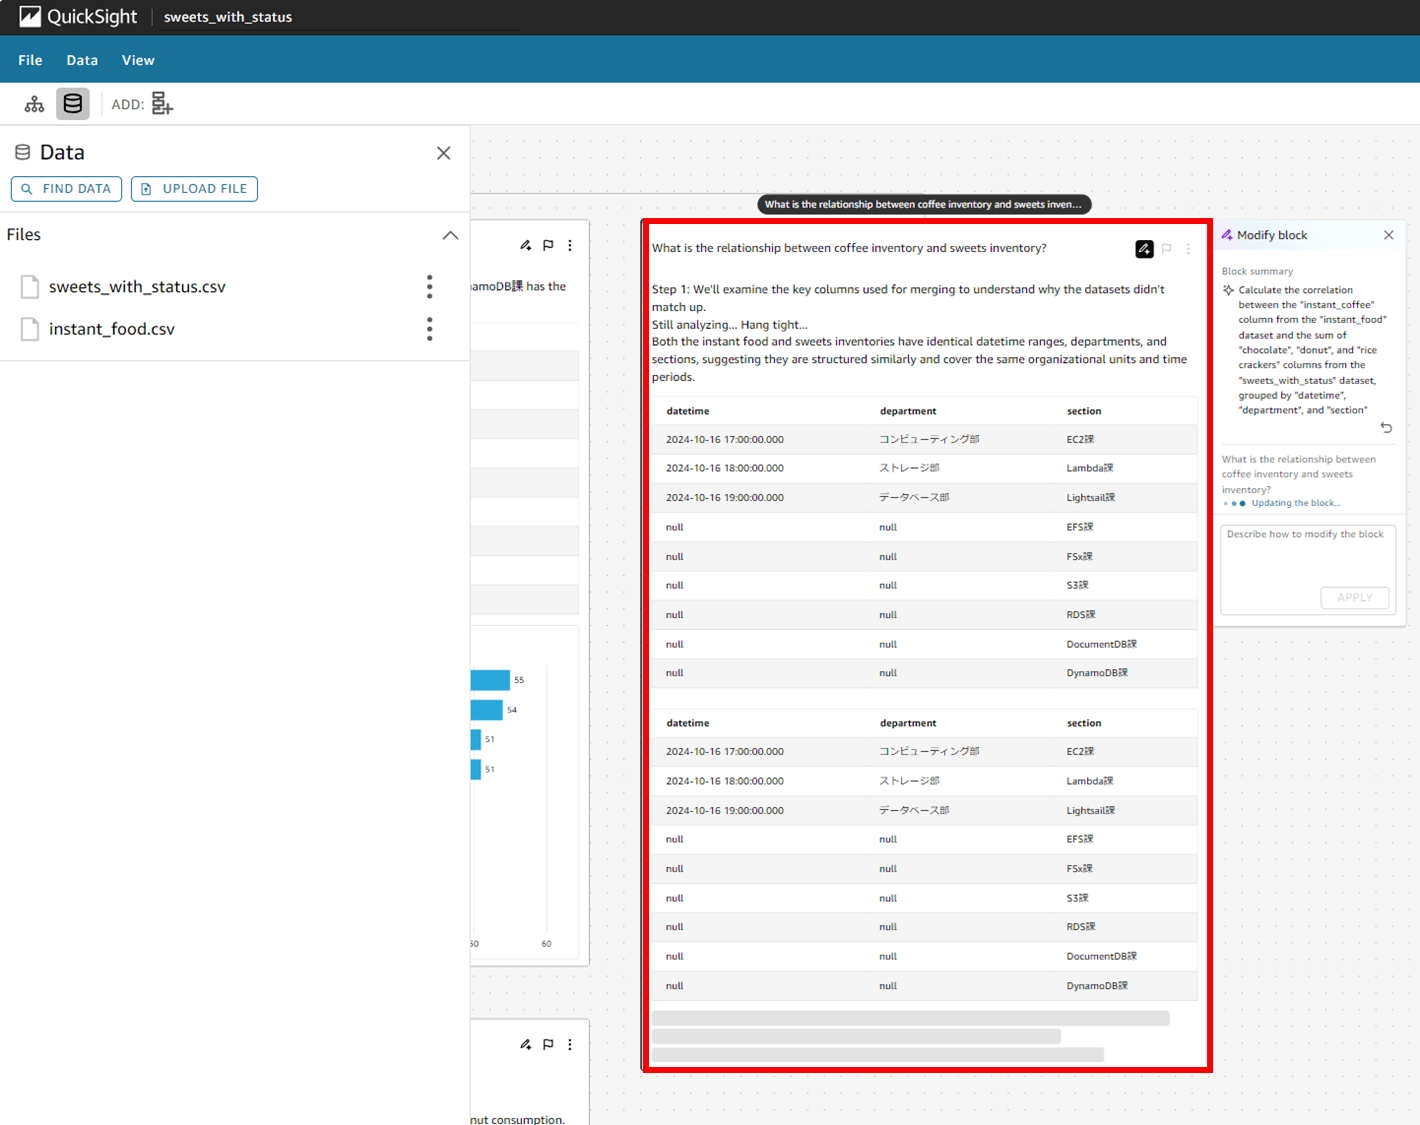
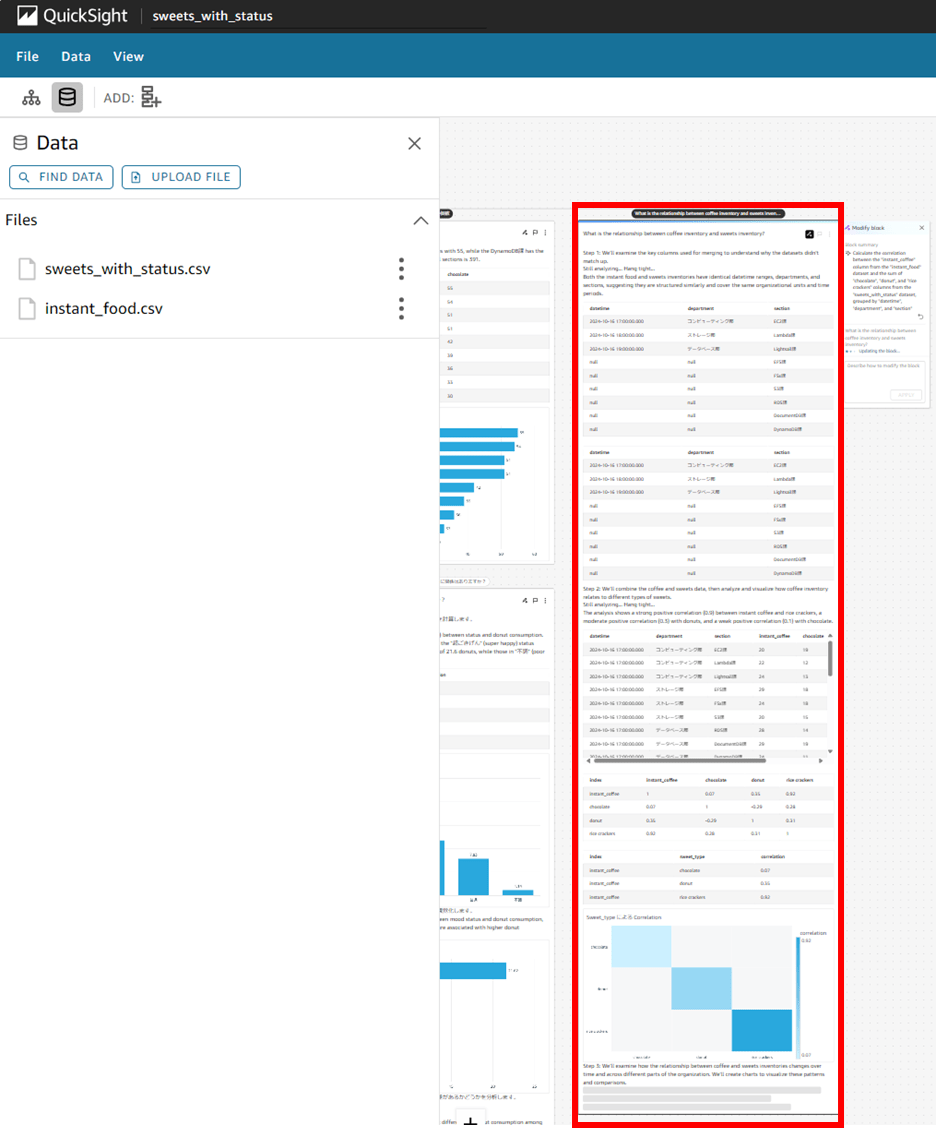
1 ブロックが長いですね。全体表示するとすごくちっちゃくなってしまいます。
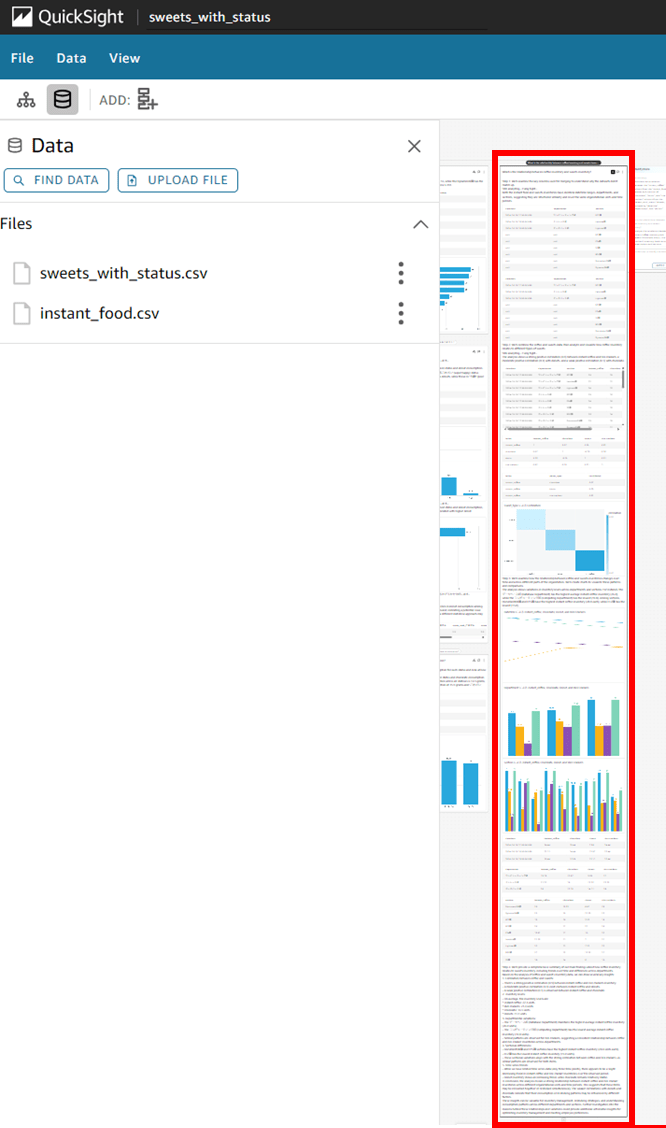
結果を見ていきます。
▼ Step1 ではデータカラムの構造を確認しているようです。
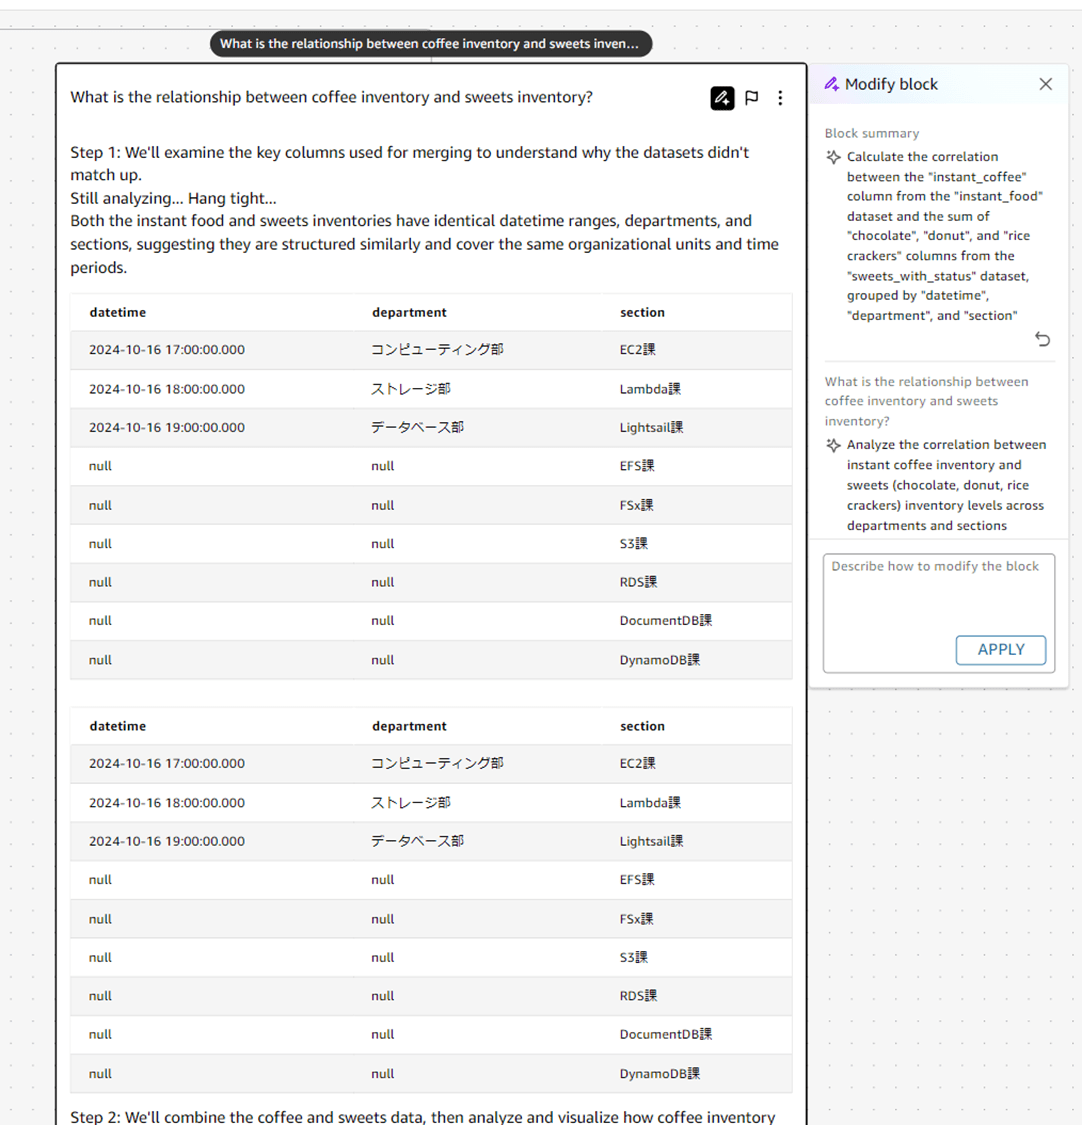
Step 1: We'll examine the key columns used for merging to understand why the datasets didn't match up.
Still analyzing... Hang tight...
Both the instant food and sweets inventories have identical datetime ranges, departments, and sections, suggesting they are structured similarly and cover the same organizational units and time periods.
(機械翻訳)ステップ1:データセットが一致しなかった理由を理解するために、マージに使われた主要な列を調べる。
まだ分析中... まだ分析中...
インスタント食品とお菓子のインベントリは、日付の範囲、部門、セクションが同じである。
▼ Step2 ではコーヒーとお菓子のデータを組み合わせ、相関関係を視覚化しています。
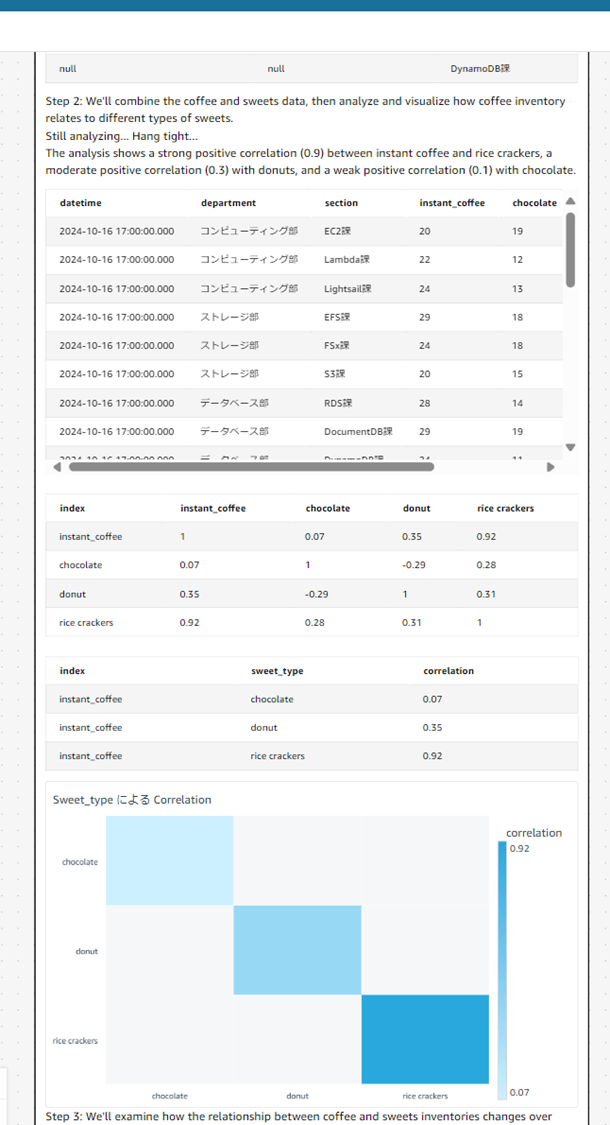
Step 2: We'll combine the coffee and sweets data, then analyze and visualize how coffee inventory relates to different types of sweets.
Still analyzing... Hang tight...
The analysis shows a strong positive correlation (0.9) between instant coffee and rice crackers, a moderate positive correlation (0.3) with donuts, and a weak positive correlation (0.1) with chocolate.
(機械翻訳)ステップ2:コーヒーとお菓子のデータを組み合わせ、コーヒーの在庫とお菓子の種類との関係を分析し、視覚化する。
まだ分析中... もう少し待って...
分析の結果、インスタントコーヒーとおせんべいには強い正の相関(0.9)、ドーナツには中程度の正の相関(0.3)、チョコレートには弱い正の相関(0.1)が見られた。
相関関係を数値で計算してくれており、図も表示してくれています。
▼ Step3 では更に時間経過とともに在庫がどのように変化しているかチャートを作成してくれています。
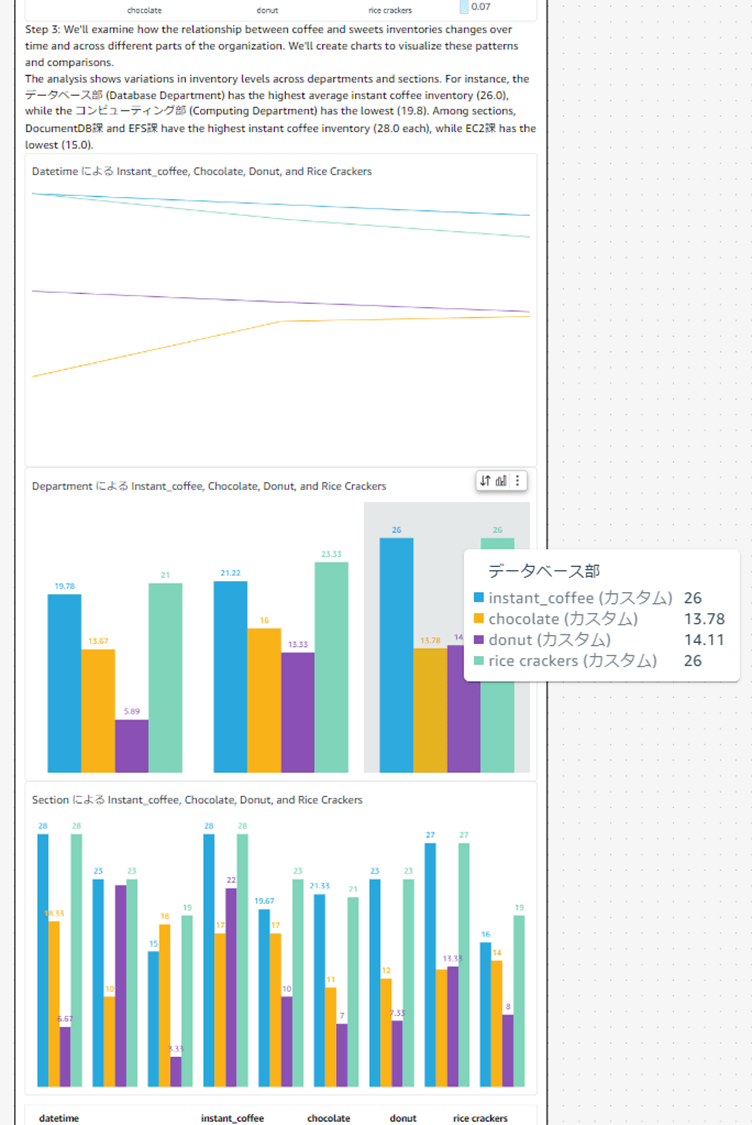
Step 3: We'll examine how the relationship between coffee and sweets inventories changes over time and across different parts of the organization. We'll create charts to visualize these patterns and comparisons.
The analysis shows variations in inventory levels across departments and sections. For instance, the データベース部 (Database Department) has the highest average instant coffee inventory (26.0), while the コンピューティング部 (Computing Department) has the lowest (19.8). Among sections, DocumentDB課 and EFS課 have the highest instant coffee inventory (28.0 each), while EC2課 has the lowest (15.0).
(機械翻訳)ステップ3:コーヒーとお菓子の在庫の関係が、時間の経過とともに、また組織のさまざまな部分でどのように変化するかを調べる。これらのパターンと比較を視覚化するためにチャートを作成する。分析の結果、部門やセクションによって在庫水準にばらつきがあることがわかる。例えば、データベース部(Database Department)のインスタントコーヒーの平均在庫は 26.0 と最も高く、コンピューティング部(Computing Department)は 19.8 と最も低い。セクション別では、DocumentDB課とEFS課のインスタントコーヒー在庫が最も高く(各28.0)、EC2課が最も低い(15.0)。
私がデータ自体を深く考えずランダムに作成してしまったので、あまり目立つ相関関係や推移は出ていません…
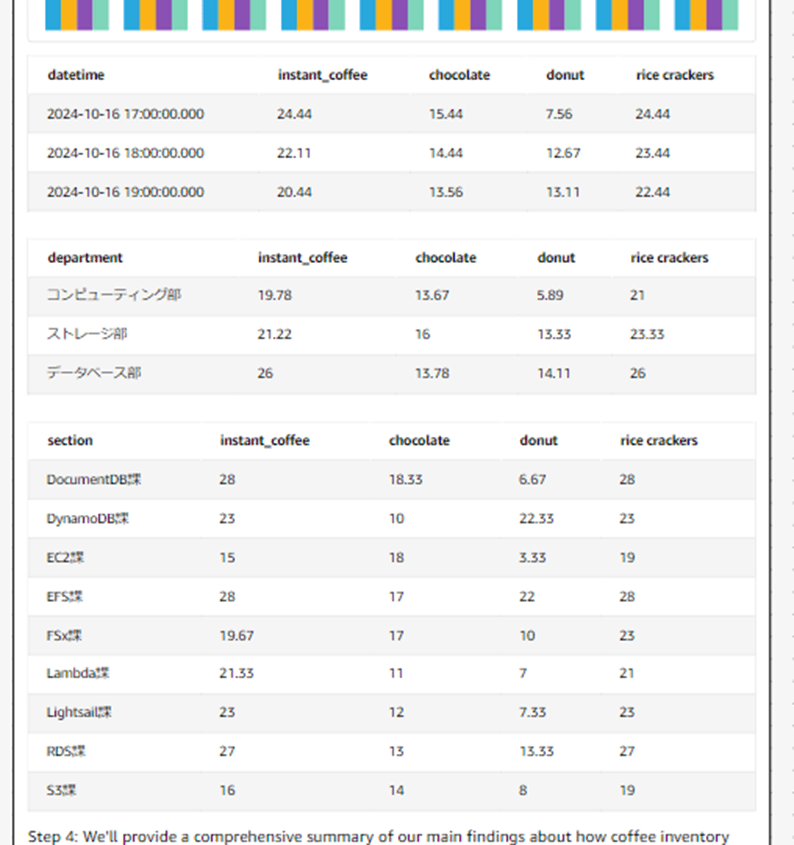
▼ Step4 では上記の分析で分かったことをまとめて、結論を述べています。
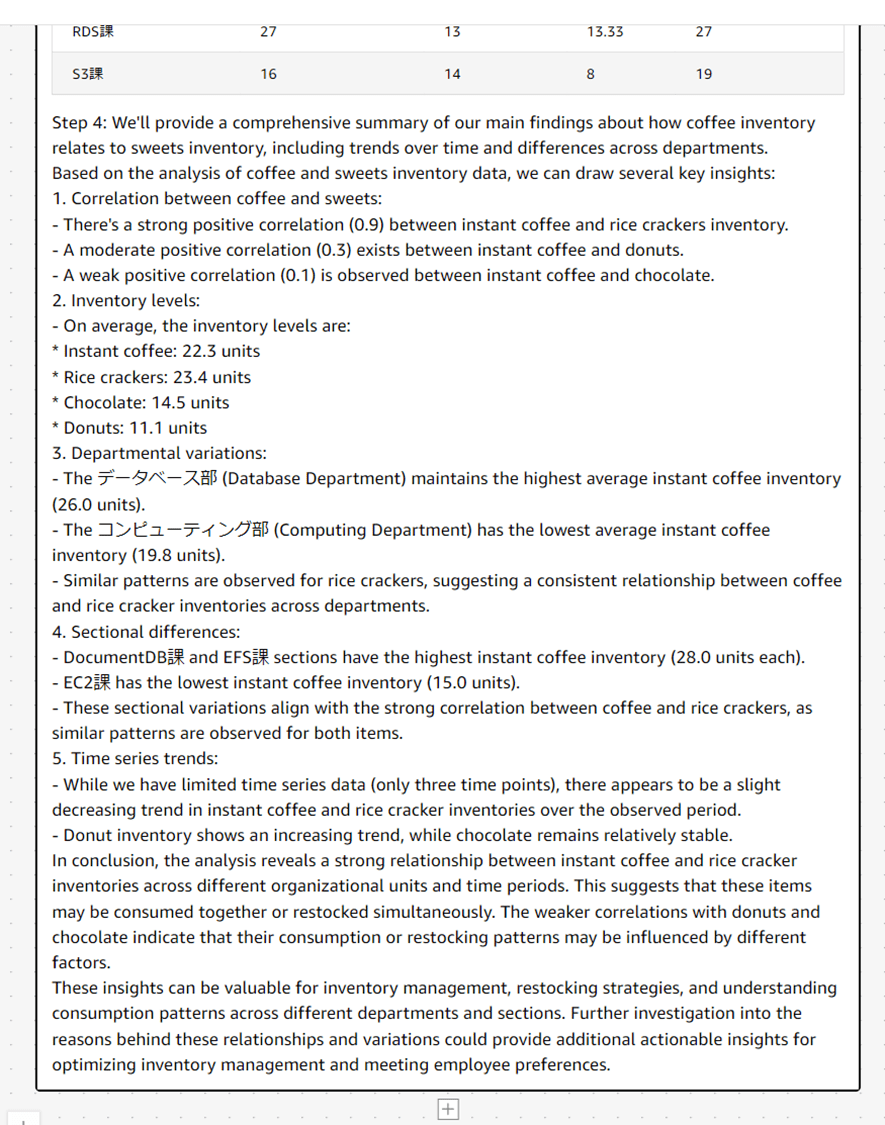
調査結果のまとめ
Step 4: We'll provide a comprehensive summary of our main findings about how coffee inventory relates to sweets inventory, including trends over time and differences across departments.
Based on the analysis of coffee and sweets inventory data, we can draw several key insights:
(機械翻訳)ステップ4:コーヒー在庫とスイーツ在庫の関係について、時系列での傾向や部門間の違いなど、主な調査結果を包括的にまとめる。コーヒーとスイーツの在庫データの分析から、いくつかの重要な洞察を得ることができる:
- Correlation between coffee and sweets:
- There's a strong positive correlation (0.9) between instant coffee and rice crackers inventory.
- A moderate positive correlation (0.3) exists between instant coffee and donuts.
- A weak positive correlation (0.1) is observed between instant coffee and chocolate.
(機械翻訳)1. コーヒーとスイーツの相関関係:- コーヒーとお菓子の相関関係:インスタントコーヒーとおせんべいの在庫には強い正の相関関係(0.9)がある。- インスタントコーヒーとドーナツの間には中程度の正の相関(0.3)がある。- インスタントコーヒーとチョコレートの間には弱い正の相関(0.1)が見られる。
- Inventory levels:
- On average, the inventory levels are:
- Instant coffee: 22.3 units
- Rice crackers: 23.4 units
- Chocolate: 14.5 units
- Donuts: 11.1 units
(機械翻訳)2. 在庫水準:- 平均的な在庫水準は以下の通りである:* インスタントコーヒー:22.3個* 米菓:23.4個* チョコレート 14.5個* ドーナツ:11.1個
- Departmental variations:
- The データベース部 (Database Department) maintains the highest average instant coffee inventory (26.0 units).
- The コンピューティング部 (Computing Department) has the lowest average instant coffee inventory (19.8 units).
- Similar patterns are observed for rice crackers, suggesting a consistent relationship between coffee and rice cracker inventories across departments.
(機械翻訳)3. 部門別バリエーション
インスタントコーヒーの平均在庫が最も多いのは、データベース部(26.0 個)である。- インスタントコーヒーの平均在庫が最も少ないのは、コンピューティング部である(19.8 個)。- 米菓についても同様のパターンが観察され、コーヒーと米菓の在庫には部門間で一貫した関係があることが示唆される。
- Sectional differences:
- DocumentDB課 and EFS課 sections have the highest instant coffee inventory (28.0 units each).
- EC2課 has the lowest instant coffee inventory (15.0 units).
- These sectional variations align with the strong correlation between coffee and rice crackers, as similar patterns are observed for both items.
(機械翻訳)4. 部門間の違い- DocumentDB課とEFS課のインスタントコーヒー在庫が最も多い(各28.0個)。- EC2課はインスタントコーヒーの在庫が最も少ない(15.0個)。- これらのセクションの違いは、コーヒーと米菓の間に強い相関関係があることと一致している。
- Time series trends:
- While we have limited time series data (only three time points), there appears to be a slight decreasing trend in instant coffee and rice cracker inventories over the observed period.
- Donut inventory shows an increasing trend, while chocolate remains relatively stable.
(機械翻訳)5. 時系列トレンド:- 時系列データは限られているが(3時点のみ)、インスタントコーヒーと米菓の在庫は、観察期間中、わずかに減少傾向にあるようだ。- ドーナツの在庫は増加傾向を示し、チョコレートは比較的安定している。5. 時系列トレンド:- 時系列データは限られているが(3時点のみ)、インスタントコーヒーと米菓の在庫は、観察期間中、わずかに減少傾向にあるようだ。- ドーナツの在庫は増加傾向を示し、チョコレートは比較的安定している。
最後に結論と考察を述べてくれています。
In conclusion, the analysis reveals a strong relationship between instant coffee and rice cracker inventories across different organizational units and time periods. This suggests that these items may be consumed together or restocked simultaneously. The weaker correlations with donuts and chocolate indicate that their consumption or restocking patterns may be influenced by different factors.
These insights can be valuable for inventory management, restocking strategies, and understanding consumption patterns across different departments and sections. Further investigation into the reasons behind these relationships and variations could provide additional actionable insights for optimizing inventory management and meeting employee preferences.
(機械翻訳) 結論として、この分析から、インスタント・コーヒーとおせんべいの在庫は、異なる組織単位と期間にわたって強い関係があることが明らかになった。これは、これらの品目が一緒に消費されたり、同時に補充されたりする可能性を示唆している。ドーナツとチョコレートとの相関関係が弱いことから、これらの消費または補充パターンは異なる要因に影響されている可能性がある。これらの洞察は、在庫管理、再入荷戦略、異なる部門やセクションにまたがる消費パターンの理解に有益である。これらの関係やばらつきの背後にある理由をさらに調査することで、在庫管理を最適化し、従業員の嗜好を満たすための実用的な洞察がさらに得られる可能性がある。
終わりに
既存のシナリオにデータをアップロードで追加して、二つのデータを組み合わせた推論を行わせました。
データを組み合わせた分析を行わせる場合は内部的にデータを結合するようなので、プライマリキーの型を一致させる必要がありそうです。
現在は 1GB 未満の .xlsx または .csv ファイルしかアップロードできませんが、例えば各部署の勤務現場の写真などと組み合わせて消耗品の減り具合などを推論できたりしたら更に凄そうですね。


