SSM Automation Runbook “AWSSupport-TroubleshootELBHealthChecks” を使って ALB の Unhealthy 発生原因を調査してみた
はじめに
テクニカルサポートの 片方 です。
当サポート窓口において、ELB のヘルスチェックに失敗した原因を調査して欲しいといったお問い合わせが多くございます。
本ブログで紹介する AWSSupport -TroubleshootELBHealthChecks ランブックは、CloudWatch メトリクスを分析し、ネットワーク接続を確認し、ターゲットインスタンスで原因調査に有用なコマンドを実行することで、ELB ヘルスチェック失敗のトラブルシューティングに役立ちます。
このランブックは、次のユースケースに対応します。
ロードバランサーまたはターゲットグループのターゲットインスタンス内に異常なインスタンスが存在します。
不健全なインスタンスはないが、CloudWatchメトリクスは次のようなデータポイントを示している。UnHealthyHostCounts
UnHealthyHostCount について
ALB は、設定に基づきターゲットに対して定期的にヘルスチェックを実施しています。
ALB の UnHealthyHostCount のメトリクスの値は、その時々 ALB からのヘルスチェックに正常に応答できず Unhealthy と判定されていたターゲットの数を表します。
AWS 側の基盤障害を除き基本的には、あるターゲットが Unhealthy と判定された理由を調べるためには、そのターゲットがなぜ ALB からのヘルスチェックリクエストに正常に応答できなかったのかを確認する必要があります。
ALB からのヘルスチェックに応答するのはターゲットグループへ登録しているアプリケーション (リスナー設定に基づくヘルスチェックパス) であるため、基本的には設定したアプリケーションの動作の観点で調査が必要です。
やってみた
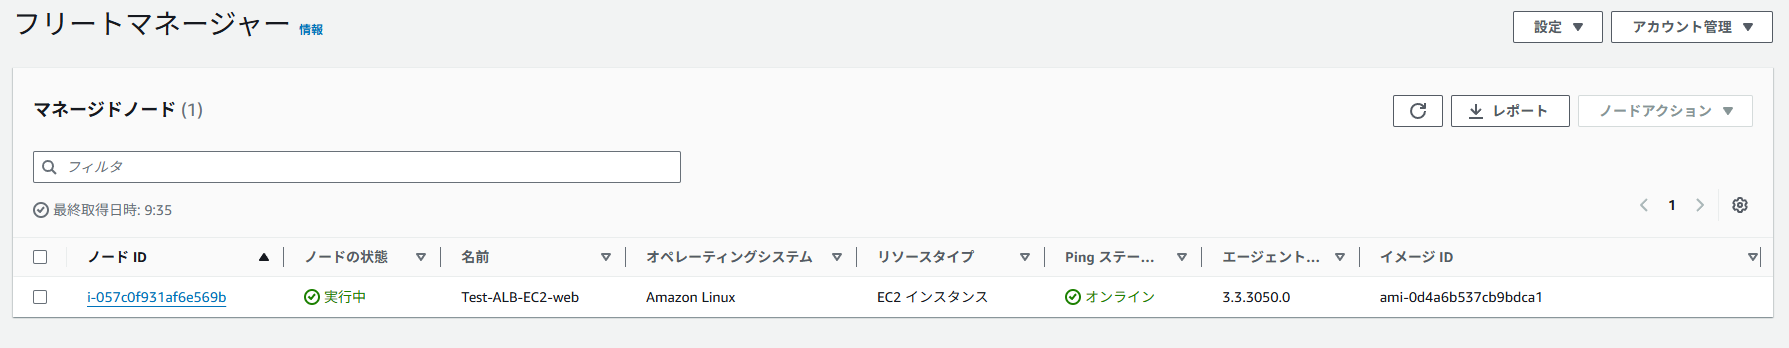
先ず前提として、ターゲットインスタンスはマネージドノードとして登録されている必要があります。
なお、本ブログでこちらの設定方法は割愛させて頂きます。
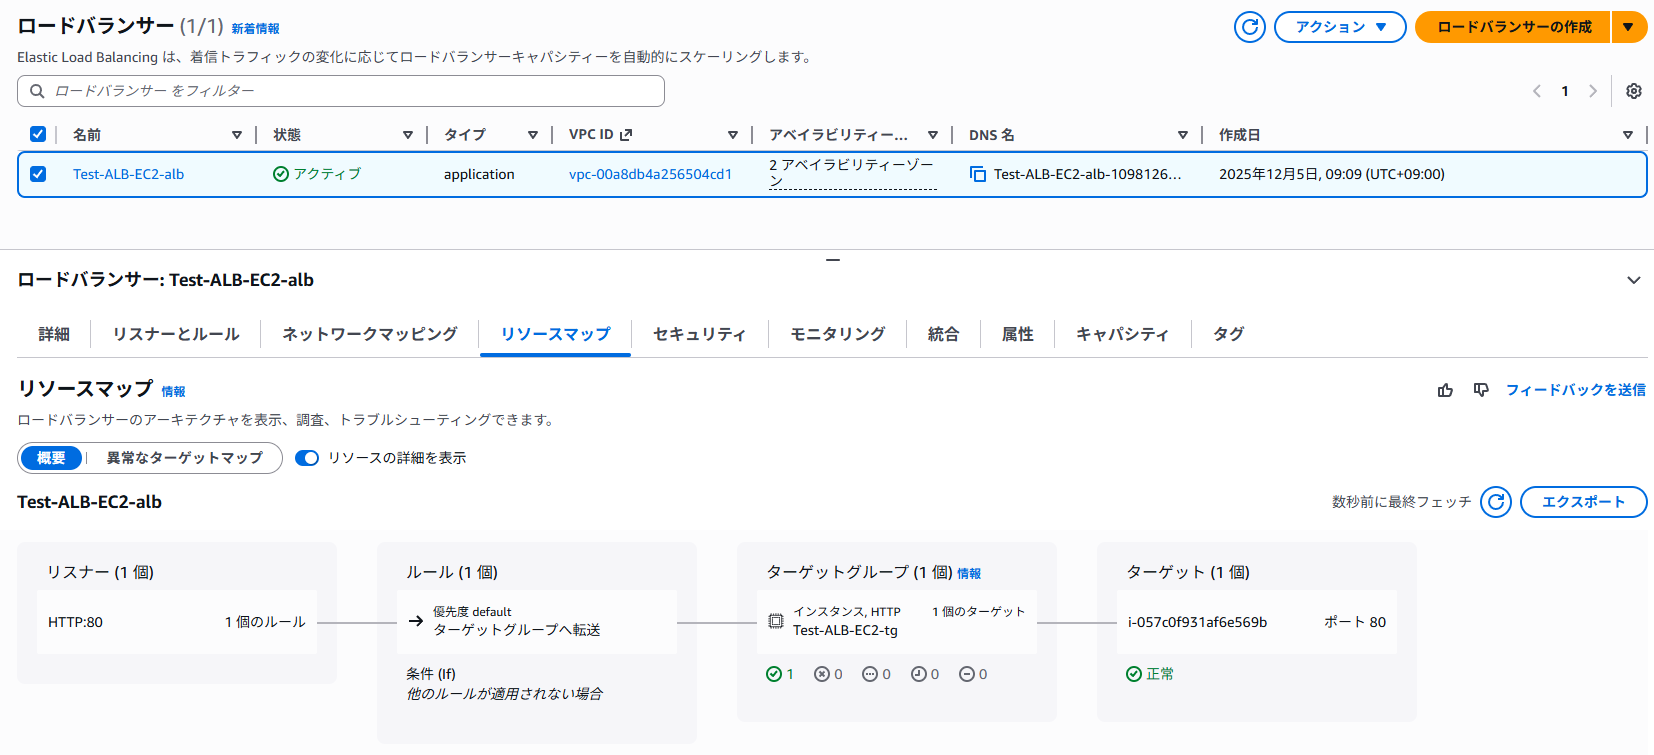
ALB + EC2 インスタンス (Nginx) の検証環境を作成しランブックを実行します。
※ ヘルスチェックは正常の状態です。
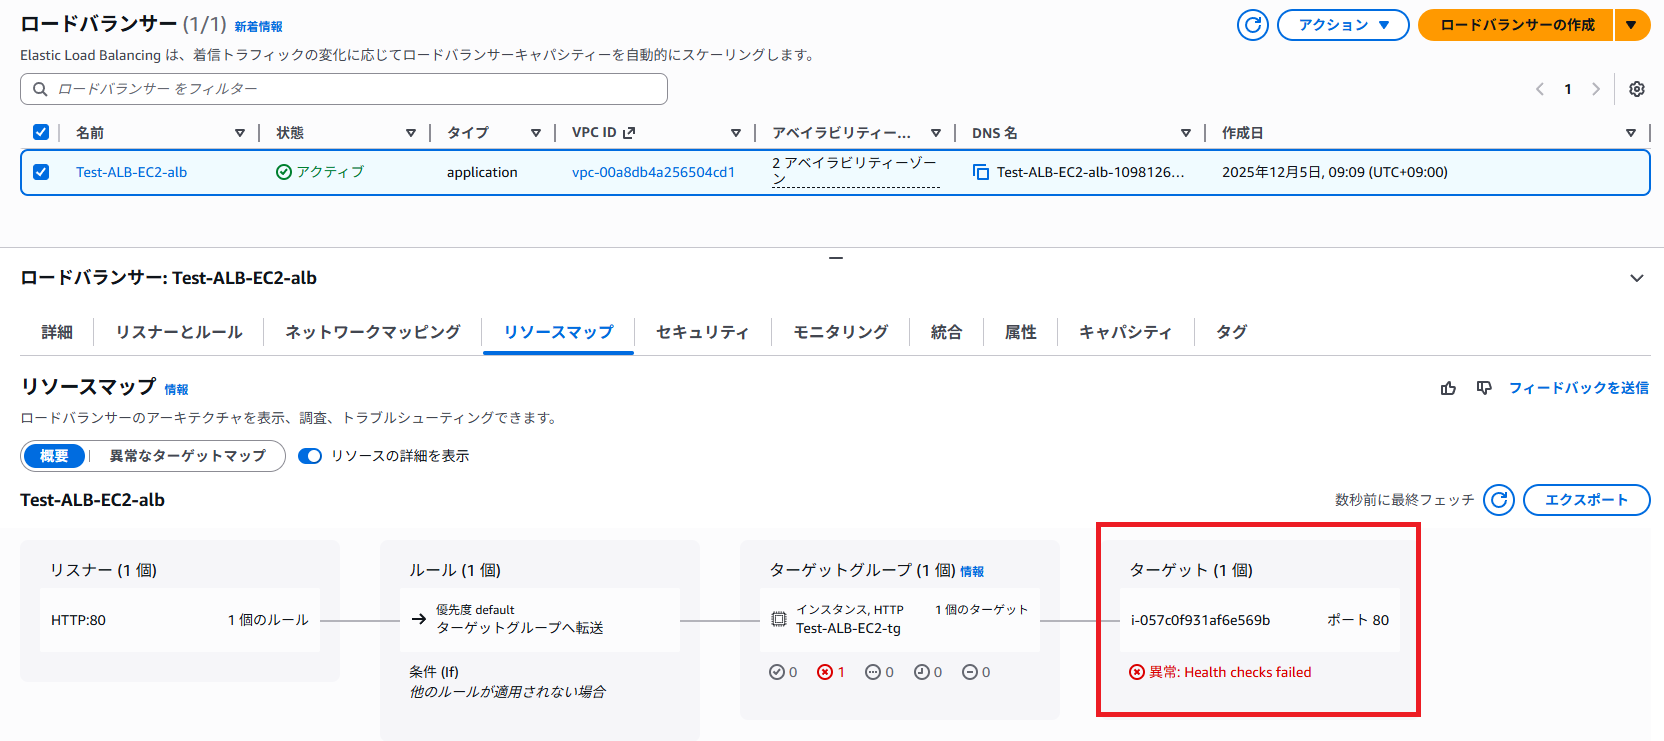
では、Unhealthy 判定となるよう nginx サービスを停止します。
ss -tulpn | grep :80 の結果を見ると、ポート 80 は nginx のプロセス(pid 2515, 2516, 2517)が LISTEN している状態です。
これを止めれば、ALB のヘルスチェックは Unhealthy になります。
sh-4.2$ sudo ss -tulpn | grep :80
tcp   LISTEN 0      128                            0.0.0.0:80        0.0.0.0:*    users:(("nginx",pid=2517,fd=6),("nginx",pid=2516,fd=6),("nginx",pid=2515,fd=6))
tcp   LISTEN 0      128                               [::]:80           [::]:*    users:(("nginx",pid=2517,fd=7),("nginx",pid=2516,fd=7),("nginx",pid=2515,fd=7))
sh-4.2$ sudo systemctl stop nginx
sh-4.2$ sudo ss -tulpn | grep :80
sh-4.2$
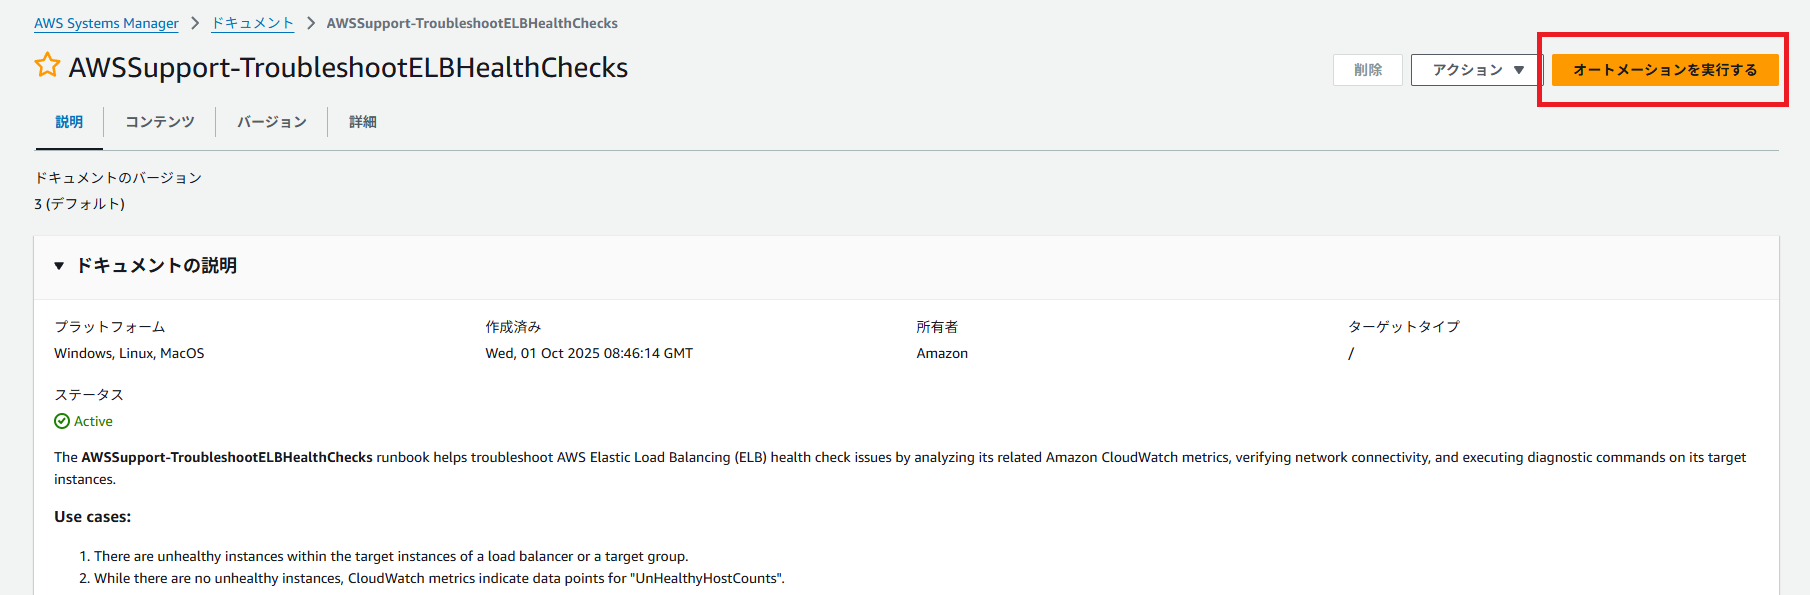
1. SSM マネジメントコンソール画面へアクセス
2. 下部の左ペイン [共有リソース] セクションの ドキュメントをクリック
3. Amazon が所有を選択 ⇒ 検索窓に "AWSSupport-TroubleshootELBHealthChecks" を記載
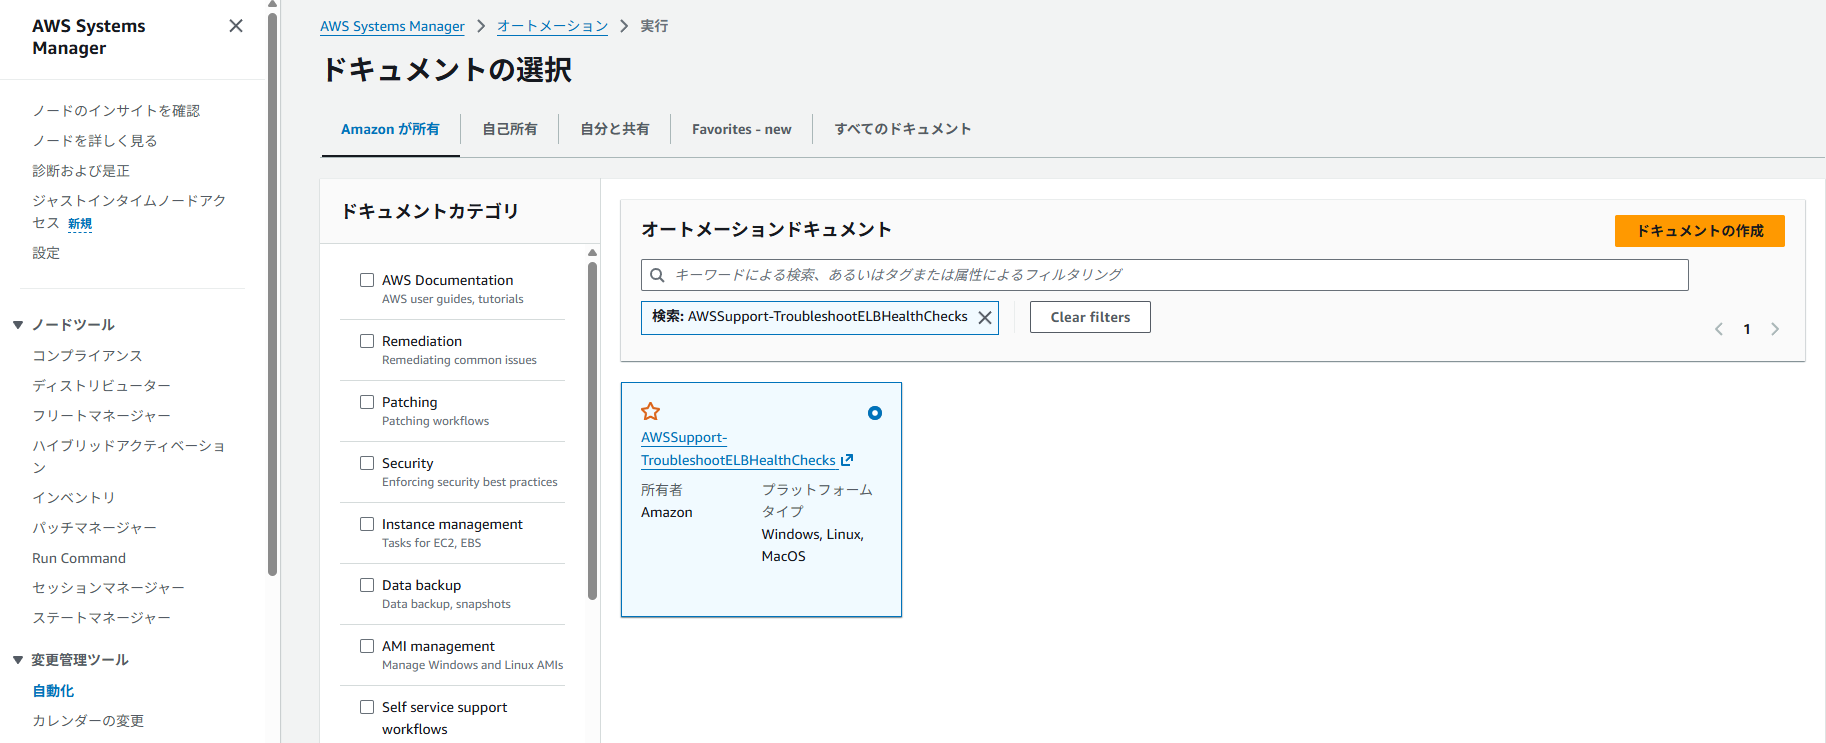
4. ドキュメントを選択
5. 右上 [オートメーションを実行する] を選択
6. Simple execution を選択
7. Input parameters (入力パラメータ) に以下を記載します。
-
LoadBalancerOrTargetGroupName : 対象 ELB 又は ターゲットグループ
今回はターゲットグループ名を記載しました。 -
ExecutionMode (実行モード) : Complete 又は SkipRunCommands を選択します。
Complete を選択した場合、runCommands を含むすべてのステップを実行します。SkipRunCommands の場合、コマンドの実行を除くすべてのステップを実行します。 -
AutomationAssumeRole :
※ 当該設定をしている IAM ユーザーに ドキュメント 記載の権限許可が存在しない場合は、当該権限を有するロール作成をしてください。その後、AutomationAssumeRole に当該ロールを設定してください。
アタッチするポリシー例
{
    "Version": "2012-10-17",
    "Statement": [
        {
            "Effect": "Allow",
            "Action": [
                "elasticloadbalancing:DescribeLoadBalancers",
                "elasticloadbalancing:DescribeTargetGroups",
                "elasticloadbalancing:DescribeTargetHealth",
                "elasticloadbalancing:DescribeInstanceHealth",
                "ec2:DescribeInstances",
                "ec2:DescribeNetworkInterfaces",
                "ec2:DescribeSecurityGroups",
                "ec2:DescribeSubnets",
                "cloudwatch:GetMetricStatistics",
                "ssm:SendCommand",
                "ssm:GetCommandInvocation",
                "ssm:DescribeInstanceInformation",
                "s3:GetBucketLocation",
                "s3:GetBucketAcl",
                "s3:PutObject"
            ],
            "Resource": "*"
        }
    ]
}
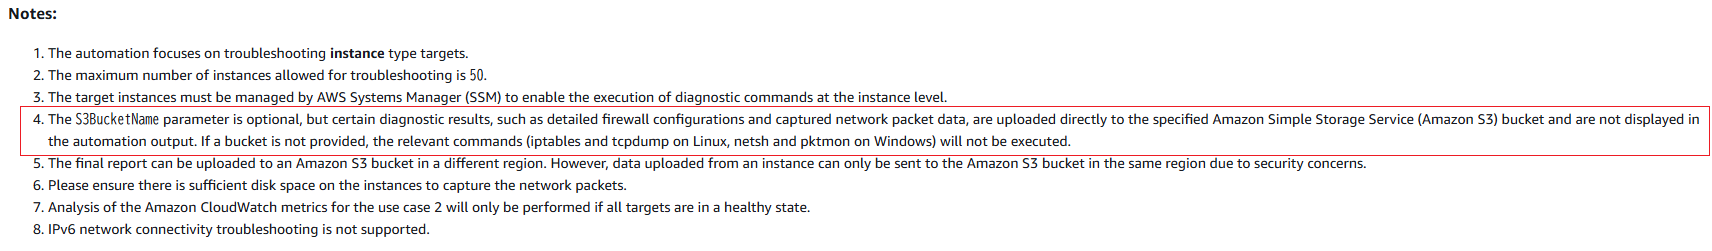
- S3BucketName : ランブックを実行する同じリージョンに存在する S3 バケットを選択します。
オプションですが、記載が無い場合はコマンド(Linuxではiptablesとtcpdump、Windowsではnetshとpktmon)による調査はスキップされるので、設定することをお勧めします。
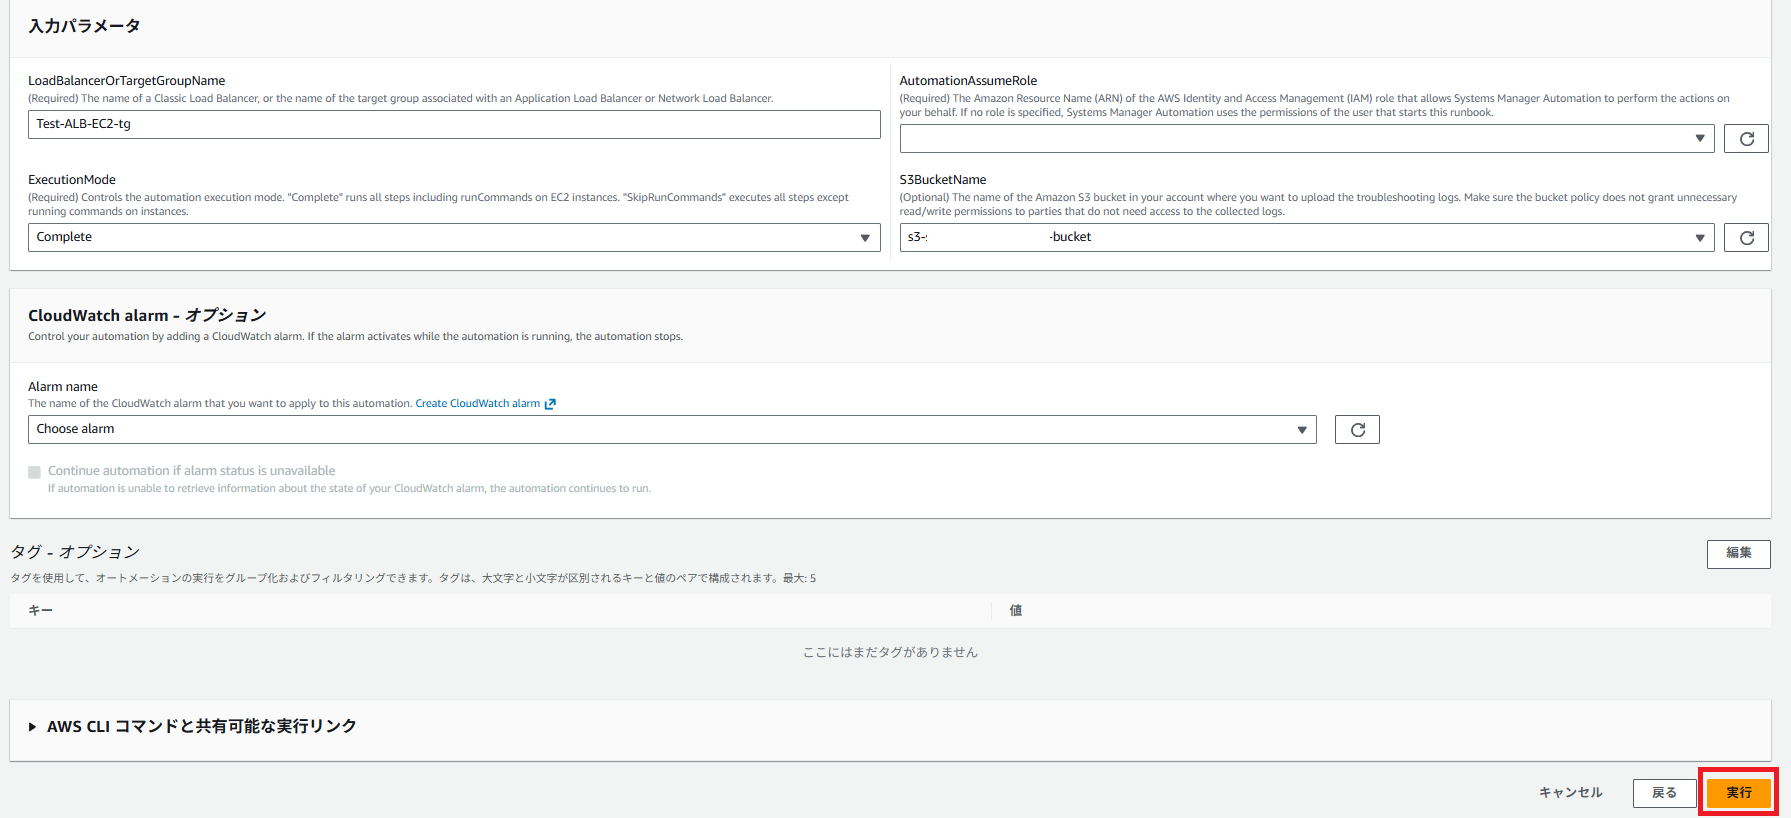
8. 右下の [Execute] をクリック
設定は以上です。あとは調査完了までしばらく待ちます。
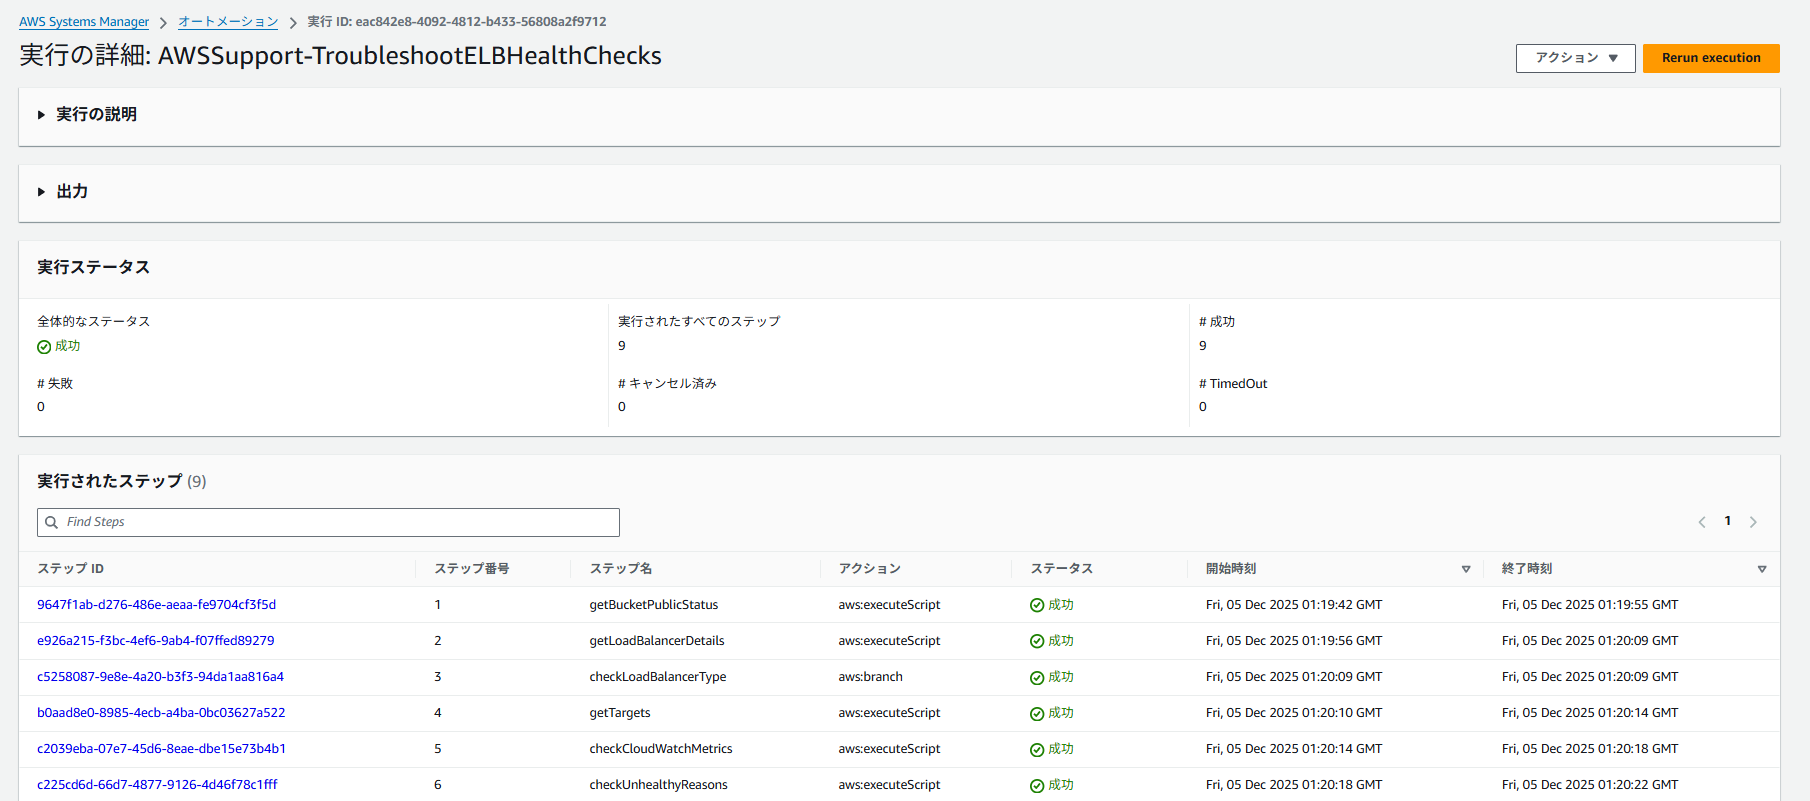
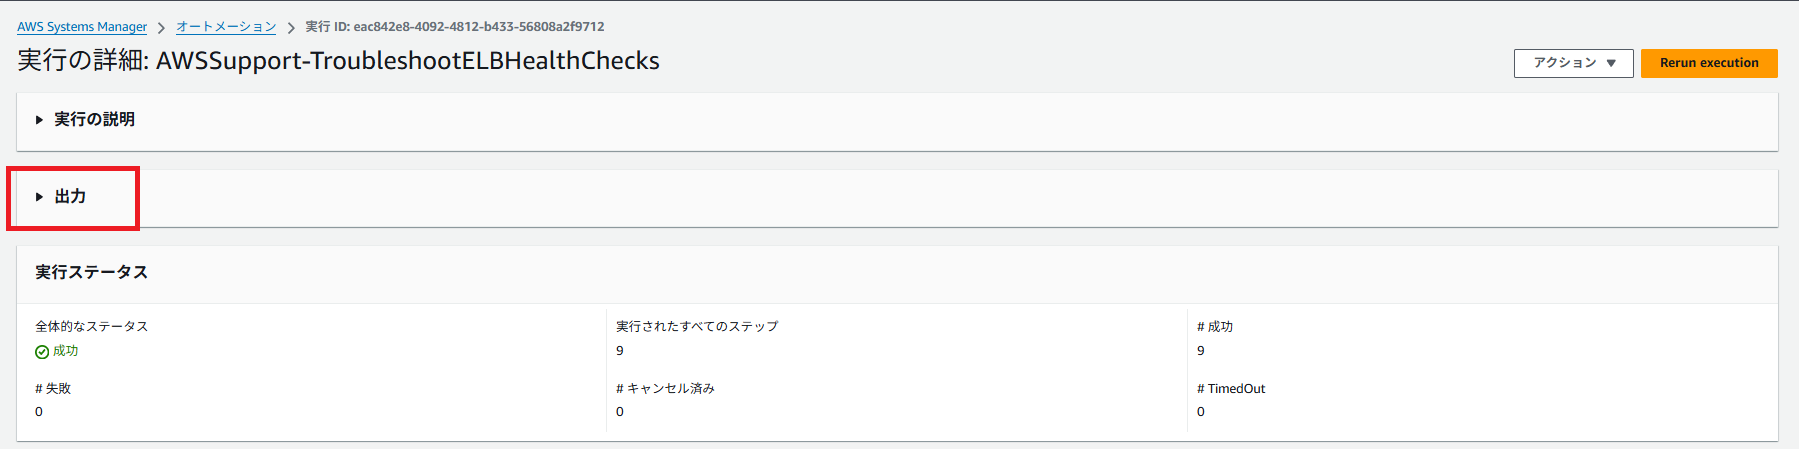
成功しました!
出力結果
それでは、出力結果の内容を確認してみます。
※ 一部マスクします
getLoadBalancerDetails.type
ALB
generateReport.report
=== Elastic Load Balancer(ELB) HealthCheck Troubleshooter ===
Automation Execution ID: eac842e8-4092-4812-b433-56808a2f9712

ELB type: ALB    ELB name: app/Test-ALB-EC2-alb/0058f2ed55ee2463    Cross zone enabled: True
Target Group: Test-ALB-EC2-tg
Total targets: 1    Healthy: 0    Unhealthy: 1

=== Check CloudWatch Metrics ===
Current Metrics:
    HealthyHostCount Min: 0.0  UnhealthyHostCount Min: 1.0
    HealthyHostCount Max: 0.0  UnhealthyHostCount Max: 1.0

AZ ap-northeast-1a Metrics:
    HealthyHostCount Min: 0.0  UnhealthyHostCount Min: 1.0
    HealthyHostCount Max: 0.0  UnhealthyHostCount Max: 1.0

CloudWatch link:
    https://console.aws.amazon.com/cloudwatch/home?region=ap-northeast-1&#metricsV2:graph=~%28metrics~%28~%28~%27AWS%2FApplicationELB~%27UnHealthyHostCount~%27LoadBalancer~%27app%2FTest-ALB-EC2-alb%2F0058f2ed55ee2463~%27TargetGroup~%27targetgroup%2FTest-ALB-EC2-tg%2F5cc0594ffd6dd7a2%29~%28~%27AWS%2FApplicationELB~%27HealthyHostCount~%27LoadBalancer~%27app%2FTest-ALB-EC2-alb%2F0058f2ed55ee2463~%27TargetGroup~%27targetgroup%2FTest-ALB-EC2-tg%2F5cc0594ffd6dd7a2%29~%28~%27AWS%2FApplicationELB~%27UnHealthyHostCount~%27LoadBalancer~%27app%2FTest-ALB-EC2-alb%2F0058f2ed55ee2463~%27TargetGroup~%27targetgroup%2FTest-ALB-EC2-tg%2F5cc0594ffd6dd7a2~%27AvailabilityZone~%27ap-northeast-1a%29~%28~%27AWS%2FApplicationELB~%27HealthyHostCount~%27LoadBalancer~%27app%2FTest-ALB-EC2-alb%2F0058f2ed55ee2463~%27TargetGroup~%27targetgroup%2FTest-ALB-EC2-tg%2F5cc0594ffd6dd7a2~%27AvailabilityZone~%27ap-northeast-1a%29~%28~%27AWS%2FApplicationELB~%27UnHealthyHostCount~%27LoadBalancer~%27app%2FTest-ALB-EC2-alb%2F0058f2ed55ee2463~%27TargetGroup~%27targetgroup%2FTest-ALB-EC2-tg%2F5cc0594ffd6dd7a2~%27AvailabilityZone~%27ap-northeast-1c%29~%28~%27AWS%2FApplicationELB~%27HealthyHostCount~%27LoadBalancer~%27app%2FTest-ALB-EC2-alb%2F0058f2ed55ee2463~%27TargetGroup~%27targetgroup%2FTest-ALB-EC2-tg%2F5cc0594ffd6dd7a2~%27AvailabilityZone~%27ap-northeast-1c%29%29~view~%27timeSeries~stacked~false~region~%27ap-northeast-1~start~%272025-12-05T00%3A20%3A16.000Z~end~%272025-12-05T01%3A20%3A16.000Z~period~60~stat~%27Maximum%29

=== Check connectivities between ELB nodes and instances ===
Verify the security groups, NACLs, and route tables associated with the ELB nodes and its instances.

• Instance i-057c0f931af6e569b
✅[PASSED]: No issues were found.

=== Check Unhealthy Targets ===
Verify unhealthy reasons and run diagnostic commands on the instance type targets (SSM managed) to gather information for further investigation.
To prevent extended execution times, commands will be restricted to run on a maximum of 50 instances.

• Target 1
Target Type: Instance    Target ID: i-057c0f931af6e569b

❌[FAILED]: Target.FailedHealthChecks - The load balancer received an error while establishing a connection to the target or the target response was malformed.

Linux script output:
Hostname: ip-10-0-0-49.ap-northeast-1.compute.internal
CPU Usage: 6.2%
Memory Usage:
  Total: 446MB Used: 91MB Free: 176MB Usage: 20%

>ss -tunlp | grep :80
❗If there is no output, please verify that the port is correct.

>curl -vIkL http://localhost:80/
❗If failed, please verify that the application is running and the protocol, path and port are correct.
  % Total    % Received % Xferd  Average Speed   Time    Time     Time  Current
                                 Dload  Upload   Total   Spent    Left  Speed

  0     0    0     0    0     0      0      0 --:--:-- --:--:-- --:--:--     0*   Trying 127.0.0.1:80...
* connect to 127.0.0.1 port 80 failed: Connection refused
*   Trying [::1]:80...
* connect to ::1 port 80 failed: Connection refused
* Failed to connect to localhost port 80 after 0 ms: Couldn't connect to server

  0     0    0     0    0     0      0      0 --:--:-- --:--:-- --:--:--     0
* Closing connection
curl: (7) Failed to connect to localhost port 80 after 0 ms: Couldn't connect to server

>iptables -L -n -v
❗Output is redacted, please check the detailed output file in the S3 bucket.

>iptables -t nat -L -n -v
❗Output is redacted, please check the detailed output file in the S3 bucket.

>tcpdump for 30 seconds
>tcpdump -i any -c 3000 port 80 -v -G 30 -W 1 -w /var/lib/amazon/ssm/tmp.VdTUim7NWn/tcpdump.pcap -Z root
tcpdump: listening on any, link-type LINUX_SLL (Linux cooked), capture size 262144 bytes
Got 0
Got 0
Got 0
Got 0
Got 0
Got 0
Got 0
Got 0
Got 0
Got 0
Got 0
Got 0
Got 0
Got 0
Got 0
Got 0
Got 0
Got 0
Got 0
Got 0
Got 0
Got 0
Got 0
Got 0
Got 2
Got 2
Got 2
Got 2
Got 2
Got 4
Got 4
Got 4
Got 4
Got 4
Got 4
Got 4
Got 4
Got 4
Got 4
Got 4
Got 4
Got 4
Got 4
Got 4
Got 4
Got 4
Got 4
Got 4
Got 4
Got 4
Got 4
Got 4
Got 4
Got 4
Maximum file limit reached: 1
5 packets captured
6 packets received by filter
0 packets dropped by kernel
tcpdump completed.
❗Please use WireShark to analyze the health check requests contained in the tcpdump file.

Uploading the file i-057c0f931af6e569b.zip to S3 bucket...
Output and tcpdump files have been uploaded to S3 bucket successfully!

=== End of Troubleshooting Report ===

Please download report and logs from S3 bucket and attach them to the AWS support case.
S3 Console URL: https://s3.console.aws.amazon.com/s3/buckets/s3-xxxxxxxxxxxxxxx-bucket?region=ap-northeast-1&prefix=AWSSupport-TroubleshootELBHealthChecks/eac842e8-4092-4812-b433-56808a2f9712/
Report URI: s3://s3-xxxxxxxxxxxxxxx-bucket/AWSSupport-TroubleshootELBHealthChecks/eac842e8-4092-4812-b433-56808a2f9712/report.txt
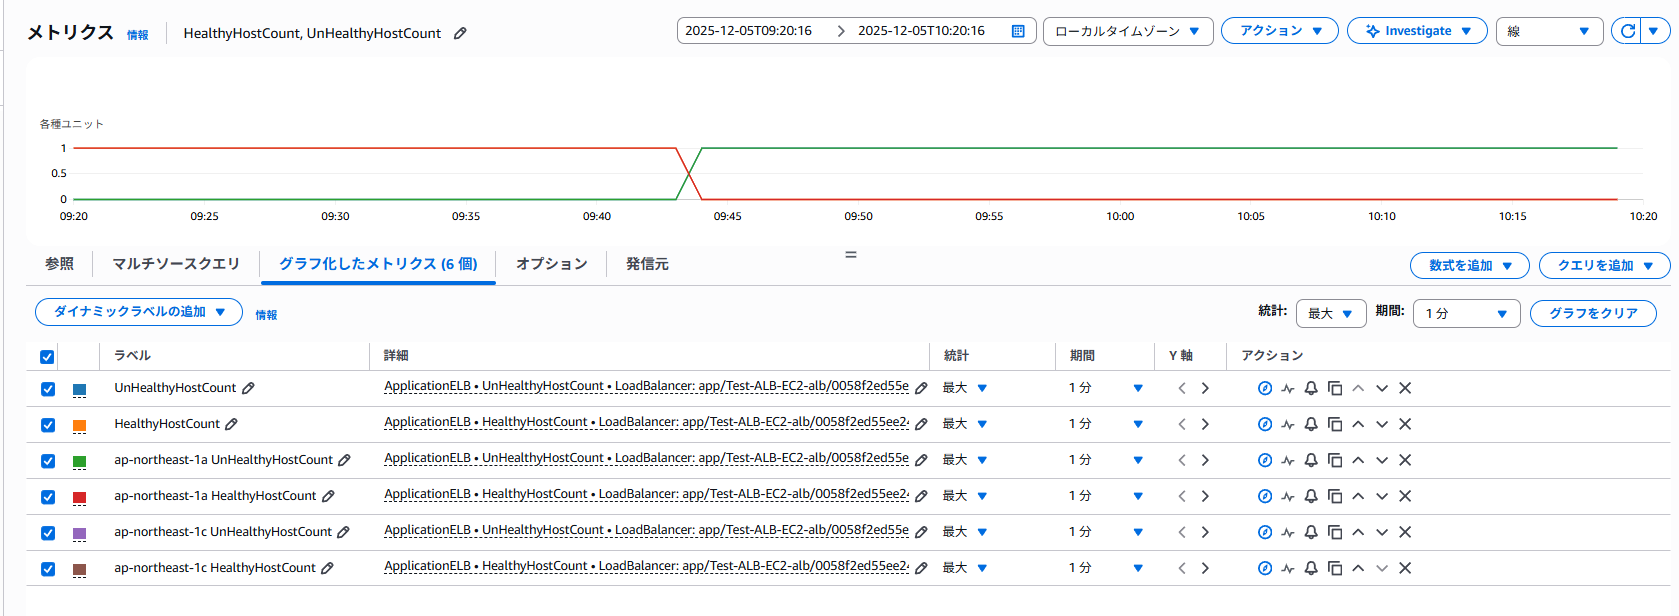
今回の場合は、出力結果より以下の状況とわかります。
-
CloudWatch メトリクスで UnhealthyHostCount = 1 の状況
-
ALB から EC2 への通信経路(Security Group、NACL、Route Table)は問題ない状況
-
ヘルスチェックに失敗している理由は、「Target.FailedHealthChecks - The load balancer received an error while establishing a connection」 であること。(ALB がポート 80 に TCP コネクションを張ろうとして失敗している)
さらに curl の結果より、「connect to 127.0.0.1 port 80 failed: Connection refused
Failed to connect to localhost port 80」 とあるため、対象 EC2 インスタンス内でポート 80 のサービスが LISTEN していない状況と見受けられる。 -
ss の出力が空 ⇒ LISTEN なし
-
tcpdump の結果からも通信到達を確認できる
出力結果に記載の CloudWatch link よりアクセスすると、以下の CloudWatch メトリクスを確認できるようです。
S3 バケット側では、下記が保存されています。
- i-xxxxxxxxxxxxx.zip
- report.txt
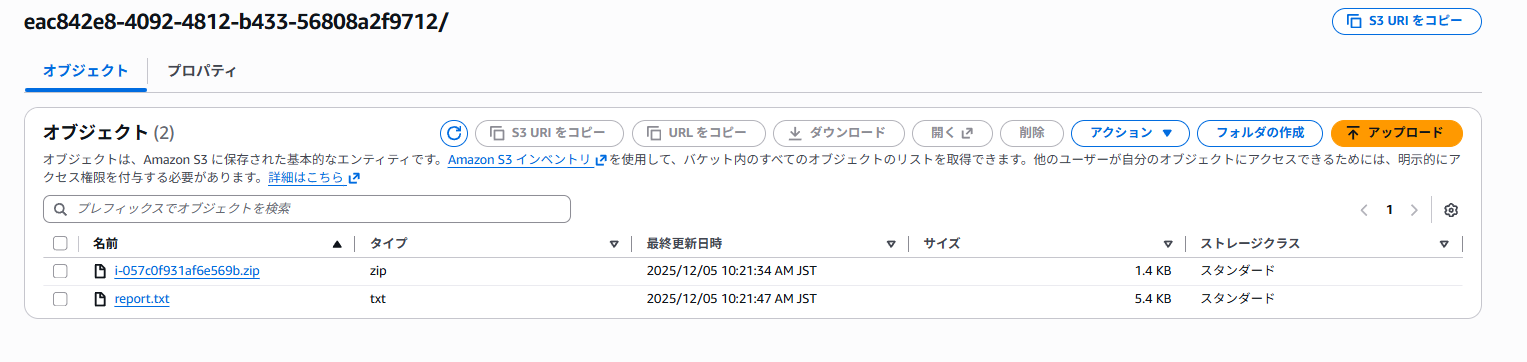
i-xxxxxxxxxxxxx.zip には、output.txt と tcpdump.pcap が保存されています。
output.txt は出力結果と同じ内容です。
tcpdump.pcap に関しては、Wireshark を利用してファイルの中身を確認したところ、以下のような状況でした。

(1)ALB ノード ⇒ 対象 EC2 インスタンスへ SYN
10.0.1.172 → 10.0.0.49 TCP 63834 → 80 [SYN]
→ ALB が EC2 の 80 番に接続しようとしている
(2)EC2 インスタンス ⇒ ALB ノードへ RST/ACK
10.0.0.49 → 10.0.1.172 TCP 80 → 63834 [RST, ACK]
→ 対象 EC2 インスタンスが「そのポート LISTEN していないので接続できない」と拒否
(3)別の ALB ノード(10.0.0.70)からも SYN
10.0.0.70 ⇒ 10.0.0.49 [SYN]
ALB は複数のノードからヘルスチェックをするため複数回届く。
(4)EC2 インスタンス ⇒ ALB ノード(10.0.0.70)へ RST/ACK
10.0.0.49 → 10.0.0.70 [RST, ACK]
EC2 インスタンスが受信した SYN に対して RST を返しているため、ALB はコネクション確立に失敗し Unhealthy と判定していることが確認できました。
なお、report.txt については、出力結果の全文と捉えてください。
補足
ドキュメント記載の通り、ターゲットグループに所属する EC2 インスタンスに対して以下のコマンドを実行します。
- Linux shell: top、free、ss、curl、iptables、tcpdump
- Windows PowerShell: Get-CimInstance、Get-NetFirewallProfile、Get-NetFirewallRule、Invoke-WebRequest、netstat、netsh、pktmon
まとめ
ターゲットグループに所属している EC2 インスタンスはマネージドノードとして登録されているといった前提条件はあるものの、原因の一次調査としては非常に便利ですね。
本ブログが誰かの参考になれば幸いです。
参考資料
- AWSSupport-TroubleshootELBHealthChecks - AWS Systems Manager Automation Runbook リファレンス
- AWS Systems Manager のマネージドノードのセットアップ - AWS Systems Manager
- Wireshark • Go Deep
アノテーション株式会社について
アノテーション株式会社は、クラスメソッド社のグループ企業として「オペレーション・エクセレンス」を担える企業を目指してチャレンジを続けています。「らしく働く、らしく生きる」のスローガンを掲げ、様々な背景をもつ多様なメンバーが自由度の高い働き方を通してお客様へサービスを提供し続けてきました。現在当社では一緒に会社を盛り上げていただけるメンバーを募集中です。少しでもご興味あれば、アノテーション株式会社WEBサイトをご覧ください。