![[Copilot Studio] Tried Handling KPI Aggregation Deterministically Without Relying on LLM: Two Approaches Using Code Interpreter and Office Script](https://images.ctfassets.net/ct0aopd36mqt/wp-thumbnail-00eddef75cb5ee39286e0aa370a96e4f/040bbf127b84da0ee2c483485da1dd29/microsoft-eyecatch.jpg?w=3840&fm=webp)
[Copilot Studio] Tried Handling KPI Aggregation Deterministically Without Relying on LLM: Two Approaches Using Code Interpreter and Office Script
This page has been translated by machine translation. View original
Introduction
Hello, I'm Keima.
When creating KPI reports, the source data is often monthly, but the report needs to include quarterly totals, averages, and year-over-year comparisons.
The tricky part is deciding "whether to let an LLM handle the average and year-over-year calculations."
Generative AI excels at text generation, but numerical calculations can sometimes result in digit errors or confusion about targets, leaving uncertainty about entrusting monetary or ratio calculations to it.
This article covers two approaches for performing numerical aggregation deterministically without relying on an LLM, verified on actual hardware as of June 2026.
One approach uses a code interpreter that executes Python inside the agent, and the other runs Office Scripts (TypeScript) in Excel from a flow. Both share the same principle: writing the aggregation code in advance and keeping it fixed.
I hope this serves as a reference for those who want to accurately aggregate collected data and turn it into materials.
This article is the 6th installment in a series on building agents with Copilot Studio.
The series aims to build an agent that handles "collection → aggregation → charts → insights → documentation" end-to-end, and this article covers the "aggregation" part.
Target audience: Those who want to perform numerical aggregation accurately in Copilot Studio without relying on an LLM
Series Article List
| # | Theme | Article |
|---|---|---|
| 1st | First Agent | Creating Your First Agent |
| 2nd | Knowledge | Trying File-Based Answers with Knowledge |
| 3rd | Topics, Tools, Flows | Building "Movement" with Topics, Tools, and Agent Flows |
| 4th | Templates, Autonomous Triggers, Multi-agent | Expanding the Configuration with Templates, Autonomous Triggers, and Multi-agents |
| 5th | Collection (How to Pass Data) | Comparing Methods for Providing KPI Data to Agents for Aggregation |
| 6th | Aggregation | (This article) |
In the previous article (5th), we compared methods for providing KPI data to agents. This time, as the next step, we move on to performing "aggregation" of that data deterministically.
1. What We're Doing This Time
We perform aggregation (calculations such as averages and year-over-year comparisons) deterministically without relying on an LLM.
In this article, we try two approaches.
- Aggregate quarterly averages and year-over-year comparisons from monthly raw data
- Approach 1: Aggregate using a code interpreter (Python). Embed Python in the prompt to fix the calculation
- Approach 2: Write the processing in Office Script (TypeScript) and execute it from an agent flow in Copilot Studio
- Organize how to choose between the two approaches
The verification uses the same monthly KPI data (fictional) from the three fictional SaaS companies (CloudNova / StreamForge / Datapeak) used previously.
2. Why Not Let an LLM Handle Aggregation
Generative AI excels at text generation, but numerical calculations are not always accurate.
Even when instructed to calculate averages or year-over-year comparisons, it may make digit errors or confuse targets.
Since the accuracy of numbers in reports is a prerequisite, we leave calculations to deterministic means.
The division of responsibility is to let the LLM handle only "text generation (insights) based on aggregation results" and "insertion," while a separate mechanism handles the calculations themselves.
3. Two Approaches for Fixing Aggregation
This article tries two approaches for preventing LLMs from handling aggregation.
Both share the point of writing the aggregation code in advance and keeping it fixed. The differences are "where the calculation runs" and "billing."
- Approach 1: Code Interpreter (Python). Copilot Studio executes Python inside the agent to aggregate. By embedding the Python code used for aggregation in the prompt, that calculation logic is (as long as the code interpreter doesn't rewrite it) executed mostly as-is, fixing the calculation. This is a premium feature.
- Approach 2: Office Script (TypeScript). Write the aggregation processing in Excel's Office Script and execute it from an agent flow in Copilot Studio. The pre-written code runs as-is, producing exactly the same results every time. It works with standard connectors and doesn't incur premium billing (Copilot Credits) like the code interpreter.
The following diagram shows "where the calculation runs."
The code interpreter executes Python inside Copilot Studio, while Office Script executes TypeScript inside Excel, and both return aggregation results to the agent.
| Aspect | Code Interpreter | Office Script |
|---|---|---|
| Where calculation runs | Python executed by Copilot Studio | Office Script (TypeScript) executed by Excel |
| How to write calculation logic | Embed Python in the prompt (executed mostly as-is) | Write in a script (executed as-is every time) |
| Required skills | Natural language + Python | TypeScript |
| License / Billing | Premium (consumes Copilot Credits) | Standard (no premium billing. Production flows consume capacity for actions) |
| How to pass data | Attach to chat, or use Knowledge | Read files on OneDrive/SharePoint via flow |
| Notes | Responses can take minutes | Scripts need to be written in advance |
"No additional cost" for Office Script is in contrast to the code interpreter (premium = consumes Copilot Credits), meaning Copilot Credits are not required. However, when running agent flows in the production channel, even standard connectors consume Copilot Studio capacity for agent flow actions (test execution is excluded).
4. Data Used for Verification
To compare the two approaches on equal footing, we prepare common verification data first.
We use the same monthly KPI data (fictional) from the three fictional SaaS companies (CloudNova / StreamForge / Datapeak) as before.
Since year-over-year comparisons require data from the same period in the prior year, we prepare an Excel file with monthly KPIs for 3 companies × (FY2024 Q3 and FY2025 Q3, both October–December) on a single RawMonthly sheet.
Since aggregation (averages, year-over-year) is left to the deterministic means of each approach, this file contains only raw data without any aggregation formulas or summaries.
Script to generate the raw data Excel (click to expand)
#!/usr/bin/env python3
"""Generate Excel for year-over-year (YoY) aggregation verification.

Raw data to be read by the code interpreter (CI).
3 companies × (FY2024 Q3 and FY2025 Q3, both October–December) monthly KPIs on a single RawMonthly sheet.
Since aggregation (total, average, year-over-year) is to be performed deterministically with CI's Python (pandas),
this file contains no aggregation formulas or summary sheets (only raw data is passed).
"""
from openpyxl import Workbook
from openpyxl.worksheet.table import Table, TableStyleInfo

OUT = "kpi-raw-data-yoy.xlsx"

# Raw data (fictional). FY2024 Q3 has lower values before growth, FY2025 Q3 has grown values from the prior year.
# (Company, Month, ARR (million yen), NRR (%), Operating profit margin (%))
RAW = [
    ("CloudNova", "2024-10", 1600, 116, 11),
    ("CloudNova", "2024-11", 1625, 117, 11.5),
    ("CloudNova", "2024-12", 1650, 118, 12),
    ("StreamForge", "2024-10", 1160, 105, -1),
    ("StreamForge", "2024-11", 1180, 106, -0.5),
    ("StreamForge", "2024-12", 1200, 107, 0),
    ("Datapeak", "2024-10", 2450, 124, 16.5),
    ("Datapeak", "2024-11", 2500, 125, 17),
    ("Datapeak", "2024-12", 2550, 126, 17.5),
    ("CloudNova", "2025-10", 1900, 119, 13),
    ("CloudNova", "2025-11", 1950, 120, 13.5),
    ("CloudNova", "2025-12", 2000, 121, 14),
    ("StreamForge", "2025-10", 1280, 108, 0.5),
    ("StreamForge", "2025-11", 1300, 109, 1),
    ("StreamForge", "2025-12", 1320, 110, 1.5),
    ("Datapeak", "2025-10", 2750, 127, 18.5),
    ("Datapeak", "2025-11", 2800, 128, 19),
    ("Datapeak", "2025-12", 2880, 129, 19.5),
]

def main() -> None:
    wb = Workbook()
    ws = wb.active
    ws.title = "RawMonthly"
    ws.append(["Company", "Month", "ARR", "NRR", "OPM"])
    for row in RAW:
        ws.append(list(row))
    table = Table(displayName="RawMonthly", ref=f"A1:E{len(RAW) + 1}")
    table.tableStyleInfo = TableStyleInfo(
        name="TableStyleMedium2", showRowStripes=True
    )
    ws.add_table(table)
    wb.save(OUT)
    print(f"saved {OUT}")

if __name__ == "__main__":
    main()
Save the script above as make_excel_yoy.py and run it.
pip install openpyxl
python make_excel_yoy.py
# Output example
saved kpi-raw-data-yoy.xlsx
When you open the generated kpi-raw-data-yoy.xlsx in Excel, the monthly KPIs for 3 companies × 6 months (Q3 of 2024 and 2025) are listed on the RawMonthly sheet.
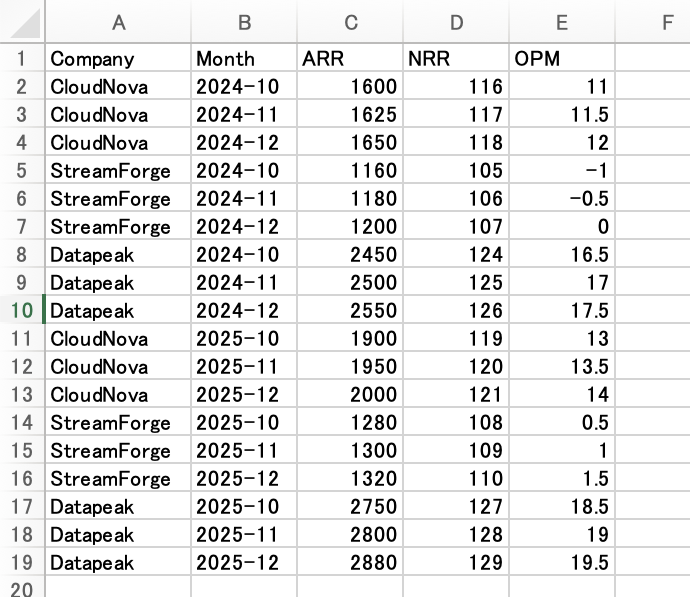
The RawMonthly sheet of kpi-raw-data-yoy.xlsx. Monthly KPIs (ARR, NRR, OPM) for CloudNova / StreamForge / Datapeak for October–December 2024 and October–December 2025 are listed. There are no aggregation formulas or summaries; only raw data is included.
When each approach aggregates this file, we judge that "aggregation was performed correctly" if the results match the following values (pass criteria).
Rounding is to 0 decimal places for ARR and NRR, 1 decimal place for operating profit margin (OPM), and 1 decimal place for year-over-year comparisons.
| Company | 2024 ARR Avg | 2025 ARR Avg | ARR YoY | 2025 NRR Avg | 2025 OPM Avg |
|---|---|---|---|---|---|
| CloudNova | 1625 | 1950 | +20.0% | 120 | 13.5 |
| StreamForge | 1180 | 1300 | +10.2% | 109 | 1.0 |
| Datapeak | 2500 | 2810 | +12.4% | 128 | 19.0 |
The calculation method for each value is as follows.
- ARR average / NRR average / OPM average: Simple average of the 3 months from October to December of that year (same for both 2024 and 2025). For example, CloudNova's 2025 NRR average is (119 + 120 + 121) ÷ 3 = 120, and the 2025 OPM average is (13 + 13.5 + 14) ÷ 3 = 13.5. Similarly for 2024: NRR average (116 + 117 + 118) ÷ 3 = 117, OPM average (11 + 11.5 + 12) ÷ 3 = 11.5.
- ARR year-over-year (YoY): (2025 ARR average ÷ 2024 ARR average − 1) × 100. For CloudNova, the 2025 ARR average is (1900 + 1950 + 2000) ÷ 3 = 1950, and the 2024 ARR average is (1600 + 1625 + 1650) ÷ 3 = 1625, so (1950 ÷ 1625 − 1) × 100 = +20.0%.
Both Approach 1 (code interpreter) and Approach 2 (Office Script) use this same kpi-raw-data-yoy.xlsx file.
Let's start with Approach 1 (code interpreter).
5. Approach 1: Aggregating with the Code Interpreter
5.1 What is the Code Interpreter?
The code interpreter is a feature that allows an agent to generate and execute Python as needed, enabling it to aggregate and analyze structured files like CSV and Excel.
The feature details, billing (a premium feature that consumes Copilot Credits), how to pass data, and the activation procedure were covered in the 5th article.
For details, please refer to the 5th article, "Comparing Methods for Providing KPI Data to Agents for Aggregation."
In this article, we aggregate by attaching files to chat, the simplest method.
5.2 Embedding Python in the Prompt to Fix the Calculation
You can attach an Excel file to the chat, ask it to "aggregate," and the code interpreter will generate and execute Python to perform the aggregation.
This basic usage was covered in the 5th article, so in this article we go one step further and explore whether aggregation can be fixed deterministically.
Since the code interpreter has AI regenerate Python code with each request, there remains uncertainty about "whether the code changes every time even for the same aggregation" and "whether it's really performing the same calculation."
Therefore, we tried embedding the Python code used for aggregation entirely in the prompt, instructing it to "execute this code as-is without regenerating," to see if the calculation could be fixed.
In the test chat, attach the kpi-raw-data-yoy.xlsx prepared in Chapter 4 and make the following request.
Please execute the following Python code in the code interpreter as-is, without regenerating it. The input is the attached Excel (RawMonthly sheet). Please replace INPUT in the code with the path of the attached file. Please show the executed code and output as-is.

import pandas as pd
df = pd.read_excel(INPUT, sheet_name="RawMonthly")
df["Year"] = df["Month"].astype(str).str[:4]
g = df.groupby(["Company","Year"], as_index=False).agg(ARR=("ARR","mean"), NRR=("NRR","mean"), OPM=("OPM","mean"))
order = ["CloudNova","StreamForge","Datapeak"]
rows = []
for c in order:
    a24 = g[(g.Company==c)&(g.Year=="2024")].iloc[0]
    a25 = g[(g.Company==c)&(g.Year=="2025")].iloc[0]
    yoy = (a25.ARR / a24.ARR - 1) * 100
    rows.append([c, round(a24.ARR), round(a25.ARR), f"{round(yoy,1):+}%", round(a25.NRR), round(a25.OPM, 1)])
result = pd.DataFrame(rows, columns=["Company","2024 ARR Avg","2025 ARR Avg","ARR YoY","2025 NRR Avg","2025 OPM Avg"])
print(result.to_string(index=False))
I ran this prompt a total of 6 times in my environment. All used the same prompt (same embedded Python).
The results were as follows: The output values were the same for all 6 runs (matching the pass criteria from Chapter 4), and the calculations did not vary.
On the other hand, the actually executed code differed between runs. The differences appeared in the following 2 places.
- The file-reading line: Some runs executed exactly
pd.read_excel(INPUT, sheet_name="RawMonthly")as embedded, while in other runs it was rewritten to convert Excel to CSV first and usepd.read_csv(...)(since the prompt instructs to "replaceINPUTwith the path of the attached file," the reading method is left to the code interpreter). - Quoting style: In 2 of the 6 runs, the entire code had double quotes
"..."reformatted to single quotes'...'.
Conversely, everything other than these 2 places (the aggregation logic itself: groupby for averaging, year-over-year, rounding, and output) was the same across all 6 runs. The breakdown of the 6 runs is as follows.
| Run | Reading line | Quotes | Output |
|---|---|---|---|
| 1 | pd.read_csv('…RawMonthly.csv') |
Double | Pass criteria |
| 2 | pd.read_excel(INPUT, sheet_name=…) |
Double | Pass criteria |
| 3 | pd.read_csv(INPUT) |
Single | Pass criteria |
| 4 | pd.read_csv(INPUT) |
Single | Pass criteria |
| 5 | pd.read_excel(INPUT, sheet_name=…) |
Double | Pass criteria |
| 6 | pd.read_excel(INPUT, sheet_name=…) |
Double | Pass criteria |
Even in the actual screens from Run 1 (left) and Run 2 (right), the aggregation result tables match despite the different reading lines.
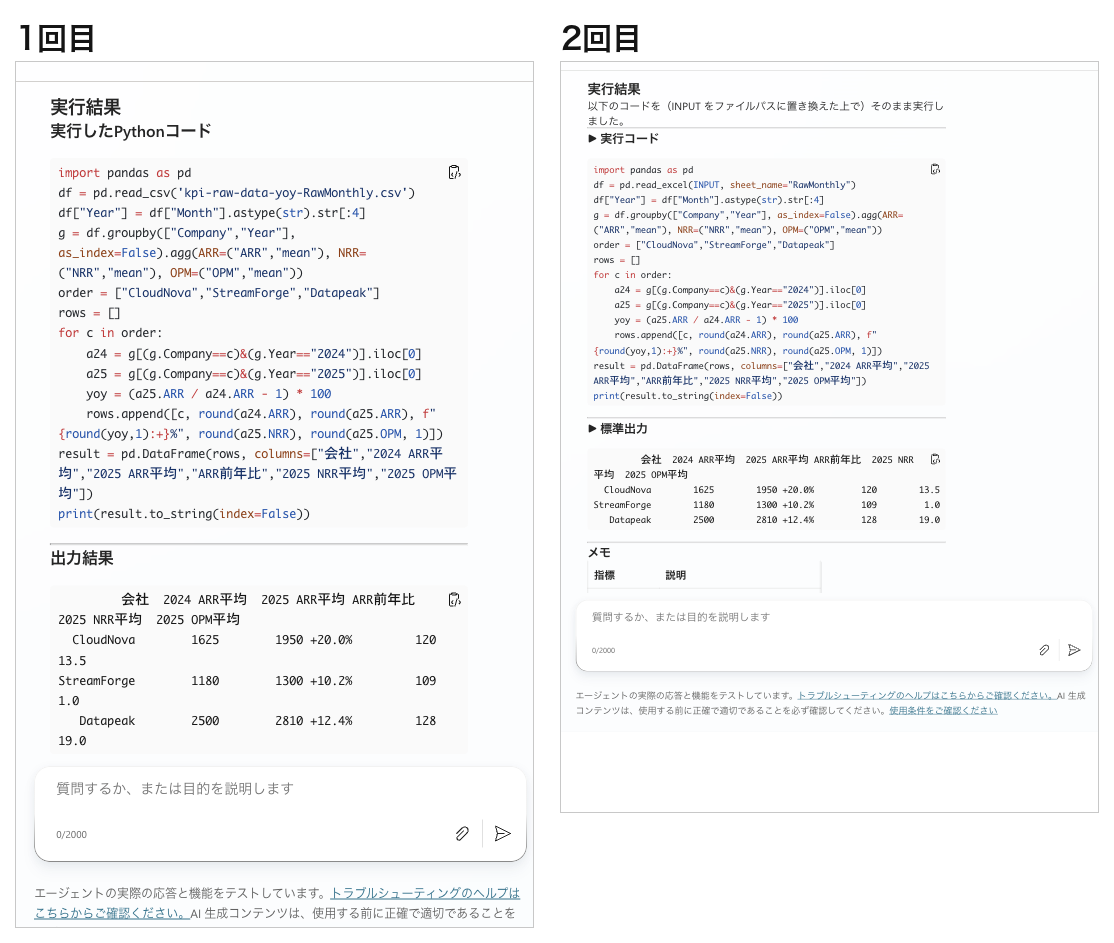
Left is Run 1, right is Run 2 (2 of the 6 runs). The file reading line differs (Run 1: pd.read_csv(...)/Run 2: pd.read_excel(INPUT, ...)), but the aggregation logic and output (CloudNova +20.0%, StreamForge +10.2%, Datapeak +12.4%) are the same.
It is difficult to fix every character of the code in the code interpreter's prompt. Since the content entered in the prompt goes through an LLM, it may be modified.
If you want the executed code to be exactly the same character by character every time, a method like Office Script in the next chapter—where pre-written code runs as-is—is more reliable.
5.3 Code Interpreter Caveat: Responses Take Time
An important thing to note when aggregating with the code interpreter is the time until a response. In my environment, the time required was about 2.5 minutes for Run 1 and about 3 minutes for Run 2. Even so, results were returned because I ran them directly in the test chat, which has no time constraints.
In production, this aggregation would be called as a tool via an agent flow, but agent flows have a time constraint where "anything exceeding 2 minutes fails." The code interpreter, which can take minutes, is prone to hitting this constraint. Since the agent flow response time constraint is common to both Office Script and code interpreter, it is summarized in Chapter 7.
Note that the verification in this article was performed in the simplest test chat.
6. Approach 2: Aggregating with Office Script
Approach 2 involves writing aggregation processing in Excel's Office Script (TypeScript) and executing it from a Copilot Studio agent flow.
As described in 5.2, while the code interpreter can mostly fix the calculation logic by embedding it in the prompt, the file reading line cannot be fixed character by character.
If you want to "write the aggregation code once and execute it exactly the same way every time," a method like Office Script that fixes the code in advance is more appropriate.
Office Script works with standard connectors, doesn't incur premium billing (Copilot Credits) like the code interpreter, and the AI never regenerates the code.
In the Copilot Studio tool addition screen, agent flows are described as "predictable automation that runs the same way every time," which differs in nature from the code interpreter's "generate each time."
6.1 Writing the Office Script
When you think of "writing processing in Excel," you might think of VBA macros. The reason we use Office Script rather than VBA this time is that only Office Script can be called from a flow (Copilot Studio agent flow). The main differences are as follows.
| Aspect | Office Script | VBA Macro |
|---|---|---|
| Execution environment | Cloud / Cross-platform (centered on Excel for the web; also works on Windows/Mac desktop) | Desktop only (Windows/Mac) |
| Language | TypeScript (JavaScript) | VBA |
The fundamental difference is that VBA macros are developed for desktop solutions and Office Scripts are designed for secure, cross-platform, cloud-based solutions.
Source: Differences between Office Scripts and VBA macros | Microsoft Learn
Open the aggregation target kpi-raw-data-yoy.xlsx in Excel for the web, and from "Automate" tab → "New Script" → "Create in Code Editor", save the following script (named KPIQuarterAggYoY here).
It reads the RawMonthly sheet, calculates the average ARR, NRR, and OPM by company and year, computes the year-over-year change for ARR, and returns the result as CSV-formatted text.
Office Script (click to expand)
function main(workbook: ExcelScript.Workbook): string {
  // Read RawMonthly (Company, Month, ARR, NRR, OPM), average by company × year, and deterministically aggregate ARR year-over-year
  const values = workbook.getWorksheet("RawMonthly").getUsedRange().getValues();
  const map: { [k: string]: { arr: number[]; nrr: number[]; opm: number[] } } = {};
  for (let i = 1; i < values.length; i++) {
    const company = String(values[i][0]);
    const year = String(values[i][1]).substring(0, 4);
    const key = company + "|" + year;
    if (!map[key]) map[key] = { arr: [], nrr: [], opm: [] };
    map[key].arr.push(Number(values[i][2]));
    map[key].nrr.push(Number(values[i][3]));
    map[key].opm.push(Number(values[i][4]));
  }
  const mean = (xs: number[]) => xs.reduce((a, b) => a + b, 0) / xs.length;
  let out = "Company,2024ARRAvg,2025ARRAvg,ARRYoY,2025NRRAvg,2025OPMAvg\n";
  for (const c of ["CloudNova", "StreamForge", "Datapeak"]) {
    const a24 = mean(map[c + "|2024"].arr);
    const a25 = mean(map[c + "|2025"].arr);
    const yoy = (a25 / a24 - 1) * 100;
    out += `${c},${a24.toFixed(0)},${a25.toFixed(0)},${yoy >= 0 ? "+" : ""}${yoy.toFixed(1)}%,`
         + `${mean(map[c + "|2025"].nrr).toFixed(0)},${mean(map[c + "|2025"].opm).toFixed(1)}\n`;
  }
  return out;
}
The code above is the complete script.
Office Script has no import statements like Python. main(workbook: ExcelScript.Workbook) is the sole entry point, and the ExcelScript API for operating Excel is available from the start, so no additional imports are needed.
Each script must contain a
mainfunction with theExcelScript.Workbooktype as its first parameter. When the function runs, the Excel application invokes themainfunction by providing the workbook as its first parameter.
Source: Fundamentals for Office Scripts in Excel | Microsoft Learn
After saving the script and clicking "Run," my environment displayed "Script ran successfully," confirming that the aggregation logic works.
6.2 Running the Script from an Agent Flow
From the agent's "Add a tool" → "Agent flow", create a new flow.
The template includes the trigger "When an agent calls a flow" and "Respond to the agent", so insert "Run script" (Excel Online (Business) connector) between them.
- Run script: Location = OneDrive for Business, Document Library = Documents, File =
/kpi-raw-data-yoy.xlsx, Script =KPIQuarterAggYoY - Respond to the agent: Add one text output
result, and for its value, select the return value of "Run script" (result) from "Dynamic content" (in formula:body/result)
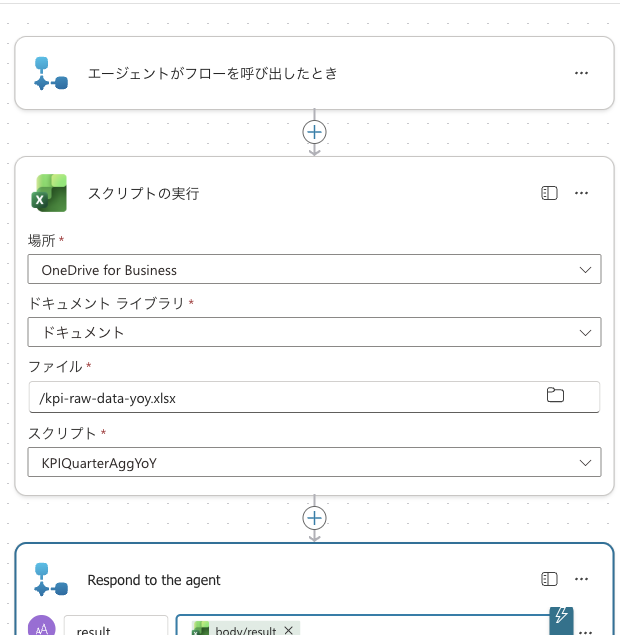
Trigger when agent calls the flow (Skills) → "Run script" (Location = OneDrive for Business, File = /kpi-raw-data-yoy.xlsx, Script = KPIQuarterAggYoY) → "Respond to the agent" passes the script's return value (result) to the output result
Save and publish the created flow (this is publishing the flow itself, not the agent). Once published, it is added to the agent as a tool.
6.3 Testing
From the test chat, request execution of this flow.
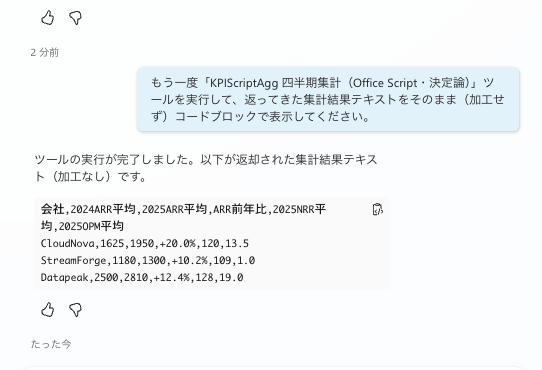
Please execute the "KPIScriptAgg Quarterly Aggregation (Office Script · Deterministic)" tool and display the returned aggregation result text as-is (without processing) in a code block.
On first run, allow the connection to Excel Online (Business) (connection using the person's own credentials).
In my environment, the agent called the flow, and the CSV returned by the Office Script was returned as-is. The values match the pass criteria from Chapter 4.
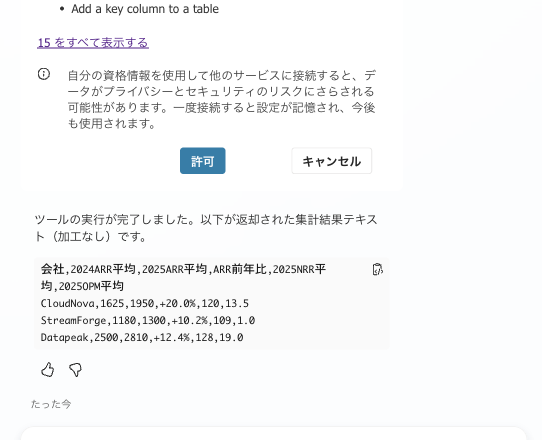
1st run. After allowing connection to Excel Online, the flow was executed, and the aggregation CSV returned by the Office Script (CloudNova +20.0%, StreamForge +10.2%, Datapeak +12.4%) was returned as-is.
Running it again with a new request returned exactly the same values. Since it executes the pre-written script as-is, the results are stable, as expected.
2nd run. The same tool was executed, and exactly the same CSV as the 1st run was returned. Unlike the code interpreter, the code is never regenerated.
The 2nd run returned results within a dozen seconds of sending, well within the agent flow response time constraint (synchronous response times out at 2 minutes, recommended within 100 seconds; details in the next chapter).
The strength of Office Script is not "no time limit" but rather the ability to execute fixed code exactly the same way every time. The deterministic aggregation in this case is inherently lightweight and fit comfortably within the default synchronous response (a dozen seconds).
7. Agent Flow Response Time (Common Caveat)
Both the code interpreter and Office Script will, in production, have the agent call an "agent flow" as a tool (while the verification in this article was done in the test chat, actual operation goes through flows).
Since both approaches share a common "response time" constraint for this flow, it is summarized here.
7.1 Default is Synchronous Response: Times Out at 2 Minutes, 100 Seconds Recommended
When an agent flow is called as a tool, it defaults to synchronous response. Synchronous response means the agent waits in place for the flow's response. Since the agent cannot wait indefinitely, it fails if it exceeds 2 minutes. Furthermore, Respond to the agent recommends responding within 100 seconds.
By default, an agent or app initiates an agent flow that fails if it takes longer than two minutes to respond to the calling agent or app.
Source: Speed up agent flow execution with express mode (preview) | Microsoft Learn
Respond to the agent within the 100 second action limit. Optimize the flow logic, queries, and the amount of data returned so that a typical run is below this 100 second limit.
Source: Modify an existing flow to use with an agent | Microsoft Learn
In other words, putting heavy processing like the code interpreter (which took 2.5–3 minutes in my environment) directly in a synchronous flow risks timing out at the 2-minute constraint. On the other hand, lightweight aggregation like the Office Script in this case finishes within a dozen seconds without issue. The point to note is that "running in a flow doesn't remove time limits."
7.2 Heavy Subsequent Processing Can Be Placed After the Response (Up to 30 Days)
While the response itself must be returned within 2 minutes (recommended 100 seconds), this doesn't mean all processing must fit within 2 minutes.
Processing placed after Respond to the agent can continue in the background for up to 30 days after the response is returned.
However, the results of that subsequent processing cannot be included in the response (because the response has already been returned).
Respond to the agent within the 100 second action limit. ... Actions in the flow that need to run longer can be placed after the Respond to the agent action to continue to run up to the flow run duration limit of 30 days.
Source: Modify an existing flow to use with an agent | Microsoft Learn
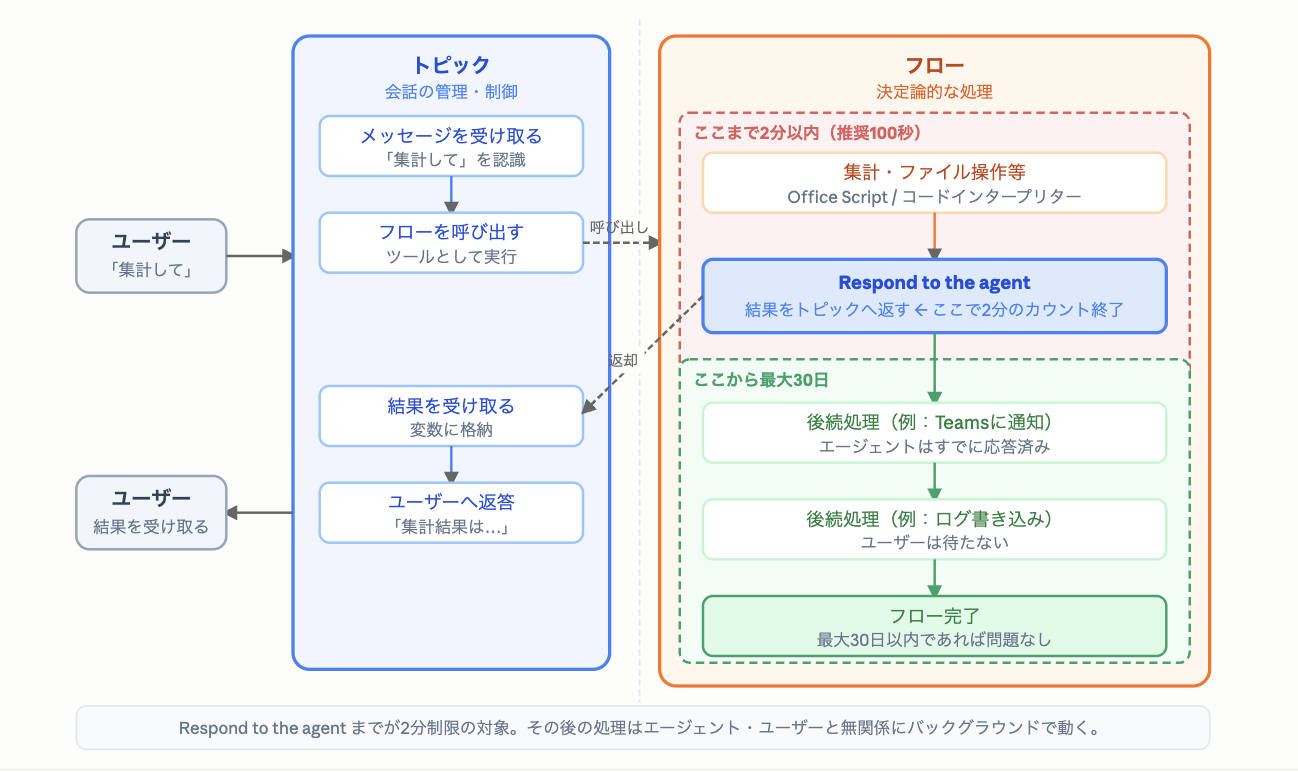
Call the flow as a tool, complete "aggregation/file operations (Office Script/code interpreter) → Respond to the agent" within 2 minutes (recommended 100 seconds) to return results. Subsequent processing placed after Respond to the agent (e.g., Teams notifications, log writing) continues in the background for up to 30 days after responding to the user.
8. How to Choose Between the Two Approaches
After running both on actual hardware, the choice can be organized around "whether it's okay to have AI generate code each time."
- If you want to flexibly request aggregation in natural language, like year-over-year comparisons, forecasts, or table joins, choose Approach 1 (code interpreter). It can calculate with Python, and can also generate aggregation tables, charts, and Excel files. However, it requires premium billing and responses can take minutes. By embedding code in the prompt, the substance of the calculation (aggregation logic) and output can be fixed (output matched in all 6 trials). However, the code cannot be fixed character by character—the file reading line and quoting style may vary between runs.
- If you want to write the aggregation logic once and execute it exactly the same way every time, choose Approach 2 (Office Script). Processing written in TypeScript is executed from the flow, so it doesn't incur premium billing (Copilot Credits) and the code is never regenerated.
Both approaches are the same in that they don't let the LLM perform calculations, and the substance of the calculations can be fixed.
The difference is that with the code interpreter, AI assembles the code for each request, so while embedding fixes the substance of the calculation and output, the reading line and quoting style can vary between runs, whereas with Office Script, the pre-written code runs character for character exactly as written.
In the final goal of an end-to-end agent, a realistic approach would be to assign roles—Office Script for lightweight fixed aggregation, code interpreter for flexible analysis.
9. Summary
If you perform aggregation deterministically without relying on an LLM, you can maintain the accuracy of report numbers.
This article tried two approaches.
Office Script, since the pre-written TypeScript runs as-is, always returns the same result for the same input.
The code interpreter, by embedding the Python code used for aggregation in the prompt, can fix the substance of the calculation (aggregation logic) and output, and we confirmed the same values were returned every time across 6 trials. However, the code cannot be fixed character by character—the file reading line and quoting style are not fixed.
The axis for choosing is simple: if the aggregation content is determined and you want it executed reliably the same way, choose Office Script with no premium billing; if you need flexible analysis like year-over-year comparisons or forecasts, choose the code interpreter (premium).
Note that the synchronous response time constraint (times out at 2 minutes, recommended within 100 seconds) is common to both the code interpreter and agent flows, and "flows don't have limits" is not the case.
In this verification, the two approaches returned the same values.
However, this only matched because both were written with the same aggregation logic and the same rounding—since they are separate implementations (Python and Office Script), if the implementation diverges, the results can differ.
"Having two methods doesn't guarantee the same values," so if using both together, it's safer to cross-check the results to confirm they match.
In any case, we confirmed the division of responsibility: leave the calculations themselves to deterministic means, and let the LLM handle only insertion and the text generation of insights.
Next time, we'll turn these aggregated values into charts.