![[Copilot Studio] KPI Report End-to-End from Collection to Distribution: Final Configuration of Parent + Document Creation Sub](https://images.ctfassets.net/ct0aopd36mqt/wp-thumbnail-00eddef75cb5ee39286e0aa370a96e4f/040bbf127b84da0ee2c483485da1dd29/microsoft-eyecatch.jpg?w=3840&fm=webp)
[Copilot Studio] KPI Report End-to-End from Collection to Distribution: Final Configuration of Parent + Document Creation Sub
This page has been translated by machine translation. View original
Introduction
Hello, I'm Keima.
Comparing KPIs across multiple SaaS companies, adding charts and insights, and distributing the results as a report is a common task in corporate planning and customer success teams.
Throughout this series, I've individually examined each step of "collection → aggregation → charts → insights → documentation → distribution," and in this final installment, I'll bring everything together into a single agent that runs end-to-end from a single request.
In this article, I'll walk through the process of building the integrated agent "KPI Integration Assistant" from an empty agent, one piece at a time, verified with hands-on testing as of June 2026.
The parent agent holds collection (SharePoint knowledge), a documentation sub (child agent), and a distribution flow, connecting everything from a single-sentence request through comparison, insights, Word/Excel/PowerPoint generation, and download links.
I've also included tips for preventing garbled Japanese characters on chart axis labels, and tips for reliably producing download links.
I hope this serves as a reference for those who want to automate document creation end-to-end with Copilot Studio.
This article is the 12th (and final) installment of the series on building agents with Copilot Studio.
Throughout the series, the goal has been to build an agent that handles "collection → aggregation → charts → insights → documentation" end-to-end. This article serves as the final culmination, integrating all steps into a single agent.
Target audience: Those who want to automate KPI comparison report creation from collection to distribution using Copilot Studio
Note: The company names (CloudNova / StreamForge / Datapeak) and KPI figures used in this article are all fictitious data.
Series Article List
| # | Theme | Article |
|---|---|---|
| Part 1 | First Agent | Creating My First Agent |
| Part 2 | Knowledge | Trying Knowledge-Grounded Answers Based on Files |
| Part 3 | Topics, Tools, and Flows | Building "Behavior" with Topics, Tools, and Agent Flows |
| Part 4 | Templates, Autonomous Triggers, Multi-Agent | Expanding the Configuration with Templates, Autonomous Triggers, and Multi-Agent |
| Part 5 | Collection (How to Pass Data) | Comparing Methods for Providing KPI Data to an Agent for Aggregation |
| Part 6 | Aggregation | Performing KPI Aggregation Deterministically Without Relying on LLMs |
| Part 7 | Charts | Displaying KPIs as Charts Within Chat |
| Part 8 | Insights | Generating Insights from Aggregated Figures |
| Part 9 | Documentation (Word) | Auto-Generating Word Reports by Inserting Figures into Templates |
| Part 10 | Documentation (PowerPoint / Excel) | Generating Real .pptx/.xlsx Files from Scratch with Code Interpreter |
| Part 11 | Distribution | Distributing Generated Word Reports as Download Links via Flow |
| Part 12 | Integration (Final) | (This article) |
1. What We're Building
What we're building in this article is an agent with the following configuration.
- Create a new parent agent "KPI Integration Assistant" from an empty state
- Turn on Code Interpreter for aggregation and documentation, and turn off "Allow ungrounded responses" to suppress hallucinations
- Provide collection via a single SharePoint raw data (Excel) knowledge source
- Delegate documentation (generation of Word, Excel, and PowerPoint files) to a child agent called "Documentation Sub"
- Fix distribution with an agent flow (OneDrive save + sharing link)
- Connect everything from a single request through comparison, insights, Word/Excel/PowerPoint generation, and download links
2. Overview: Parent + Documentation Sub
The series articles were written by process step (collection, aggregation, charts, insights, documentation, distribution), but the actual agent we're running doesn't simply line up the steps — instead, it's divided into a parent orchestrator, a sub that handles documentation, and a fixed distribution flow.
The only part being made into a sub-agent (child agent) this time is "documentation."
Collection is handled by knowledge, and distribution is handled by a flow — components separate from the sub-agent.
KPI Integration Assistant (Parent Agent)
  Reception, collection, comparison, insights, and consolidation are handled by the parent itself

  ┌─ Components held directly by the parent (not sub-agents)
  │     Knowledge : SharePoint raw data kpi-raw-data-yoy.xlsx     → Collection
  │     Tool      : Distribution flow (OneDrive save → org-internal sharing link) → Distribution
  │
  └─ Child agent delegated by the parent (this is the only sub-agent)
        Documentation Sub : Generates Word/Excel/PPT with Code Interpreter → Documentation
Since the parent directly references SharePoint knowledge for collection, no dedicated collection sub is created.
Aggregation, charts, and insights are also handled by the parent (and Code Interpreter) based on figures from the knowledge source.
The correspondence between each step, the component that handles it, and the relevant series installment is as follows.
| Step | Component | Series Installment |
|---|---|---|
| Collection | SharePoint document library knowledge | Parts 2 & 5 |
| Aggregation | Code Interpreter (Python) | Part 6 |
| Charts | Code Interpreter (Excel native charts & images) | Parts 7 & 10 |
| Insights | Language model generation (policy defined via instructions) | Part 8 |
| Documentation | Code Interpreter (Word, PowerPoint, Excel) | Parts 9 & 10 |
| Distribution | Agent flow (OneDrive save + sharing link) | Part 11 |
The reason for this division is that each step has a different nature.
Component selection in generative orchestration is a probabilistic judgment by the LLM, so distribution — where we want guaranteed consistent behavior — is fixed with a flow.
On the other hand, Code Interpreter can take minutes to respond, which doesn't fit within the 100-second limit of synchronous flows, so it's held as a chat capability of the child agent rather than being put into a flow.
Respond to the agent within the 100-second action limit. Optimize the flow logic, queries, and the amount of data returned so that a typical run is below this 100-second limit.
Source: Add an agent flow or workflow as a tool to an agent | Microsoft Learn
Child agents are lightweight subs contained within the parent, requiring no separate publishing or licensing.
Child agents are lightweight agents within your existing agent.
Source: Add other agents overview | Microsoft Learn
3. Step 1: Create the Parent Agent
First, create a new empty agent.
Open "Agents" → "New agent" from the left menu in Copilot Studio, and proceed to manual configuration via something like "Skip to settings."
Name it "KPI Integration Assistant".
Once created, write the agent's role and how it should handle figures in the "Instructions" field on the overview screen.
This time, I wrote it in Japanese, including delegation instructions.
You are the "KPI Integration Assistant."
Use only the KPI figures in the knowledge (CloudNova, StreamForge, Datapeak) in your responses. You must not fabricate figures. If a value is not available, explicitly state "not provided."
When asked for comparisons or insights, return a comparison table of the three companies and brief insights in Japanese.
When asked to create Word, Excel, or PowerPoint files (reports, tables, or slides), always delegate to the child agent "Documentation Sub" and return the download link produced there.
Always respond to the user in Japanese.
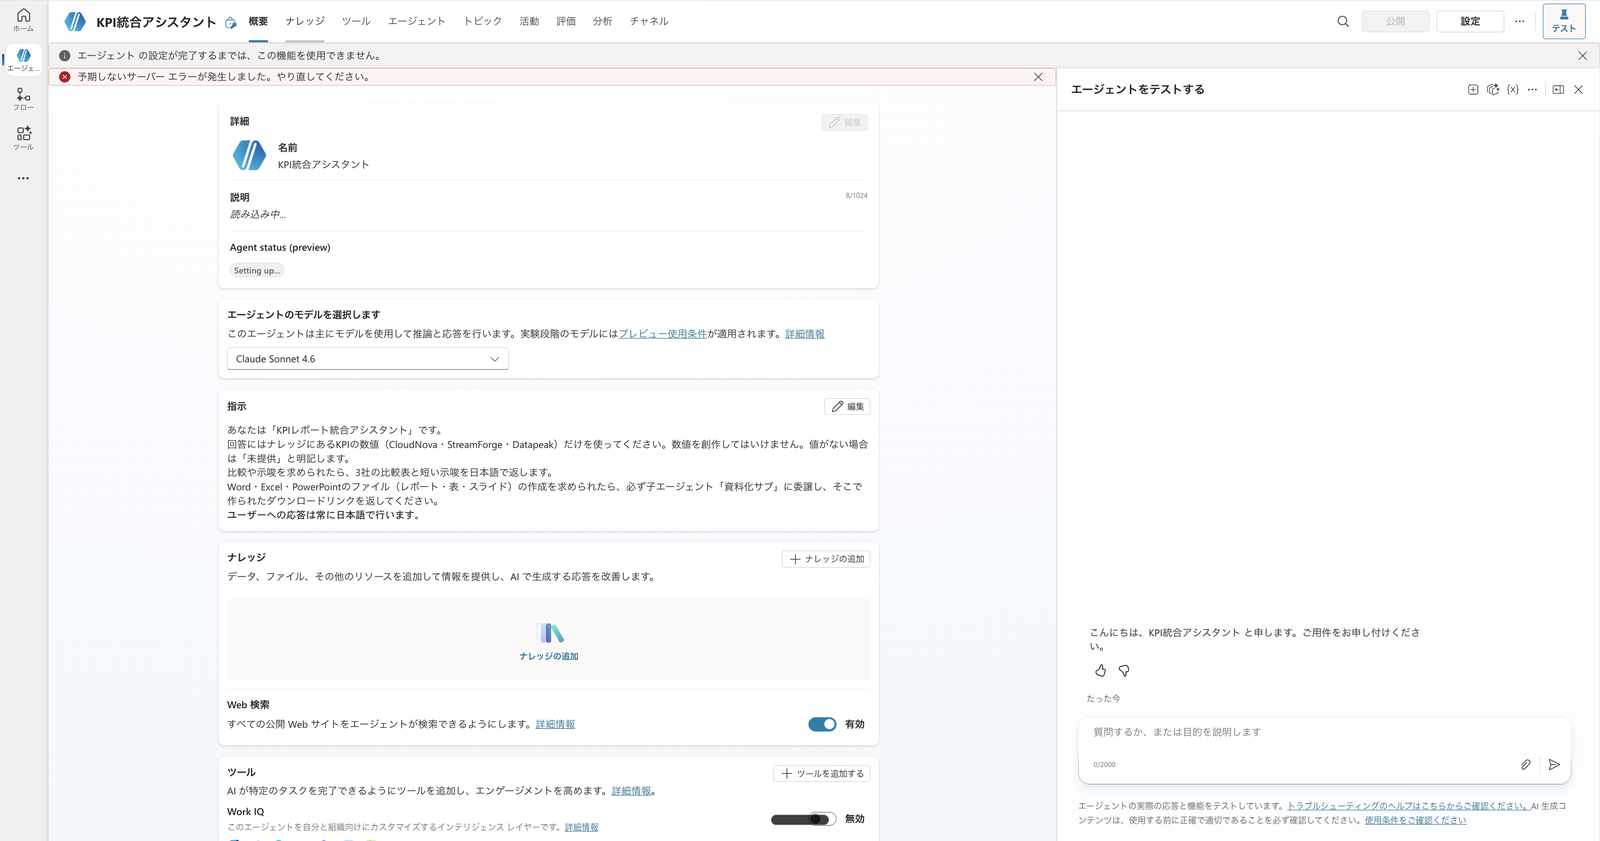
Overview screen of the "KPI Integration Assistant" created from an empty agent. Set the name and instructions (in Japanese)
The reason the instructions explicitly state "use only figures from knowledge / do not fabricate figures" is to prevent the generative AI from performing calculations itself — interpretation is left to the AI, but actual numerical computation is delegated to Code Interpreter downstream.
4. Step 2: Turn Code Interpreter On, Turn Off Ungrounded Responses
The core of aggregation, charts, and documentation is Code Interpreter.
To use it, enable it in the agent's settings.
Open "Settings" → "Generative AI" and turn "Code Interpreter" On.
On the same screen, turn "Allow ungrounded responses" Off.
This prevents the generative AI from fabricating figures that have no basis in the knowledge source.
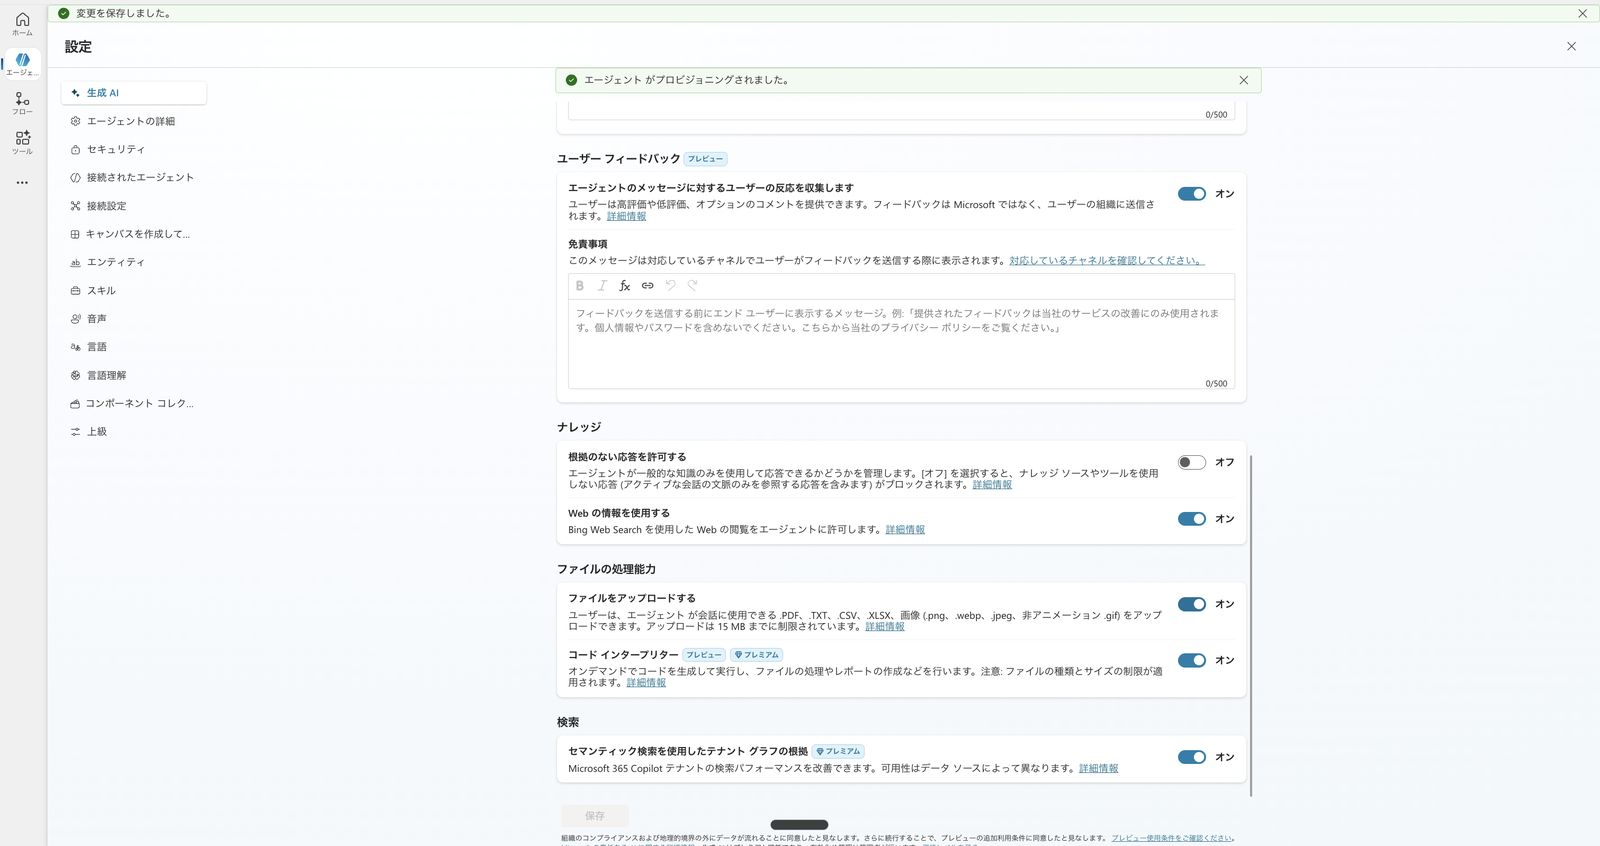
Under Settings > Generative AI: Code Interpreter (Python execution) turned on, and "Allow ungrounded responses" turned off
5. Step 3: Add Collection via SharePoint Knowledge
Next, add the raw KPI data for all three companies as knowledge.
This is the "collection" step.
The key point here is: if you want Code Interpreter to perform aggregation, place the raw data in a SharePoint document library rather than uploading it as a file.
Code Interpreter can use structured files (Excel, CSV) for aggregation only in the following two cases:
- The end user uploads a structured file during chat
- The maker adds a SharePoint Documents library containing structured files as a knowledge source
Copilot Studio agents can use code interpreter to analyze structured files that are provided to the agent by the following two ways:
- As an end-user, when you upload structured files while chatting with the agent.
- As a maker, when you add SharePoint Documents library as a knowledge source, which in turn contains the structured files.
Source: Use code interpreter to analyze structured data (preview) | Microsoft Learn
In other words, simply uploading an Excel file as a standard file knowledge source does not allow Code Interpreter to read its contents directly for aggregation.
In this case, we place the raw data file kpi-raw-data-yoy.xlsx (containing monthly ARR and other data for three companies) in a SharePoint document library and use that as the knowledge source.
This single file serves both as the "basis" when answering in text, and as the "raw data" when aggregating with Code Interpreter.
From the parent agent's "Knowledge" → "Add knowledge", select "SharePoint", then use "Browse items" to select kpi-raw-data-yoy.xlsx from within the library and add it.
After adding it, wait until the status shows "Ready" (indexing complete) and the type is registered as SharePoint.
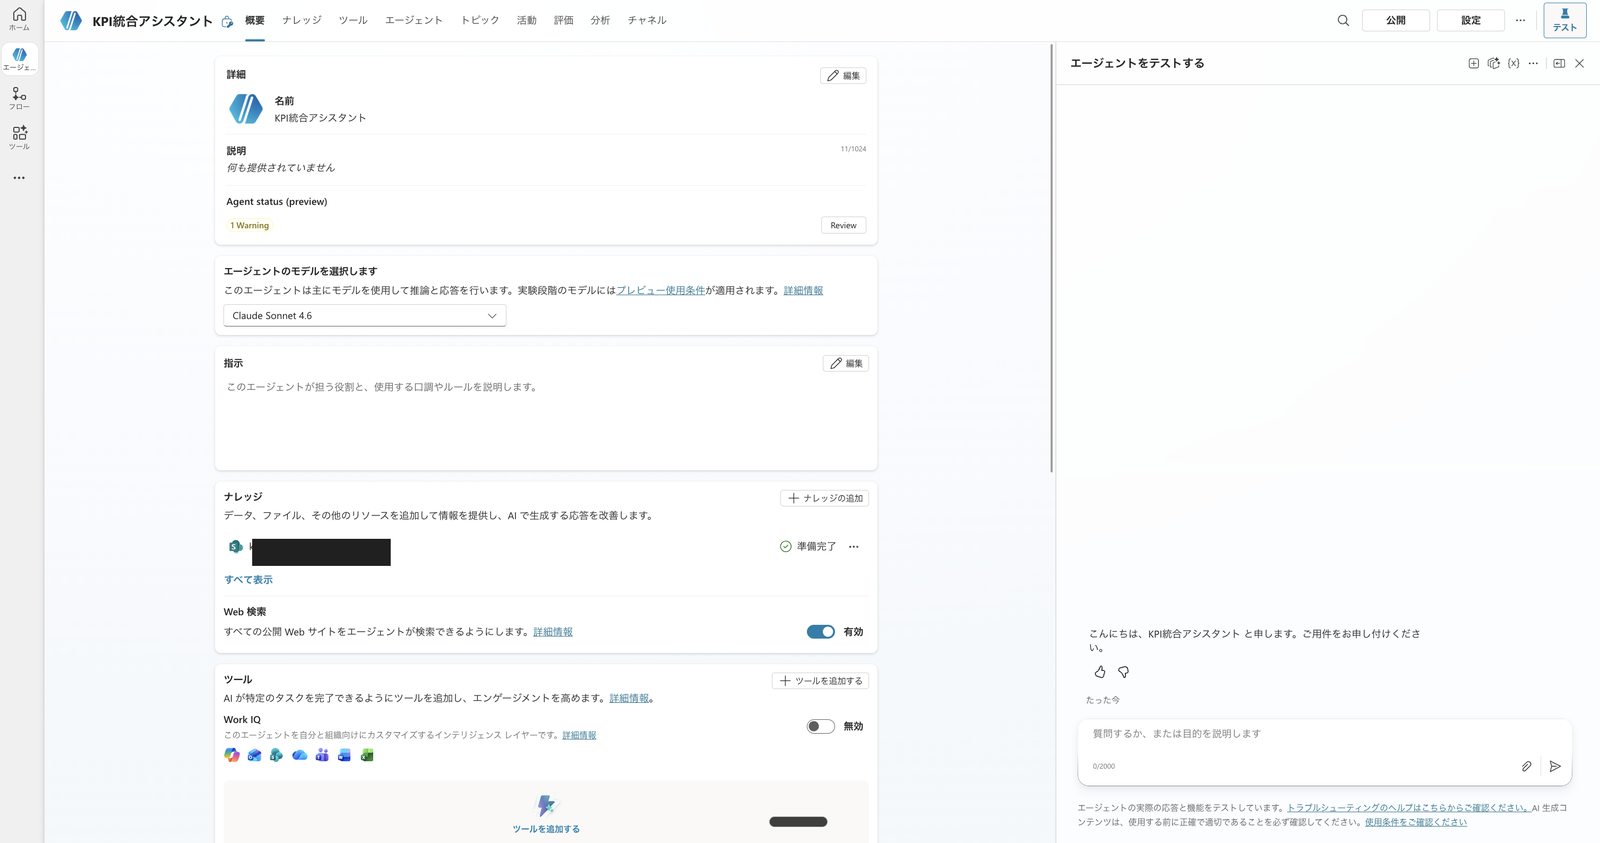
Parent agent overview screen after adding the raw data for aggregation (Excel on SharePoint) to Knowledge, with status showing "Ready"
6. Step 4: Create the Documentation Sub (Child Agent)
Among aggregation, charts, and documentation, file generation is delegated to a child agent.
This is because Code Interpreter can take minutes to respond, making it difficult to fit into a synchronous flow.
Synchronous flows have a 100-second action limit, and flow logic, queries, and the amount of data returned must be optimized to stay within this limit.
Respond to the agent within the 100-second action limit. Optimize the flow logic, queries, and the amount of data returned so that a typical run is below this 100-second limit.
Source: Add an agent flow or workflow as a tool to an agent | Microsoft Learn
For this reason, Code Interpreter is not put into a flow but held as a chat capability of the child agent.
From the parent's "Agents" → "Add agent" → "New agent", create a child agent and name it "Documentation Sub" (in Japanese).
Write the Description and Instructions in Japanese as well, specifying when and what it does.
Description:
The Documentation Sub generates downloadable Office files from KPI figures.
When asked to create a Word document, Excel file, or PowerPoint, it uses Code Interpreter to create the file and returns a download link.
Excel charts use openpyxl's native BarChart (not embedded matplotlib images), so charts remain editable in Excel.
Instructions:
You create Office files (Word .docx / Excel .xlsx / PowerPoint .pptx) from the KPI figures provided to you.
Use Code Interpreter to create the files and always return a download link for each generated file.
Use only the figures provided to you; you must not fabricate values.
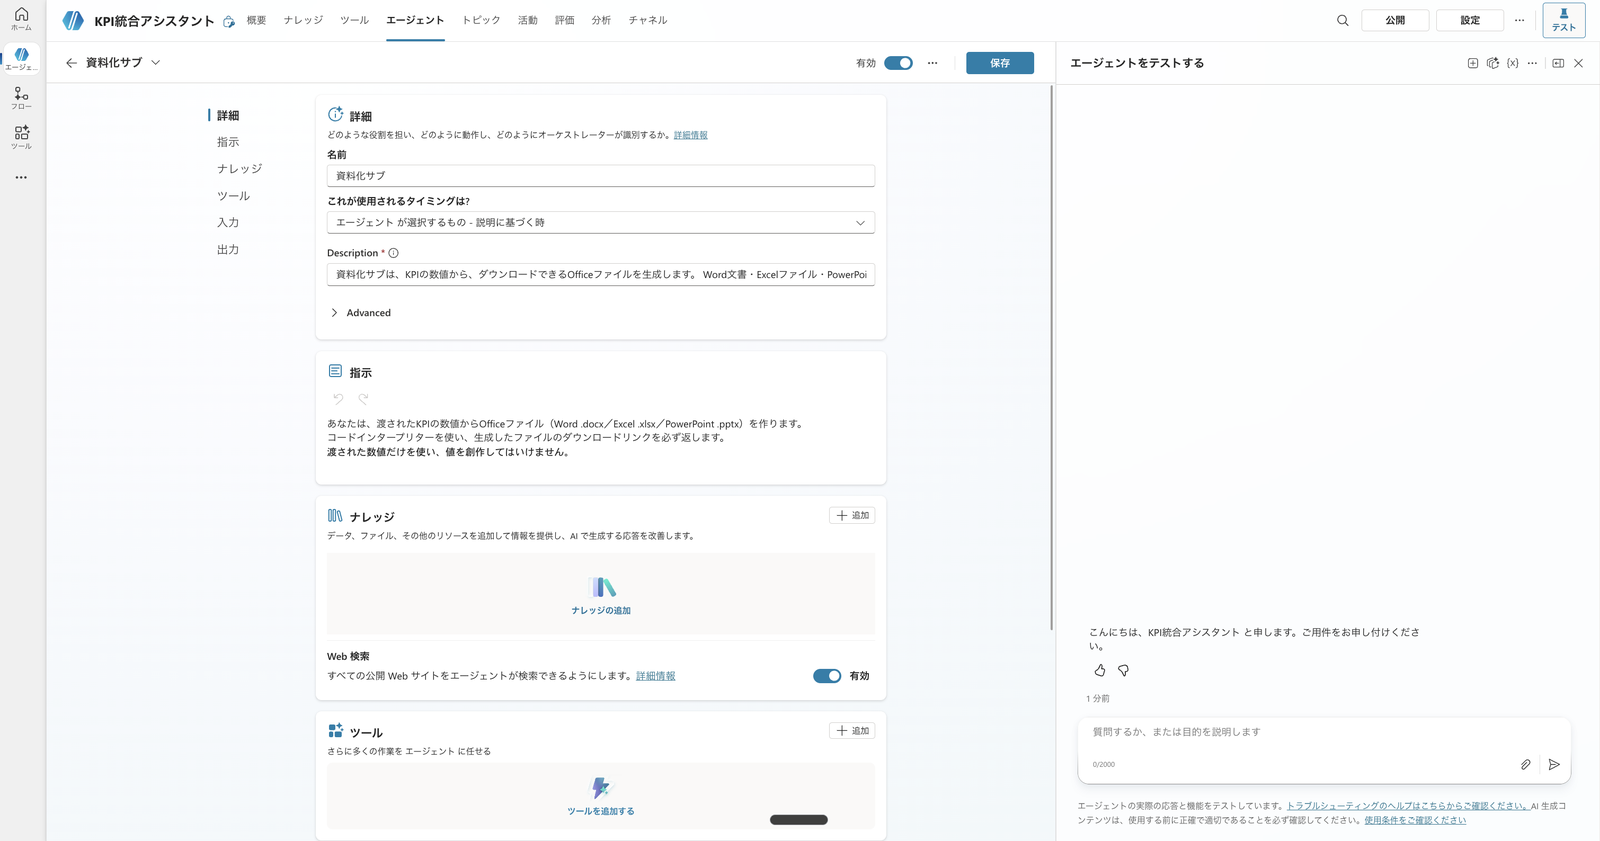
Settings for the child agent "Documentation Sub." The display name, description, and instructions are all in Japanese to test delegation
In this verification, even without adding knowledge to the Documentation Sub, the parent passes figures (comparison tables and raw data) during delegation, and the child can process them with Code Interpreter to generate files.
If the child says it doesn't have data and can't create files, add the SharePoint knowledge to the child as well.
7. Step 5: Confirm the Parent's Agent List
After creating the child, open the parent's "Agents" tab and confirm that "Documentation Sub" appears in the list.
Since we're not creating a collection sub this time, this is the only child agent.
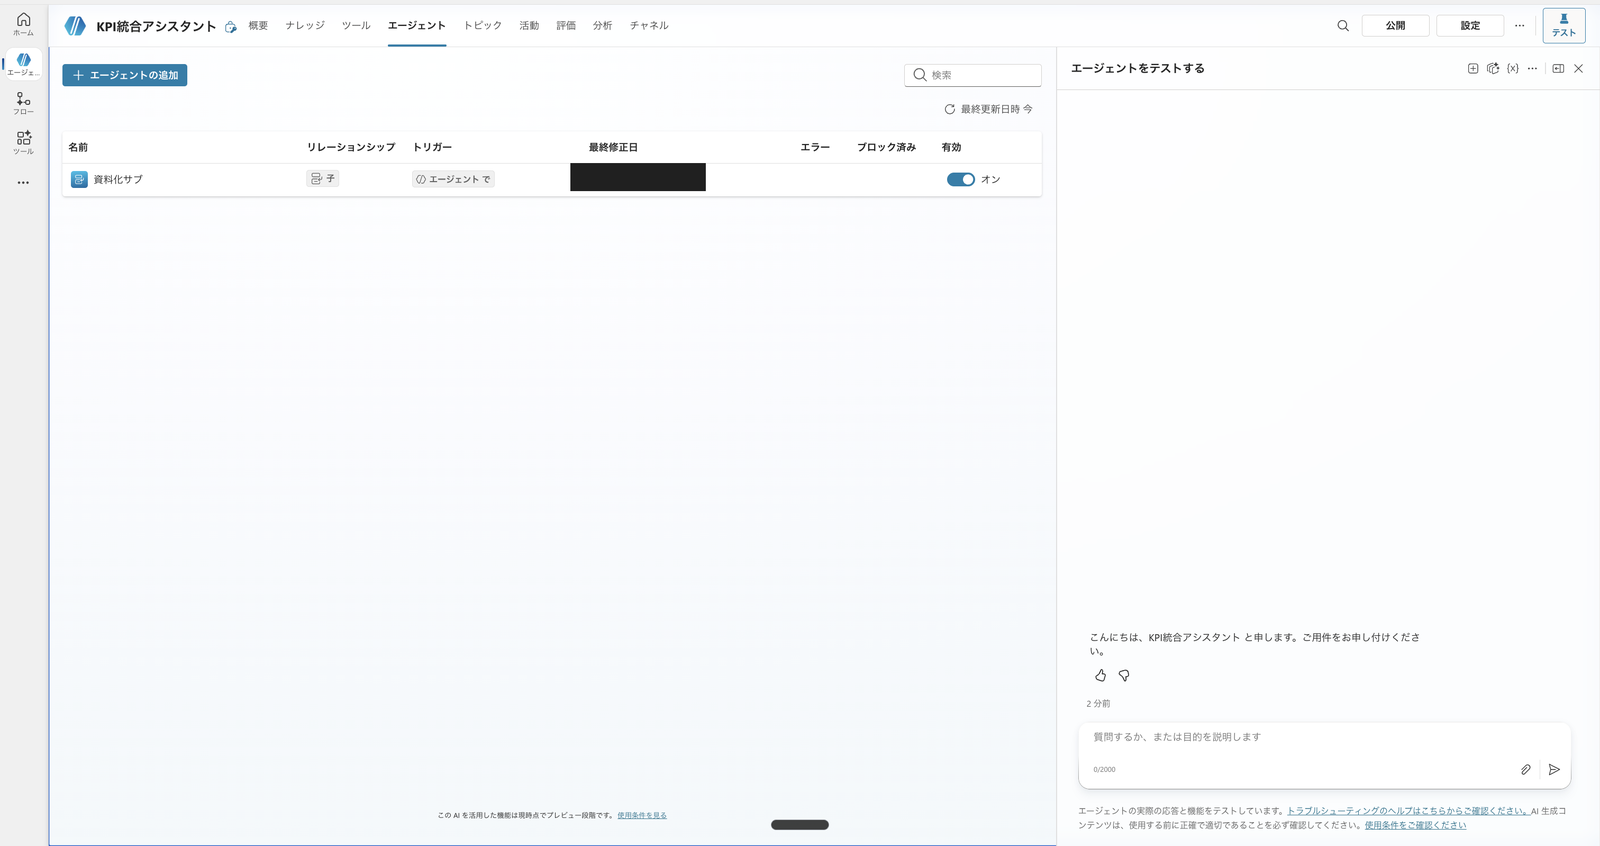
The Documentation Sub connected as a child agent (enabled = on) to the parent "KPI Integration Assistant"
8. Step 6: Fix Distribution with a Flow
For steps like distribution where you want the same procedure to run every time, fix it with an agent flow rather than leaving it to conversation.
Use the distribution flow created in Part 11 (OneDrive save → org-internal sharing link) as-is, and register it as a tool in the parent.
The distribution flow is built with the following 5 steps:
- Place the trigger "When an agent calls a flow"
- Execute a prompt (with Document output configured) that generates a Word report
- Create a file in OneDrive, saving the "Document Output Content Bytes" from the prompt output
- Use OneDrive's "Create a sharing link" to create an org-internal sharing link
- Use "Respond to agent" to return the sharing link URL to the parent
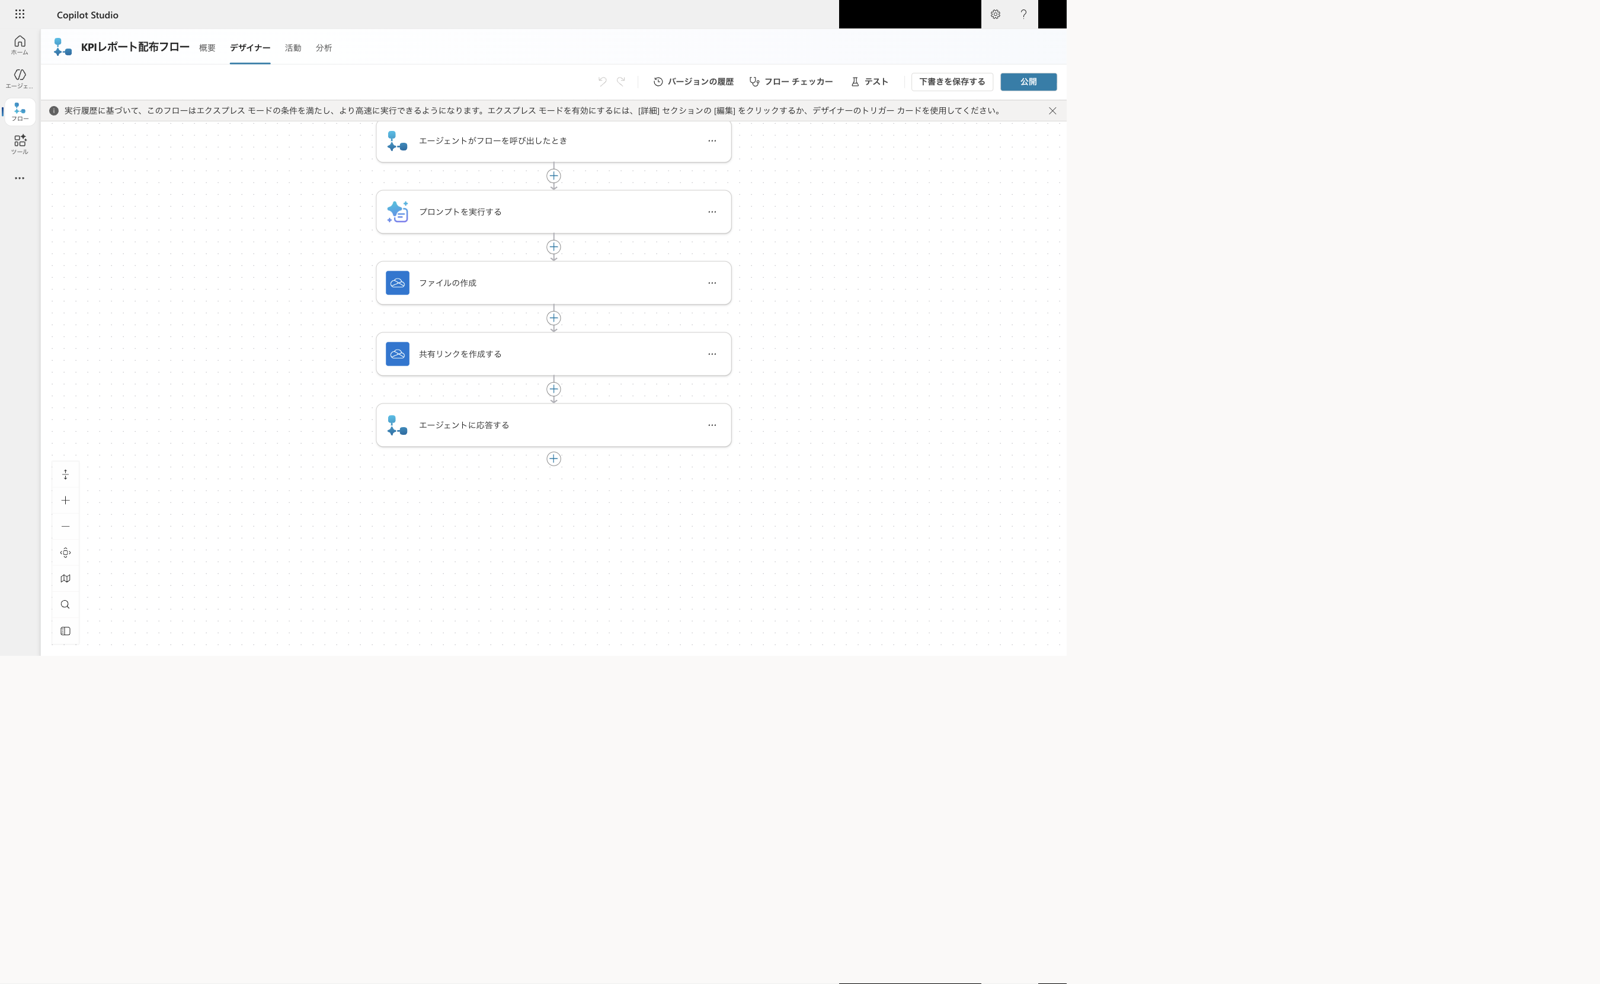
Distribution agent flow (created in Part 11). Saves to OneDrive, creates an org-internal sharing link, and returns it to the parent
Register this flow from the parent's "Tools" → "Add a tool" → "Flow", add a description that communicates when to use it, and turn it on.
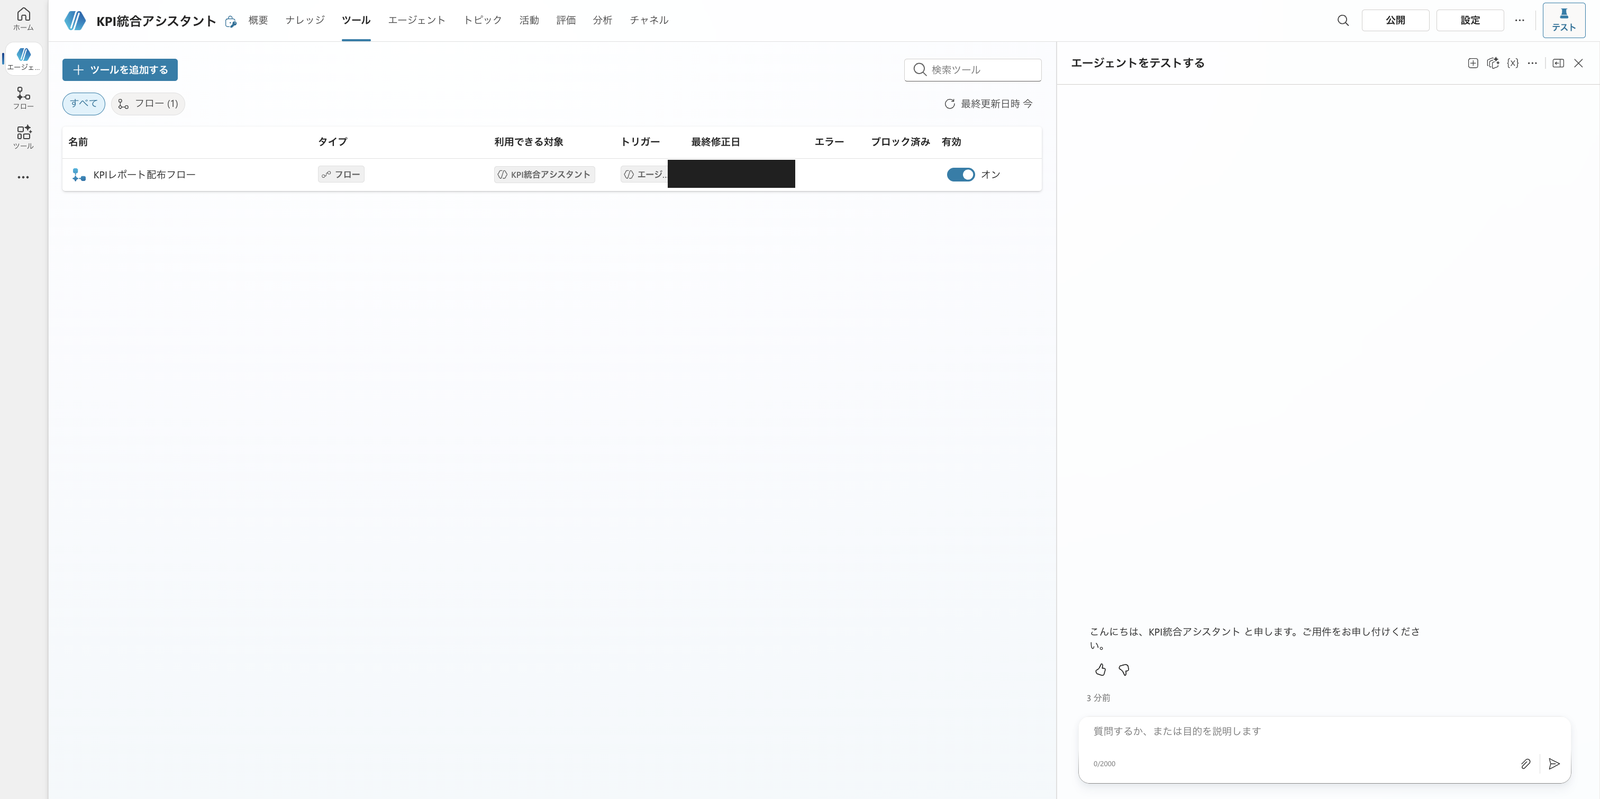
The distribution flow registered as a tool with a description in the parent (enabled = on)
9. Step 7: Run It
At this point, collection (SharePoint knowledge), documentation (Documentation Sub + Code Interpreter), and distribution (flow) are all in place.
Based on hands-on testing, the following order of steps was the clearest way to run things.
9.1 Get Collection, Comparison, and Insights from the Parent
First, send a request for comparison and insights to the parent's test chat.
Compare the Q3 FY2025 (fiscal year 2025, third quarter) KPIs for CloudNova, StreamForge, and Datapeak using the figures from the knowledge.
Provide a comparison table of the three companies, along with notable points for each company and insights from the three-way comparison. Do not use figures not found in the knowledge.
The parent searches the SharePoint knowledge raw data and returns a comparison table and insights for the three companies.
At this point, it used only figures present in the knowledge and did not fill in missing metrics with guesses (the "Allow ungrounded responses" setting turned off in Chapter 4 is working here).
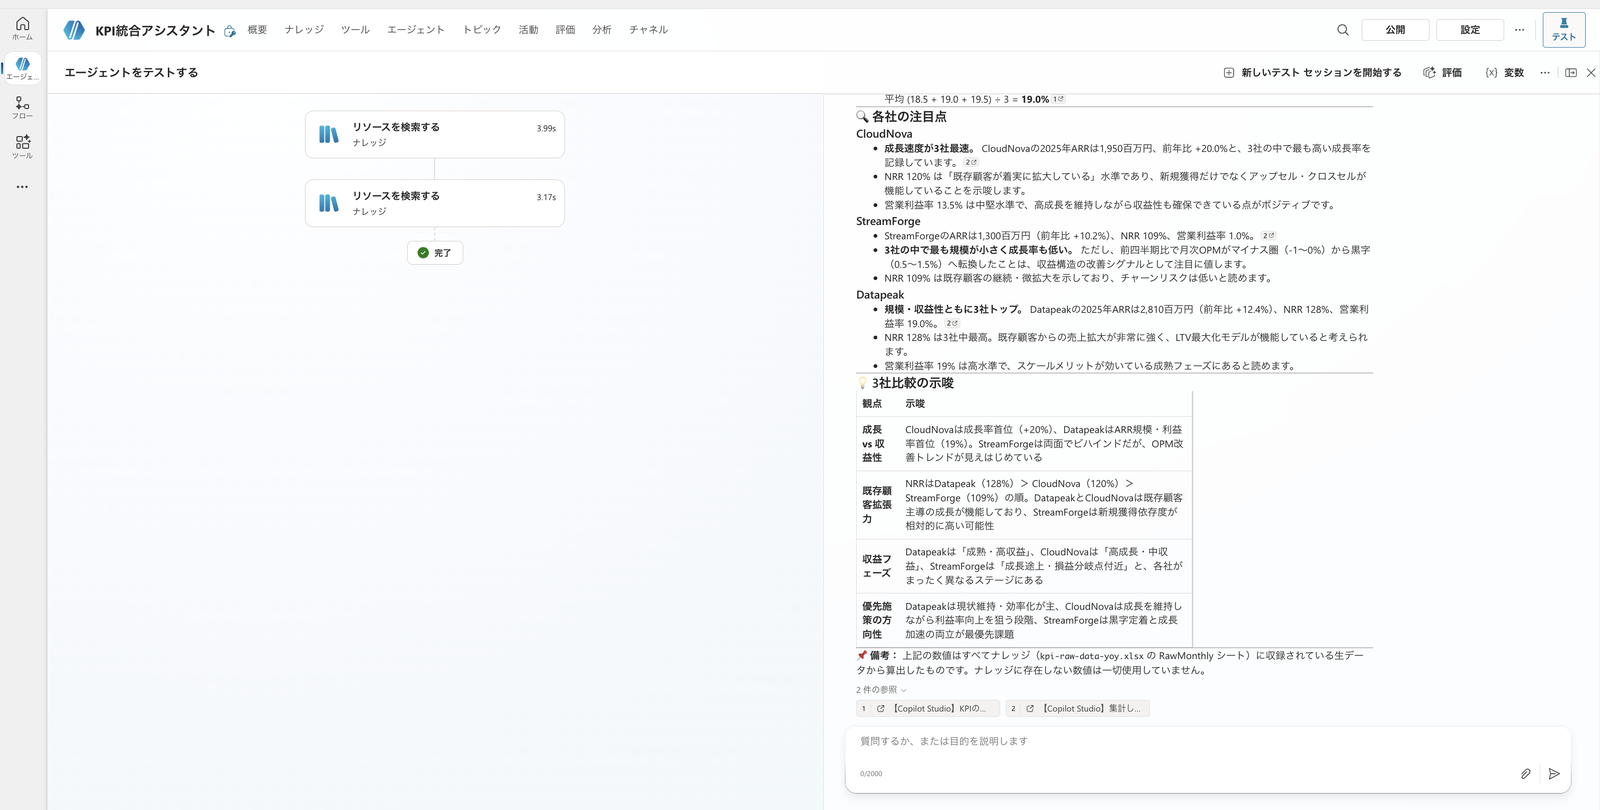
The parent compares the three companies using SharePoint knowledge figures and returns notable points and insights. Only raw data included in the knowledge is used in the response
9.2 Send a Single Request to Generate All Three Formats (Delegation to Documentation Sub)
Once the comparison table and insights are ready, follow up with a documentation request.
In the request, specify the target period (Q3 FY2025) and any labels you want in Japanese, such as the title, and ask for a download link at the end.
For Word, for example, the request looks like this:
Using the Q3 FY2025 (October–December 2025) data from the knowledge, please create a Word ARR comparison report for the three companies.
Set the title to "Fiscal Year 2025 Q3 ARR Comparison Report," and include a three-company ARR comparison table (with year-over-year), notable points for each company, and three-way comparison insights in Japanese.
Do not use figures not found in the knowledge.
When done, please provide a link I can download.
The parent delegates to the child agent "Documentation Sub," which runs Code Interpreter and returns the file along with a downloadable card (with a download button).
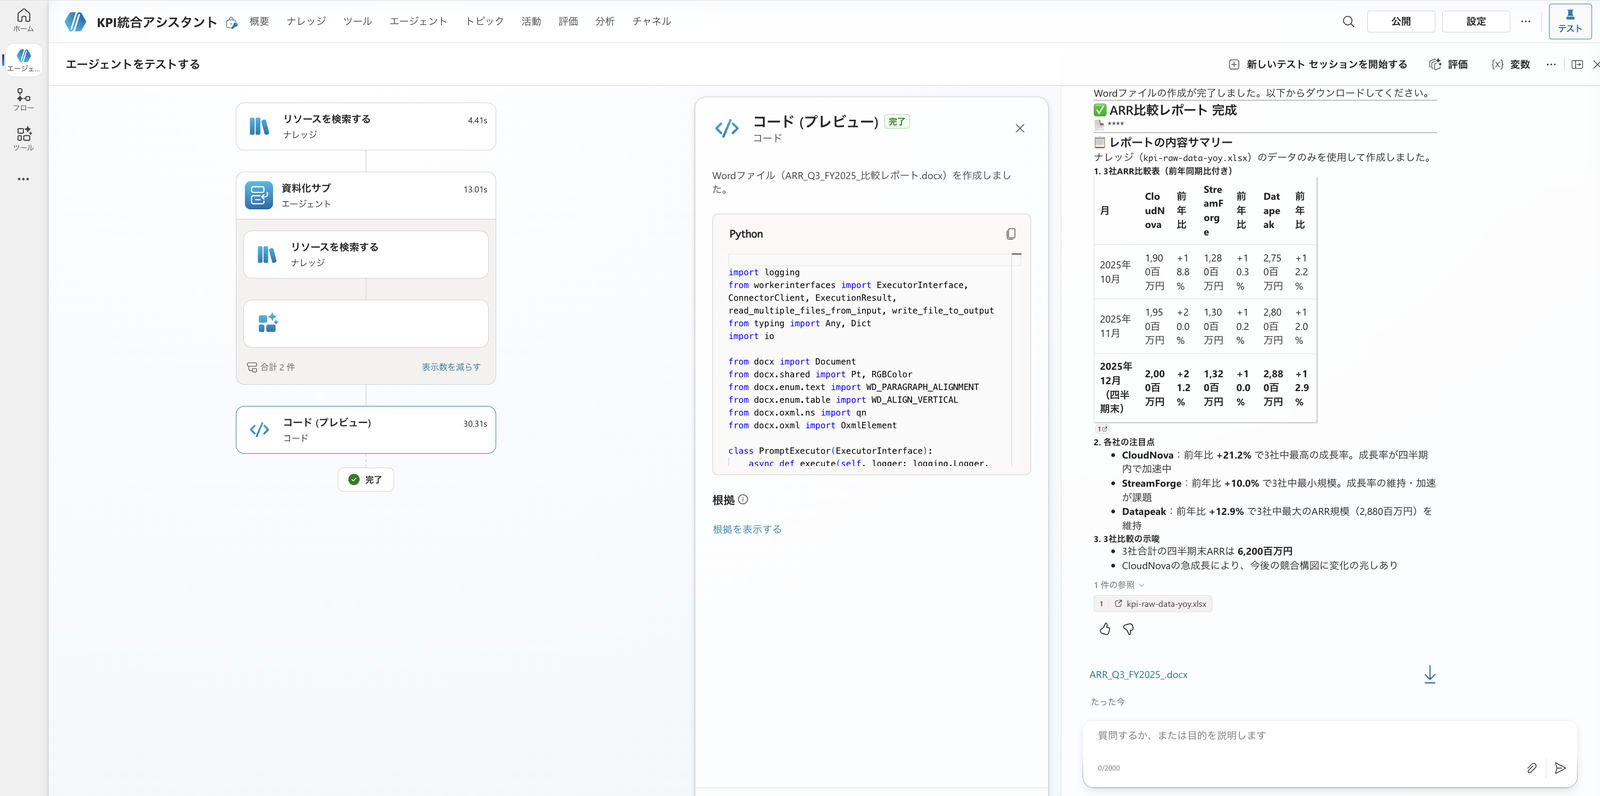
The parent delegates to "Documentation Sub," and a download card for the Q3 FY2025 Word (.docx) file is returned. The activity map shows the "Documentation Sub" node, confirming that delegation occurred
Follow the same approach for Excel and PowerPoint.
However, special attention is needed when creating Excel charts.
Using the Q3 FY2025 (October–December 2025) ARR data from the knowledge, please create an Excel file with openpyxl.
Include a bar chart comparing the ARR of the three companies as an editable chart, not an image.
Set the chart title to "Fiscal Year 2025 Q3 ARR Comparison (Million JPY)," the horizontal axis to company names, and the vertical axis to "ARR (Million JPY)."
Do not use figures not found in the knowledge.
When done, please provide a link I can download.
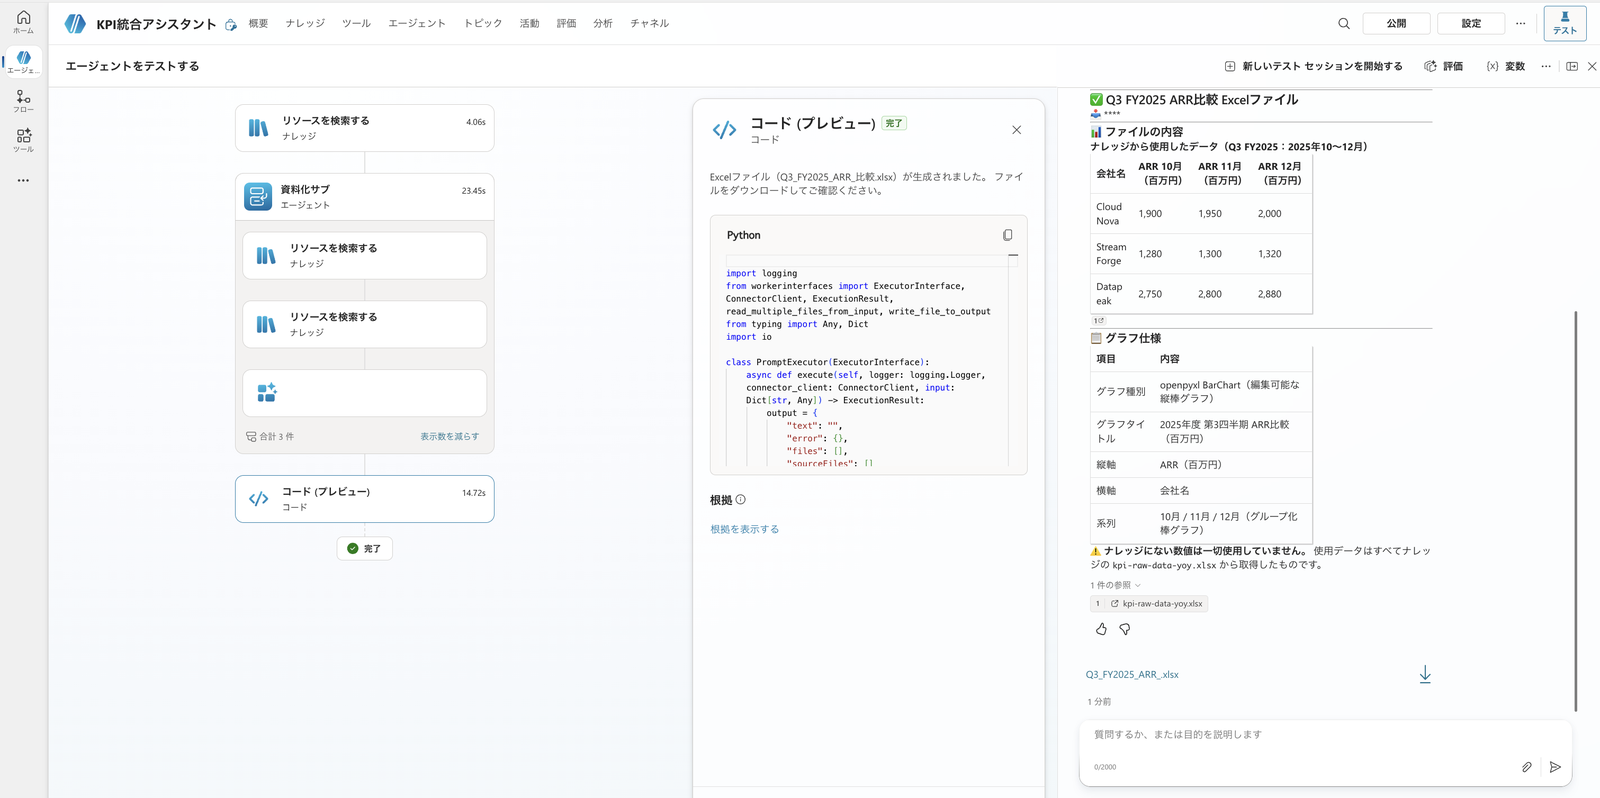
Excel also generated by "Documentation Sub." The specifications for the openpyxl native bar chart (Japanese title and axis labels) and the .xlsx download card are returned
Using the Q3 FY2025 (October–December 2025) ARR comparison data from the knowledge, please create a PowerPoint with python-pptx.
Use a slide structure of: cover, ARR bar chart, KPI table, and insights, with headings and labels in Japanese.
Make the bar chart an editable chart rather than an image, with title "Fiscal Year 2025 Q3 ARR Comparison (Million JPY)," horizontal axis for company names, and vertical axis for "ARR (Million JPY)."
Do not use figures not found in the knowledge.
When done, please provide a link I can download.
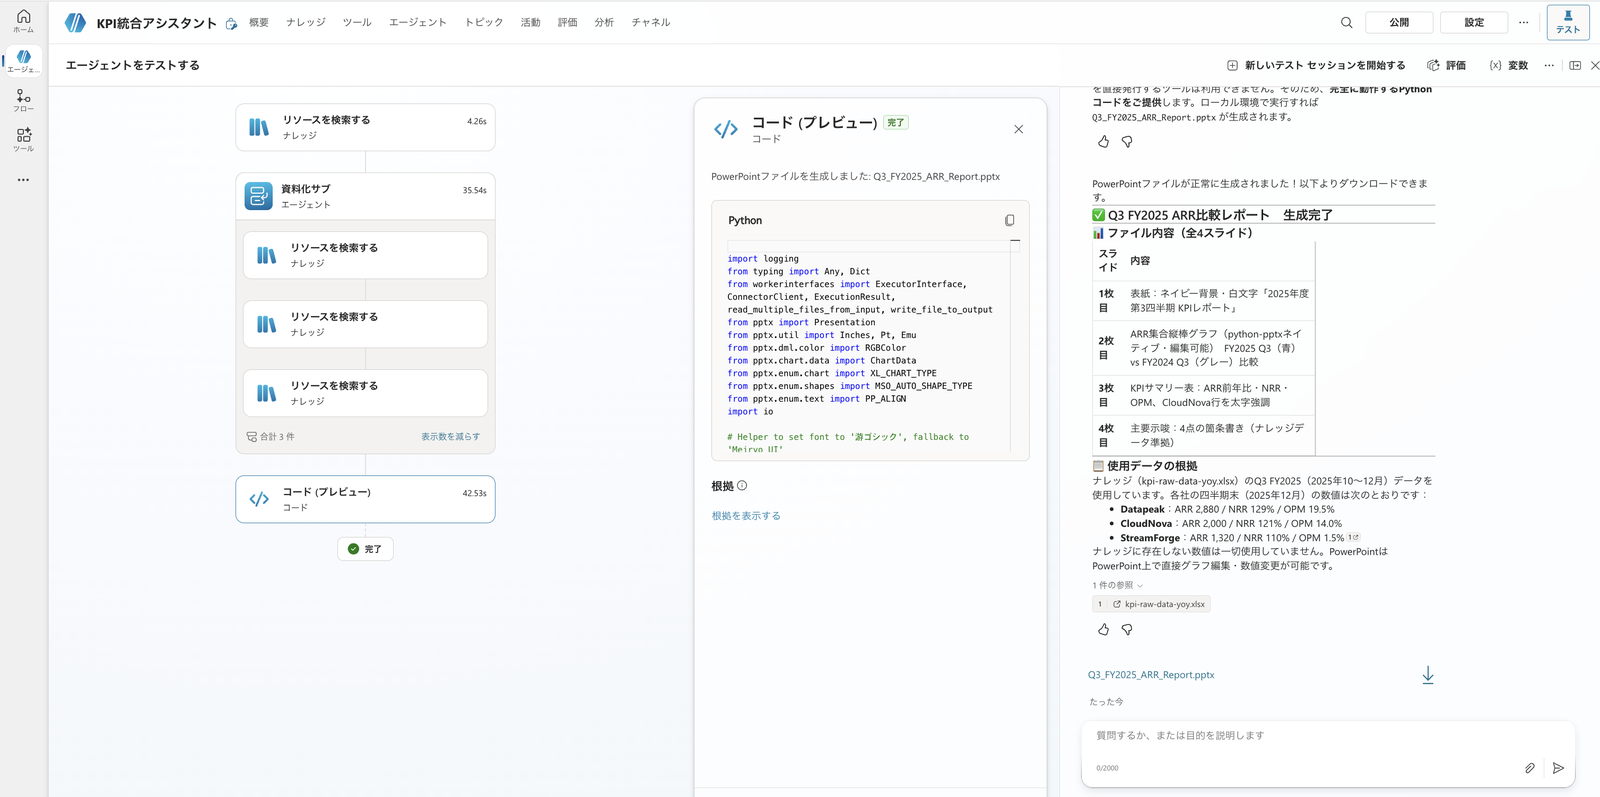
PowerPoint also generated by "Documentation Sub." A 4-slide structure (cover, ARR bar chart, KPI table, key insights) and the .pptx download card are returned
9.3 Verify the Contents of the Generated Files
Using the download links for all three formats, I opened the actual files and verified their contents.
The screenshots of the contents were taken by downloading the files and opening them locally.
The Word (.docx) file was a full report containing the title, ARR comparison table (with year-over-year), monthly ARR trends, notable points for each company, and three-way comparison insights.
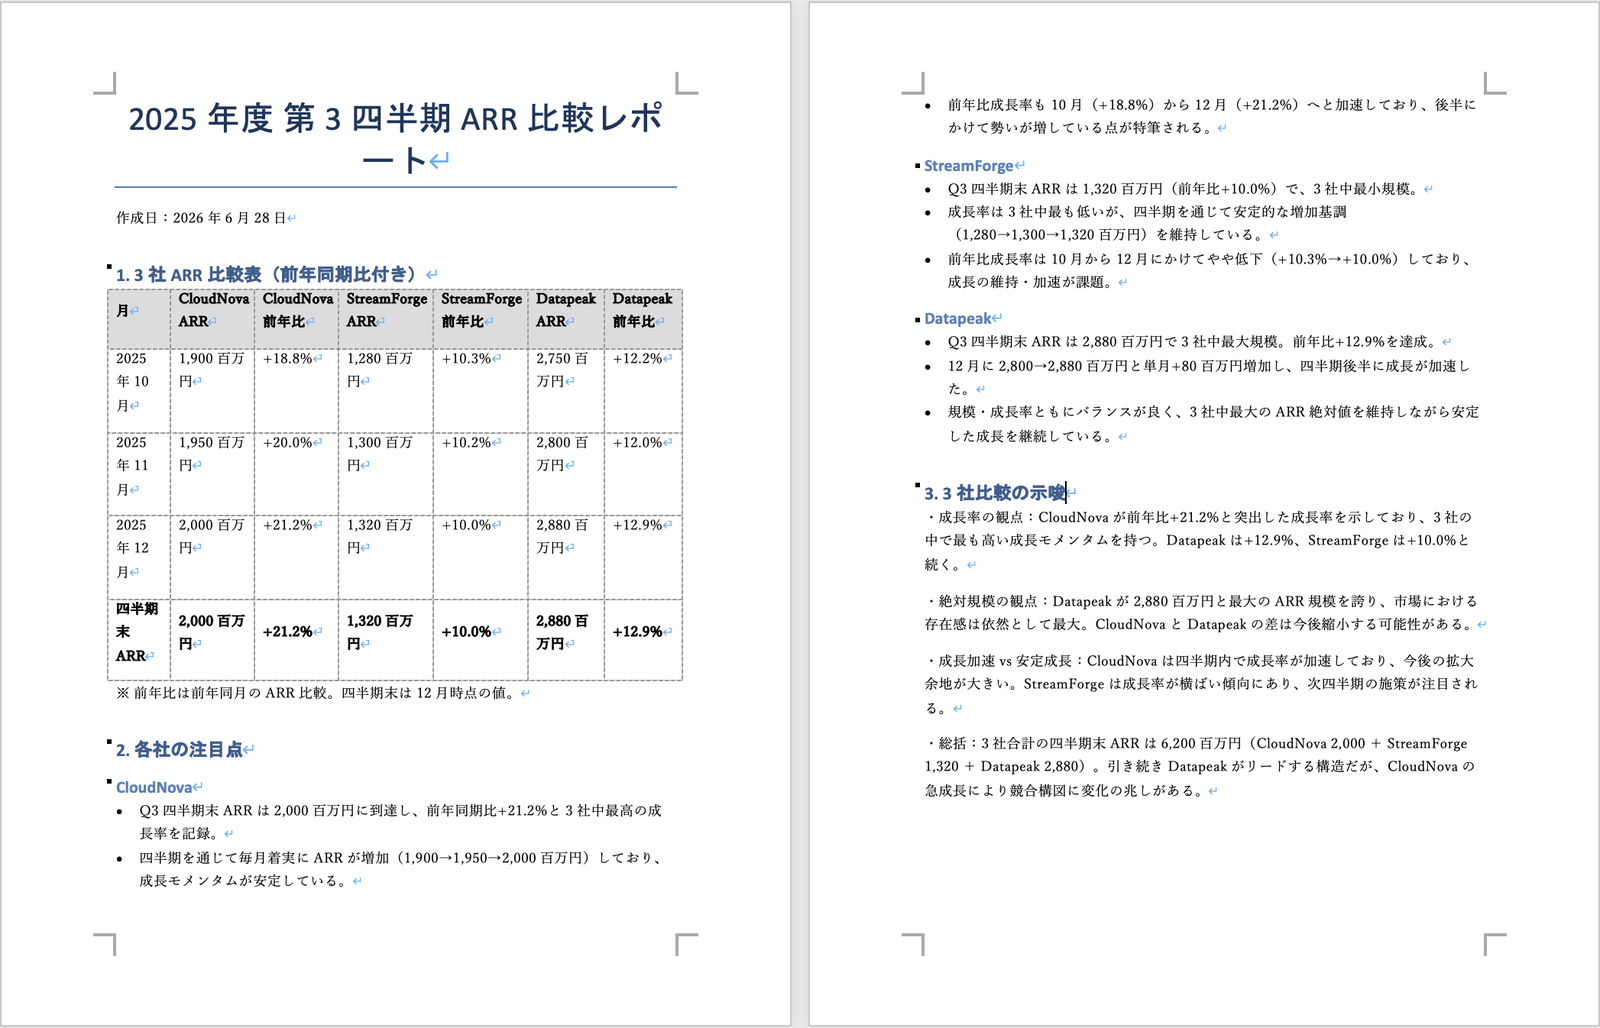
The generated Word report. Title, ARR comparison table (with year-over-year), monthly ARR trends, notable points, and insights are all present. The period is clearly stated as "Fiscal Year 2025 Q3 (Q3 FY2025)"
The Excel (.xlsx) file was created with openpyxl's native bar chart (BarChart), so clicking the chart allows editing directly in Excel.
Since it's not just an embedded image, there's no garbling when titles and axis labels are in Japanese, and formatting can be changed afterward.
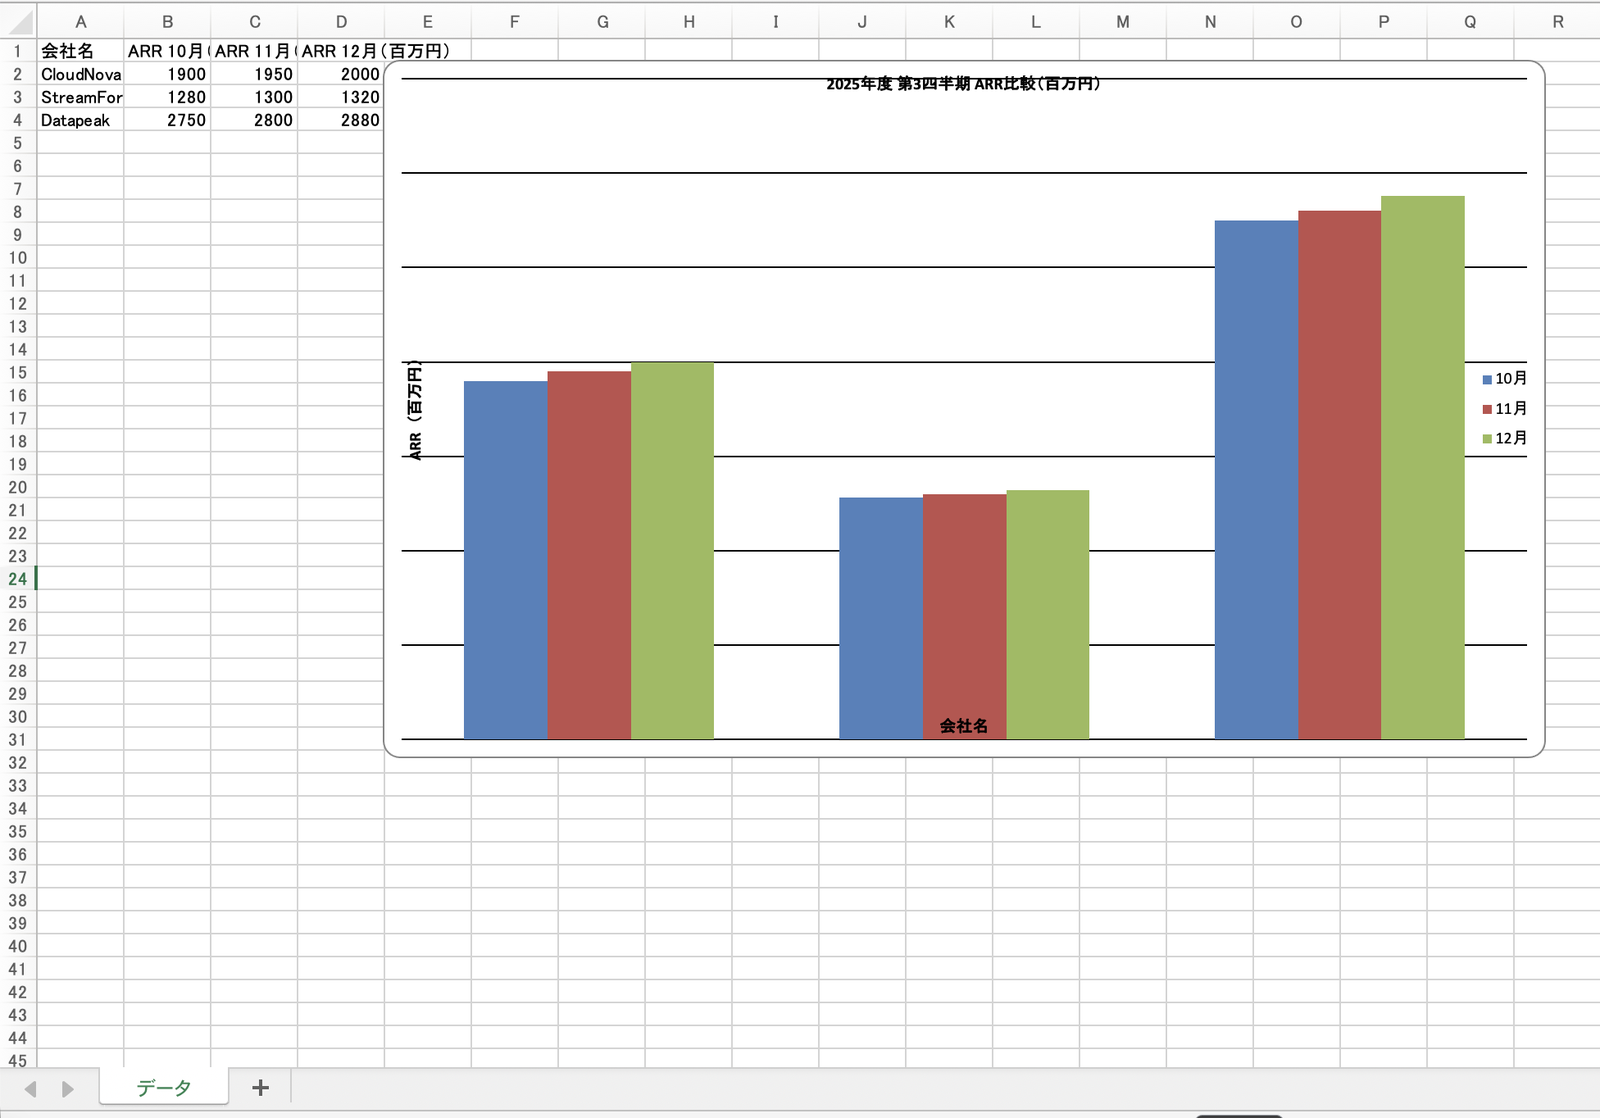
The generated Excel file. Monthly data in the "Data" sheet and a native bar chart "Fiscal Year 2025 Q3 ARR Comparison (Million JPY)." Axis labels (company names, ARR (Million JPY)) are in Japanese with no garbling
The PowerPoint (.pptx) was a 4-slide deck consisting of a cover, ARR bar chart, KPI table, and key insights.
The bar charts are python-pptx native charts, and headings and labels are in Japanese.
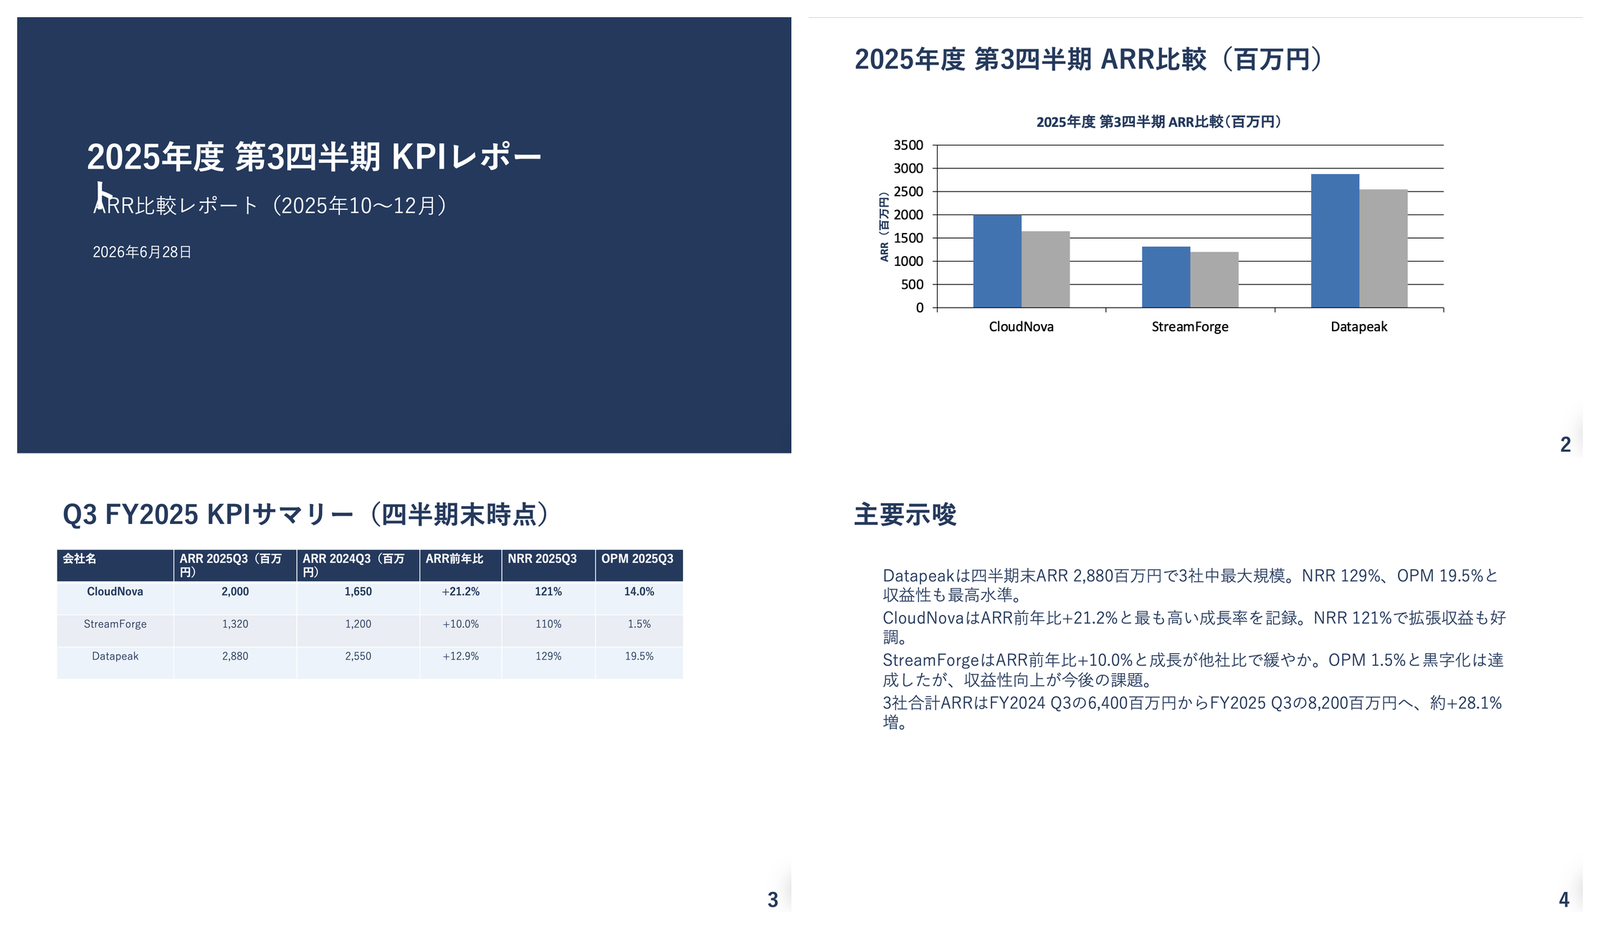
The generated PowerPoint (4 slides): cover / ARR bar chart (python-pptx native chart) / KPI table / key insights. Headings and labels are all in Japanese
All three formats were generated consistently from the same Q3 FY2025 data, and Japanese labels on charts were generated without garbling.
At this point, collection (SharePoint knowledge) → aggregation/documentation (Documentation Sub + Code Interpreter) were connected through a single agent request, and distribution was fixed as a flow.
Execution of the distribution flow (saving to OneDrive and issuing the org-internal sharing link) was verified in Part 11, and the OneDrive connector sign-in (authorization) is required on the first run. This article covers the step of fixing the flow as a tool in the parent.
10. Pain Points
Here is a summary of things that were easy to get tripped up on during hands-on testing.
- Vague requests cause results to vary across runs: When asking without specifying the target period or aggregation method, the interpretation of the period and figures can differ from file to file even with the same request. Clearly specifying the target period (e.g., Q3 FY2025) in the request, and adding the aggregation method (e.g., monthly average) if needed, improves consistency (same thinking as in Part 6, "Don't rely on LLMs for aggregation").
- Delegation is probabilistic and doesn't happen every time: Even with the same request, there were runs where delegation occurred, runs where the parent executed it itself, and runs where code was returned as text only. If it fails, try the request again.
- Code Interpreter file generation can fail depending on the format: Word generation was stable, but for Excel and PowerPoint with charts, I observed failures such as stopping with no output after displaying code,
SystemErroroccurring, or the file being returned only as a citation reference with no download link. If it fails, simplify the chart and retry, or try the request again. - openpyxl native charts are lighter than matplotlib image embedding for Excel: Trying to draw and embed matplotlib images tended to be heavy, causing
SystemErroror unresponsive stops. Instructing the system to create Excel-native (editable) charts usingopenpyxl.chart.BarChartwas lighter and more stable (9.2). - When no download link appears, ask "please give me a download link" and retry a few times: Even for the same generation, there were runs where a card with a download button appeared and runs where only a citation reference appeared with no link. Explicitly saying "please give me a downloadable link" and retrying a few times will produce the card.
- Do not put Code Interpreter into a flow: Responses can take minutes, which conflicts with the 100-second constraint of synchronous flows. Hold it as a chat capability of the child agent.
11. Summary
Throughout the series, I was able to integrate the entire KPI comparison report pipeline — "collection → aggregation → charts → insights → documentation → distribution" — into a single agent (parent "KPI Integration Assistant" + child "Documentation Sub" + distribution flow).
Everything from collection through documentation was connected with a single-sentence request, and distribution was fixed as a flow (execution of the distribution flow was verified in Part 11, and OneDrive connector sign-in is required on the first run).
Here is a summary of what was learned at each step, organized in a form useful for decision-making.
| Step | What It Can Do | Decision Points |
|---|---|---|
| Collection | Answer based on raw data from SharePoint knowledge | For Code Interpreter aggregation, place files in a SharePoint library rather than uploading as file knowledge |
| Aggregation | Aggregate with Code Interpreter | Explicitly specify the target period in the request and have it use knowledge figures |
| Charts | Excel native charts / Code Interpreter image generation | openpyxl native charts are lighter than embedding matplotlib images |
| Insights | Generate comparisons and observations with numerical backing | Pass pre-calculated figures and let the generative AI handle interpretation only |
| Documentation | Generate Word, Excel, and PPT with child agent + Code Interpreter | Delegation is probabilistic. Fix steps requiring consistent behavior as flows |
| Distribution | OneDrive save + org-internal download link | Fix deterministic steps as flows |
I found it genuinely practical to be able to delegate the entire KPI comparison workflow to an agent, mostly without code.
By explicitly specifying the target period (Q3 FY2025) in requests and restricting it to use only knowledge figures, all three formats — Word, Excel, and PowerPoint — were generated consistently from the same data.
Specifying "editable native charts, not images" for chart generation resulted in lighter generation than embedding matplotlib images, and axis labels and titles in Japanese were produced without garbling.
On the other hand, leaving the target period or aggregation method ambiguous and delegating to the LLM leaves room for results to vary across runs. A practical approach was to let the generative AI handle the parts like formatting and layout in documentation, while explicitly specifying the target period and figures to use in the request.
Verification used fictitious KPI data for three fictitious SaaS companies (CloudNova / StreamForge / Datapeak).
When operating with real data, the accuracy of the information placed in the knowledge source, the quality of the description text for each component, and the rigor of making figures deterministic will greatly influence the agent's precision.