![[Typescript] Debugging Rust on MCP Server [CodeLLDB]](https://images.ctfassets.net/ct0aopd36mqt/4AJd3M26yescaNaY21CYmQ/9730e95c53a7b3049c6da6d4c0b1dec9/mcp.png?w=3840&fm=webp)
[Typescript] Debugging Rust on MCP Server [CodeLLDB]
This page has been translated by machine translation. View original
Introduction
Model Context Protocol (MCP) has made it easy for Agents (like Claude code or codex) to access various resources and execute tools.
So let's try using a debugger too.
This article explains how to debug Rust programs using MCP.
By enabling Claude Code and others to debug Rust programs,
you can interactively control variable checking, step execution, and more.
This article will cover:
- How to debug Rust using CodeLLDB (LLDB)
- Basics of Debug Adapter Protocol (DAP)
- MCP server implementation patterns
- Working example of MCP Rust debugger implementation
Terminology
Model Context Protocol (MCP)
MCP is a standardized protocol for connecting LLMs with tools and data sources.
Claude Code uses an MCP server as follows:
┌─────────────┐
│  AI Agent   │  ← Claude, GPT-4, etc.
│  (Claude)   │
└──────┬──────┘
       │ MCP Protocol
       │
       ▼
┌─────────────┐
│ MCP Server  │  ← Rust debugger we're implementing
└─────────────┘
We register operations like setting breakpoints and step-over as tools,
and Claude Code can use these tools to execute processes.
Debug Adapter Protocol (DAP)
DAP is a communication protocol
between editors and debuggers. It's used in VS Code and similar editors.
The MCP server connects to the debugger using DAP.
┌──────────────┐
│ MCP Server   │
└──────┬───────┘
       │ DAP Protocol
       │
       ▼
┌──────────────┐
│   CodeLLDB   │  ← LLDB's DAP adapter
└──────┬───────┘
       │ LLDB Commands
       ▼
┌──────────────┐
│     LLDB     │  ← Actual debugger engine
└──────┬───────┘
       │ Process Control
       ▼
┌──────────────┐
│ Rust Program │
└──────────────┘
LLDB (Low Level Debugger)
LLDB is a debugger developed as part of the LLVM project.
Overview:
- Development: Primarily led by Apple as part of the LLVM project
- Supported languages: C, C++, Objective-C, Swift, Rust, etc.
- Platforms: macOS, Linux, Windows, and others
It has features such as setting breakpoints, step execution,
and expression evaluation.
In a Rust-capable environment, you can use rust-lldb, a Rust wrapper for lldb.
It can also analyze ownership-related issues.
LLDB is used via CLI like this:
% lldb ./target/debug/hoge-program

(lldb) target create "・・・・・・・"
Current executable set to '・・・・・' (arm64).

#Set breakpoint
(lldb) breakpoint set --file main.rs --line 10
(lldb) run
#Display variables
(lldb) frame variable
#Step execution
(lldb) step
CodeLLDB
CodeLLDB is an LLDB frontend for VS Code,
which wraps the LLDB debugger with DAP.
It's installed as a VS Code extension, but the binary itself doesn't depend on VS Code.
It supports Rust, C, C++, Swift, and others.
It acts as an adapter that makes LLDB available via DAP,
controllable programmatically through JSON-RPC.
You can install it in VS Code with the following command:
% code --install-extension vadimcn.vscode-lldb
After installation, on Mac, the executable is located at:
~/Library/Application\ Support/Code/User/globalStorage/vadimcn.vscode-lldb/lldb/extension/adapter/codelldb
Note that codelldb can also be installed standalone, but this is less common.
※Available for download from GitHub
┌──────────────┐
│ DAP Client   │ ← VS Code or custom MCP server
└──────┬───────┘
       │ DAP Protocol
┌──────▼──────┐
│  CodeLLDB   │ ← DAP adapter (server)
└──────┬──────┘
       │
┌──────▼──────┐
│    LLDB     │ ← Debugger
└─────────────┘
In this article, we'll launch CodeLLDB as a DAP server,
and the MCP server will access it as a DAP client.
Overall Architecture
The complete picture looks like this:
┌──────────────────────────────────────────────────────┐
│                   AI Agent (Claude Code)             │
└───────────────────┬──────────────────────────────────┘
                    │ MCP (stdin/stdout)
                    │
┌───────────────────▼──────────────────────────────────┐
│              Rust Debugging MCP Server               │
│  ┌───────────────────────────────────────────────┐   │
│  │  tools:                                       │   │
│  │  - debug_launch()                             │   │
│  │  - debug_step_over()                          │   │
│  │  - debug_get_variables()                      │   │
│  │  - debug_continue()                           │   │
│  └──────────────────┬────────────────────────────┘   │
│                     │                                │
│  ┌──────────────────▼───────────────────────────┐    │
│  │        RustDebugger Class                    │    │
│  │  - DAP messaging                             │    │
│  │  - Event handling                            │    │
│  │  - Stack/variable management                 │    │
│  └──────────────────┬───────────────────────────┘    │
└────────────────────┬─────────────────────────────────┘
                     │ DAP (stdin/stdout)
                     │
┌────────────────────▼─────────────────────────────────┐
│                    CodeLLDB                          │
│  ┌────────────────────────────────────────────┐      │
│  │  DAP Adapter                                │     │
│  │  - initialize, launch, continue             │     │
│  │  - breakpoints, stackTrace, variables       │     │
│  └────────────────┬───────────────────────────┘      │
└────────────────────┬─────────────────────────────────┘
                     │ LLDB Commands
                     │
┌────────────────────▼─────────────────────────────────┐
│                 LLDB (Debugger Engine)               │
│  - Breakpoint management                             │
│  - Process control (step, continue)                  │
│  - Memory/register manipulation                      │
│  - DWARF debug info analysis                         │
└────────────────────┬─────────────────────────────────┘
                     │ Process Control (ptrace/etc.)
                     │
┌────────────────────▼──────────────────────────────────┐
│              Rust Binary (Debug Build)                │
└───────────────────────────────────────────────────────┘
Environment
- MacBook Pro (14-inch, M3, 2023)
- OS : MacOS 15.7
- Node : v24.9.0
- LLDB : lldb-1703.0.31.2
- Claude Code : 2.0.19
- VSCode : 1.105.1 (Universal)
Setup
Now, let's prepare to implement the Rust debug MCP server.
First, install CodeLLDB.
As mentioned earlier, install it as a VSCode extension:
% code --install-extension vadimcn.vscode-lldb
Confirm that Rust and Node environments are available:
% rustc --version  # Rust 1.70+

% node --version  # Node.js 20+
Project Setup
Clone the sample implementation repository from Github:
% git clone https://github.com/nakamura-shuta/mcp-rust-debugger-example
Execute various builds:
% cd mcp-rust-debugger-example

# Install dependencies
npm install

# Build TypeScript
npm run build

# Build sample Rust program (debug mode)
cd example
cargo build
Implements MCP
Let's look at the MCP Rust debugger code.
DAP Messaging Implementation
Here's the sending side process.
DAP uses JSON with Content-Length header.
/** src/rust-debugger.ts */
private async sendRequest(command: string, args: unknown): Promise<unknown> {
  const seq = this.requestSeq++;
  const message = {
    type: 'request',
    seq,
    command,
    arguments: args
  };

  return new Promise((resolve, reject) => {
    this.pendingRequests.set(seq, { resolve, reject });

    const content = JSON.stringify(message);
    const header = `Content-Length: ${Buffer.byteLength(content)}\r\n\r\n`;

    // Send to CodeLLDB's stdin
    this.codelldbProcess?.stdin?.write(header + content);

    setTimeout(() => {
      if (this.pendingRequests.has(seq)) {
        this.pendingRequests.delete(seq);
        reject(new Error(`Request ${command} timed out`));
      }
    }, 30000);
  });
}
For the receiving side, here's the implementation.
parseMessages parses the received DAP messages.
/** src/rust-debugger.ts */
private parseMessages(): void {
  while (true) {
    const headerEnd = this.messageBuffer.indexOf('\r\n\r\n');
    if (headerEnd === -1) break;

    const header = this.messageBuffer.slice(0, headerEnd);
    const match = /Content-Length: (\d+)/.exec(header);
    if (!match) break;

    const contentLength = parseInt(match[1], 10);
    const messageStart = headerEnd + 4;
    const messageEnd = messageStart + contentLength;

    if (this.messageBuffer.length < messageEnd) break;

    const content = this.messageBuffer.slice(messageStart, messageEnd);
    this.messageBuffer = this.messageBuffer.slice(messageEnd);

    const message = JSON.parse(content);
    this.handleMessage(message);
  }
}
DAP messages arrive as a stream, so multiple messages may arrive in a single event,
or a single message may be split across multiple events.
This processing determines message boundaries from the received data.
Starting Debugging
When starting to debug a Rust program,
requests need to be sent in a specific order.
/** src/rust-debugger.ts */
async launch(config: LaunchConfig): Promise<ToolResponse> {
  // 1. Launch CodeLLDB process
  this.codelldbProcess = spawn(codelldbPath, []);

  // 2. initialize request
  await this.sendRequest('initialize', {
    clientID: 'mcp-rust-debugger',
    adapterID: 'lldb',
    pathFormat: 'path'
  });

  // 3. Wait for initialized event
  await new Promise<void>(resolve => {
    this.once('initialized', resolve);
  });

  // 4. launch request (program start)
  this.sendRequest('launch', {
    program: config.program,
    args: config.args ?? [],
    stopOnEntry: true  // Stop at first line
  });

  // 5. Wait for stopped event to get threadId
  await new Promise<void>(resolve => {
    const onStopped = (body: DAP.StoppedEvent['body']) => {
      this.threadId = body.threadId;  // ← Save threadId
      this.off('stopped', onStopped);
      resolve();
    };
    this.on('stopped', onStopped);
  });

  // 6. configurationDone
  await this.sendRequest('configurationDone', {});

  return { success: true };
}
With stopOnEntry: true, the program will automatically stop at the start.
Then we save the threadId (needed for step execution).
Getting Variables
To get variables, we retrieve them in the order: stack trace → scope → variables.
/** src/rust-debugger.ts */
async getVariables(): Promise<ToolResponse<{ variables: Variable[] }>> {
  // 1. Get stack trace
  const stackTraceResponse = await this.sendRequest('stackTrace', {
    threadId: this.threadId,
    startFrame: 0,
    levels: 1  // Only top frame
  }) as DAP.StackTraceResponse;

  const frames = stackTraceResponse.body.stackFrames ?? [];
  if (frames.length === 0) {
    return { success: true, data: { variables: [] } };
  }

  this.frameId = frames[0].id;

  // 2. Get scopes
  const scopesResponse = await this.sendRequest('scopes', {
    frameId: this.frameId
  }) as DAP.ScopesResponse;

  const scopes = scopesResponse.body.scopes ?? [];
  const allVariables: Variable[] = [];

  // 3. Get variables for each scope
  for (const scope of scopes) {
    if (scope.variablesReference) {
      const vars = await this.getVariablesFromReference(scope.variablesReference);
      allVariables.push(...vars);
    }
  }

  return { success: true, data: { variables: allVariables } };
}
The structure is hierarchical:
stackTrace (specify threadId)
  └─> stackFrames[0]
       └─> scopes (specify frameId)
            ├─> Local Variables (variablesReference)
            │    └─> variables
            └─> Arguments (variablesReference)
                 └─> variables
Setting Breakpoints
We've also implemented setting breakpoints at specified file and line number.
We use the setBreakpoints command to set breakpoints in CodeLLDB,
and extract necessary information from the DAP response.
/** src/rust-debugger.ts */
async setBreakpoint(config: SetBreakpointConfig): Promise<ToolResponse<{ breakpoints: BreakpointInfo[] }>> {
  try {
    const response = await this.sendRequest('setBreakpoints', {
      source: { path: config.file },
      breakpoints: [{ line: config.line }]
    }) as DebugProtocol.SetBreakpointsResponse;

    const breakpoints: BreakpointInfo[] = (response.body.breakpoints ?? []).map((bp, index) => ({
      id: bp.id ?? index,
      file: config.file,
      line: bp.line ?? config.line,
      verified: bp.verified ?? false  // Check if breakpoint is valid
    }));

    return { success: true, data: { breakpoints } };
  } catch (error) {
    return { success: false, error: error instanceof Error ? error.message : String(error) };
  }
}
Continue Execution and Breakpoint Hit
To run until the next breakpoint, we use continue.
This sends the DAP continue command to resume execution in the specified thread.
When the continue request is sent, the program starts running,
and then a stopped event is received when the program stops at a breakpoint.
The process flow looks like this:
[stopped at entry]
  ↓
continue() called
  ↓
continue request sent
  ↓
Program running...
  ↓
Breakpoint hit
  ↓
stopped event received
  ↓
return from continue()
  ↓
[stopped at breakpoint] ← Variables can be retrieved
After executing continue, the stopped event is emitted when the program stops at a breakpoint.
By handling this event, we can retrieve variables at the stop location.
If not stopped at a breakpoint, operations like getting variables will fail.
/** src/rust-debugger.ts */
async continue(): Promise<ToolResponse> {
  if (!this.threadId) {
    return { success: false, error: 'No thread ID' };
  }

  try {
    await this.sendRequest('continue', { threadId: this.threadId });

    // Wait for the next stopped event
    await new Promise<void>((resolve) => {
      this.once('stopped', () => resolve());
    });

    return { success: true };
  } catch (error) {
    return { success: false, error: error instanceof Error ? error.message : String(error) };
  }
}
Step Execution
Step-over executes the current line and moves to the next line.
We use the DAP next command to perform the step-over.
Like continue, it follows the "send execution command → wait for stopped event" pattern,
ensuring that we can safely move to the next operation after stopping.
Here's an execution flow example:
10: let x = 10;        ← Currently here
11: let y = 20;
12: let sum = x + y;

stepOver() called
  ↓
next request sent
  ↓
Execute line 10
  ↓
stopped event received
  ↓
11: let y = 20;        ← Stopped at next line
/** src/rust-debugger.ts */
async stepOver(): Promise<ToolResponse> {
  await this.sendRequest('next', { threadId: this.threadId });

  // Wait for the next stopped event
  await new Promise<void>(resolve => {
    this.once('stopped', () => resolve());
  });

  return { success: true };
}
After sending the next request, we always wait for the stopped event,
ensuring that we stop at the next line.
MCP Tool Registration
src/index.ts is the entry point for the MCP server.
It registers debug tools that the agent can call and starts the MCP server.
Tool registration looks like this, registering various debugging tools:
server.registerTool(
  'debug_launch',           // Tool name
  {
    title: '...',           // Display name
    description: '...',     // Description
    inputSchema: {...}      // Argument schema
  },
  async (rawArgs) => {      // Execution handler
    // 1. Argument validation
    const args = launchSchema.parse(rawArgs);

    // 2. Call RustDebugger method
    const result = await rustDebugger.xxxxxx(args);

    // 3. MCP format response
    return {
      content: [{ type: 'text', text: '...' }]
    };
  }
);
Try it out
Now let's actually call the MCP debug tools from MCP Inspector
and debug a Rust program.
Build Sample Program
First, build the sample Rust project:
% cd /path/your/mcp-rust-debugger-example/example
% cargo build
The generated binary will be at example/target/debug/rust-debug-sample.
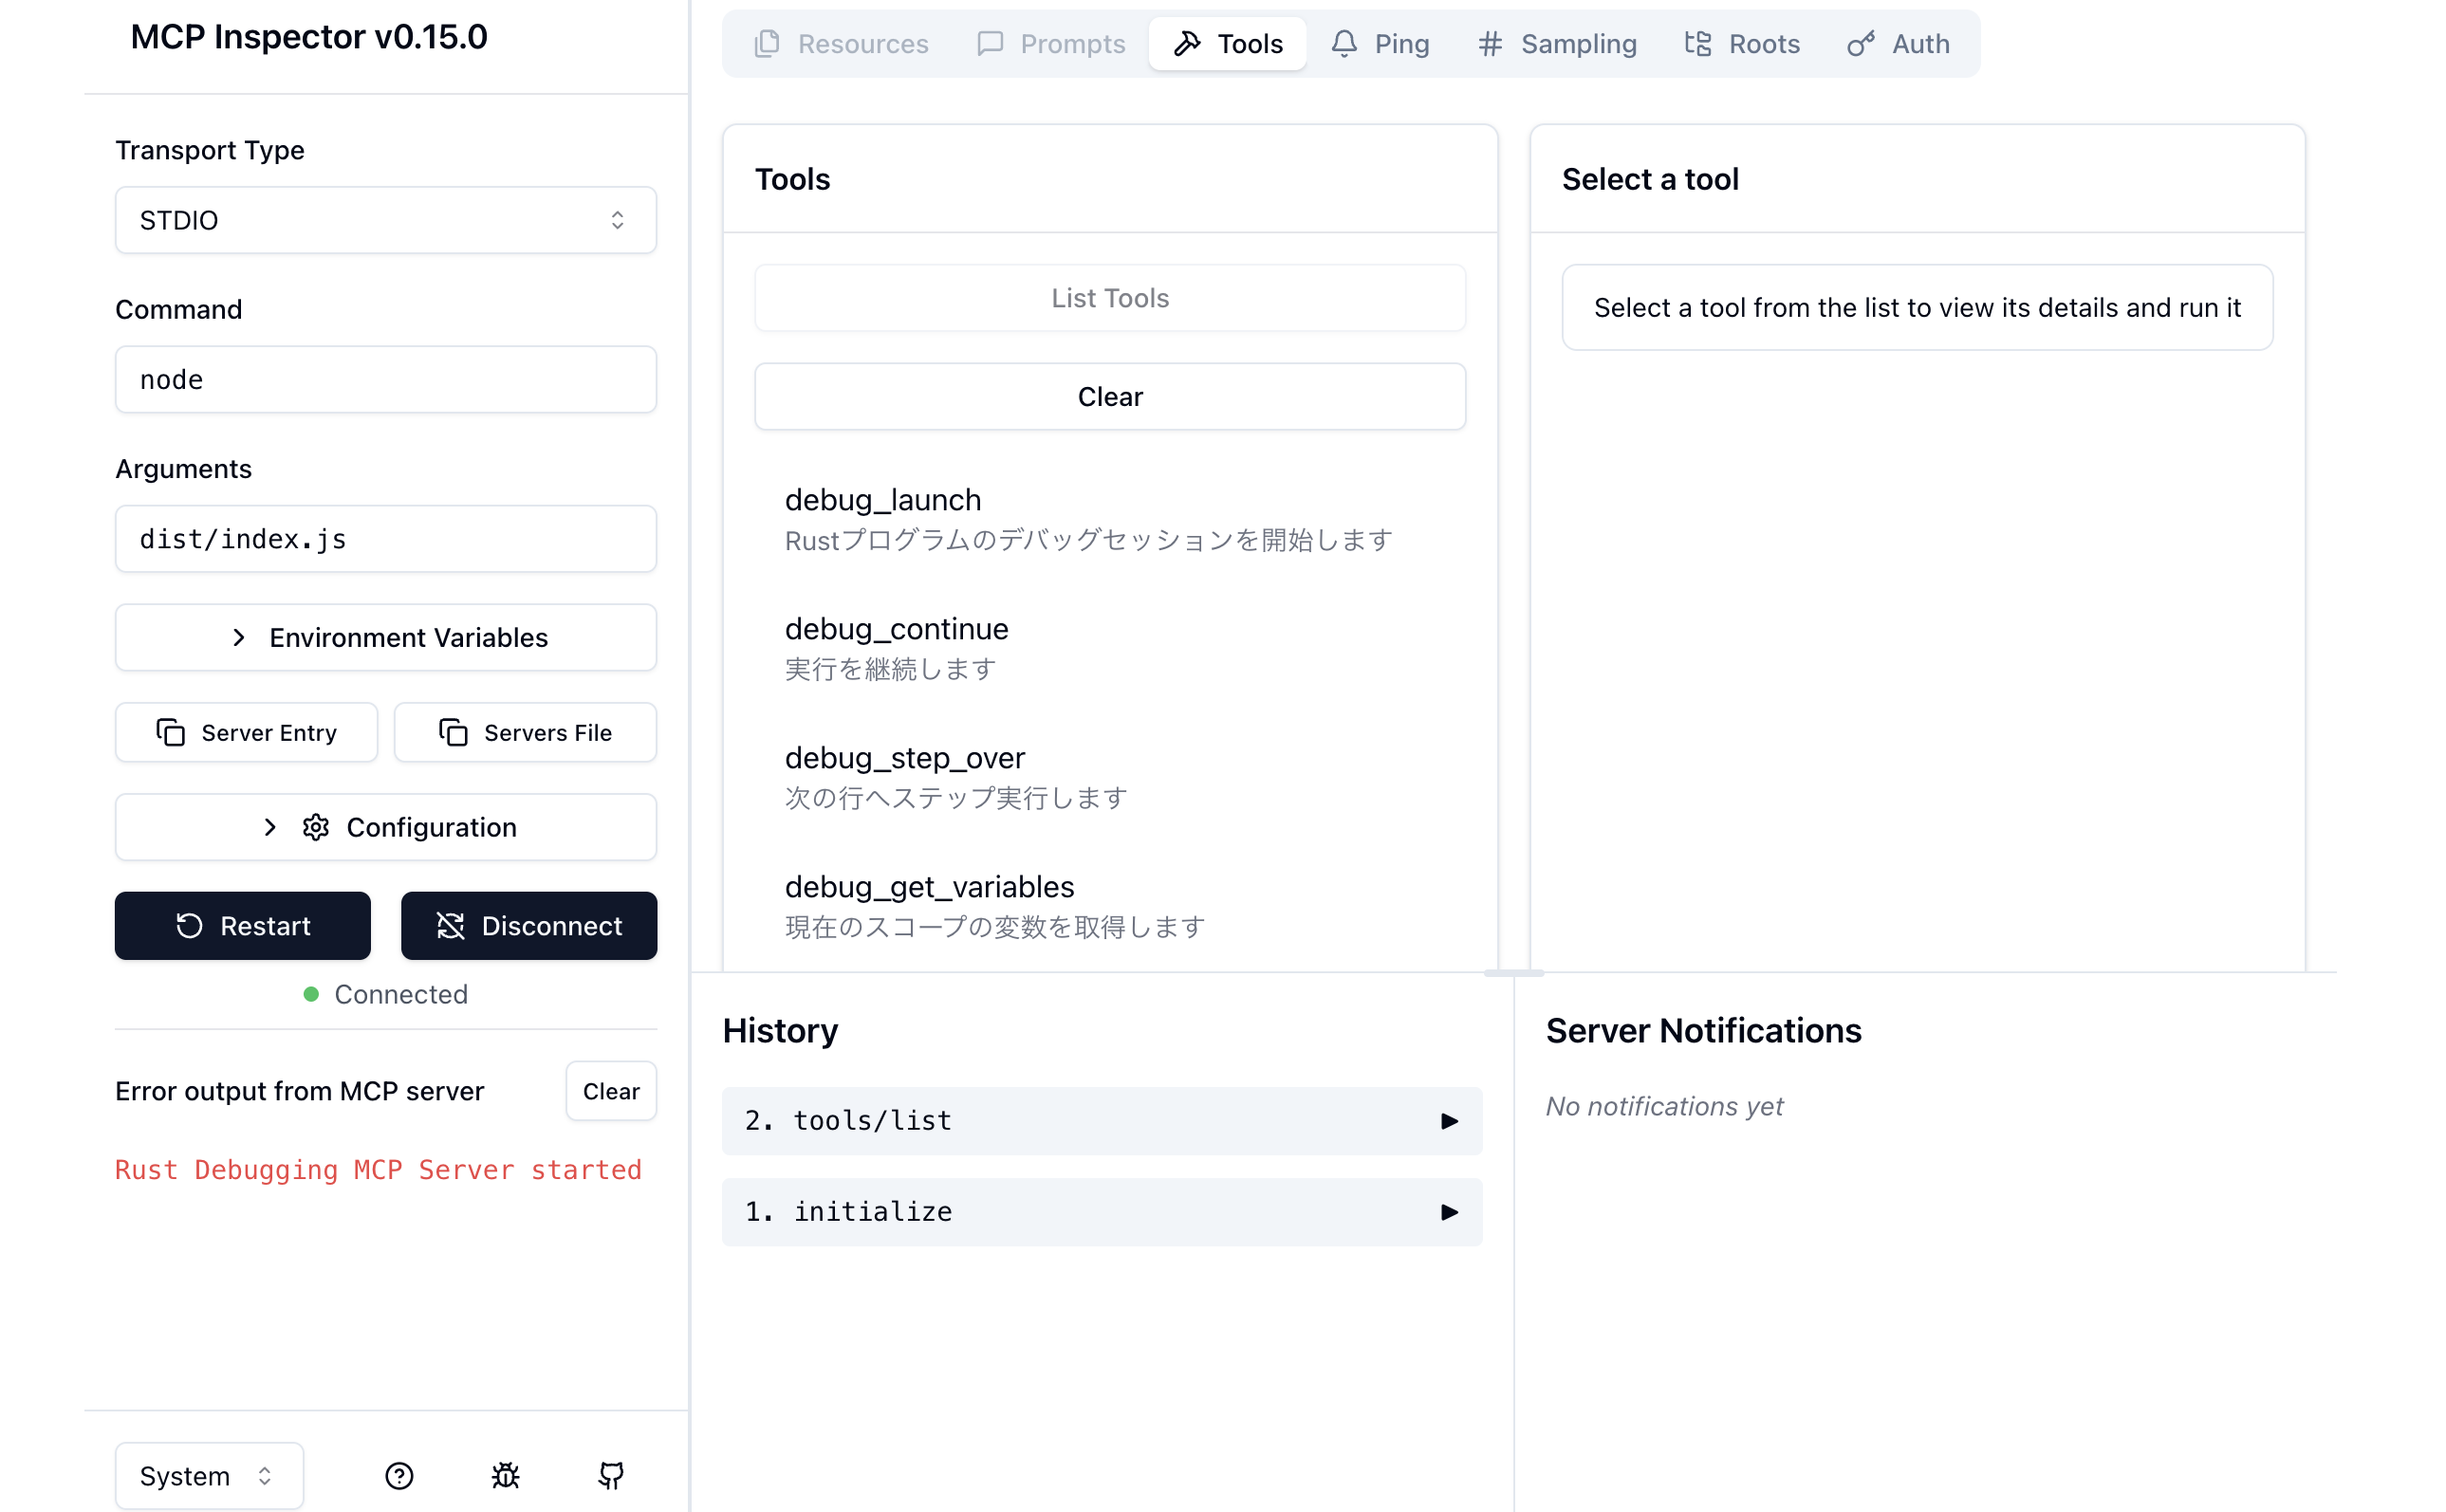
Test with MCP Inspector
MCP Inspector is a tool for interactively testing MCP servers in the browser.
Let's use it to test our implementation.
# Launch MCP Inspector
npx @modelcontextprotocol/inspector node dist/index.js
When executed, a URL will be displayed in the console. Access it from your browser.
Execute Debug Flow
Let's actually run it.
Click the connect button on the left side of the screen, then click the List tools button.
① Start Debug Session
Select debug_launch and enter the following:
{
  "program": "/path/your/example/target/debug/rust-debug-sample",
  "cwd": "/absolute/path/to/example"
}
If "Debug session started" appears in the Tool Result, that's good.
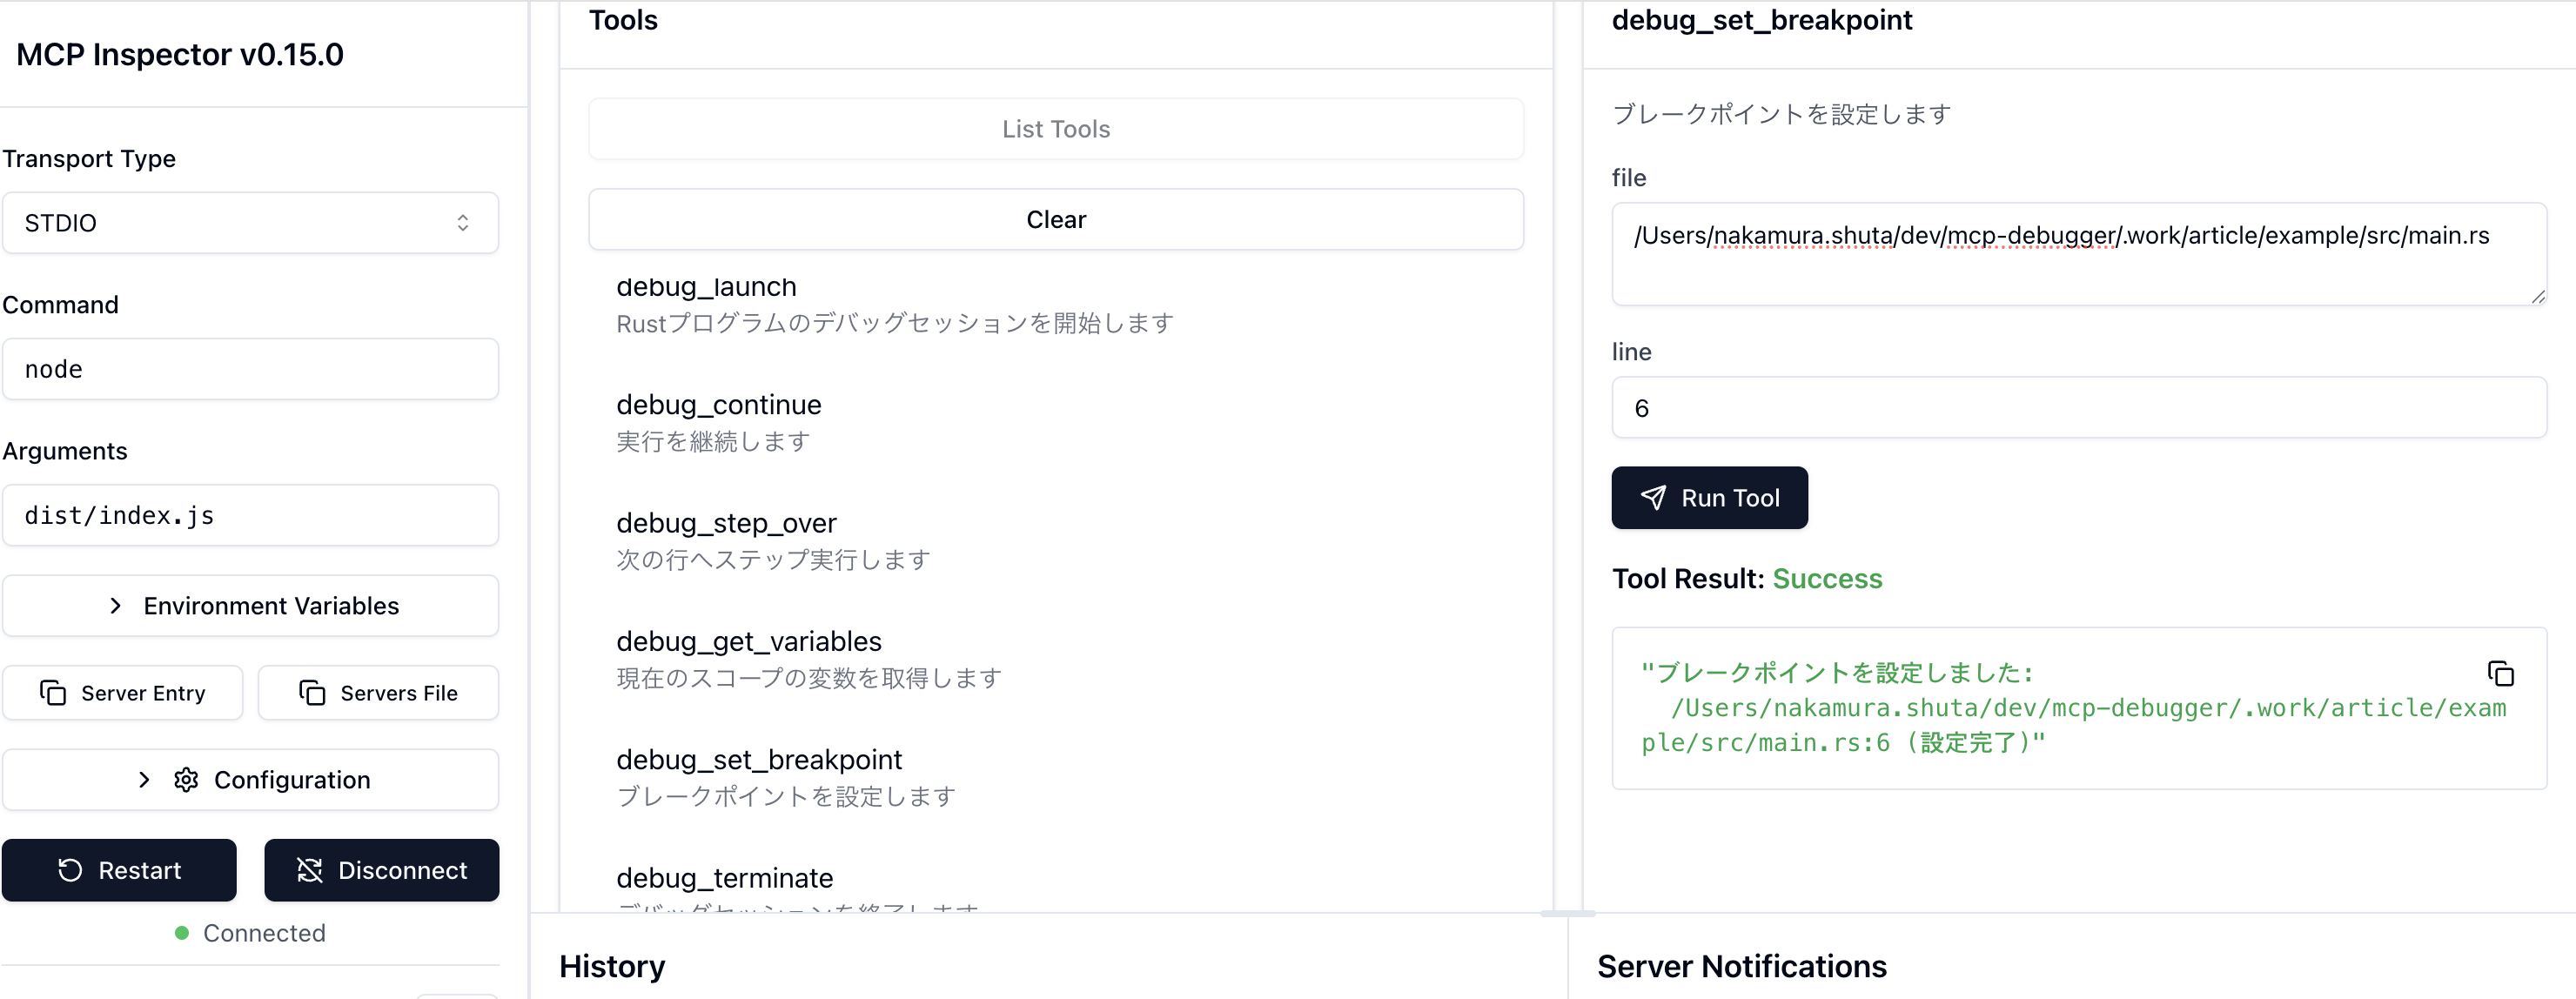
② Set Breakpoint
Run the debug_set_breakpoint tool:
{
  "file": "/absolute/path/to/example/src/main.rs",
  "line": 8
}
Result:
Breakpoint set:
  /path/to/example/src/main.rs:8 (verified)
This sets a breakpoint at line 8 in the main function (variable calculation part).
break
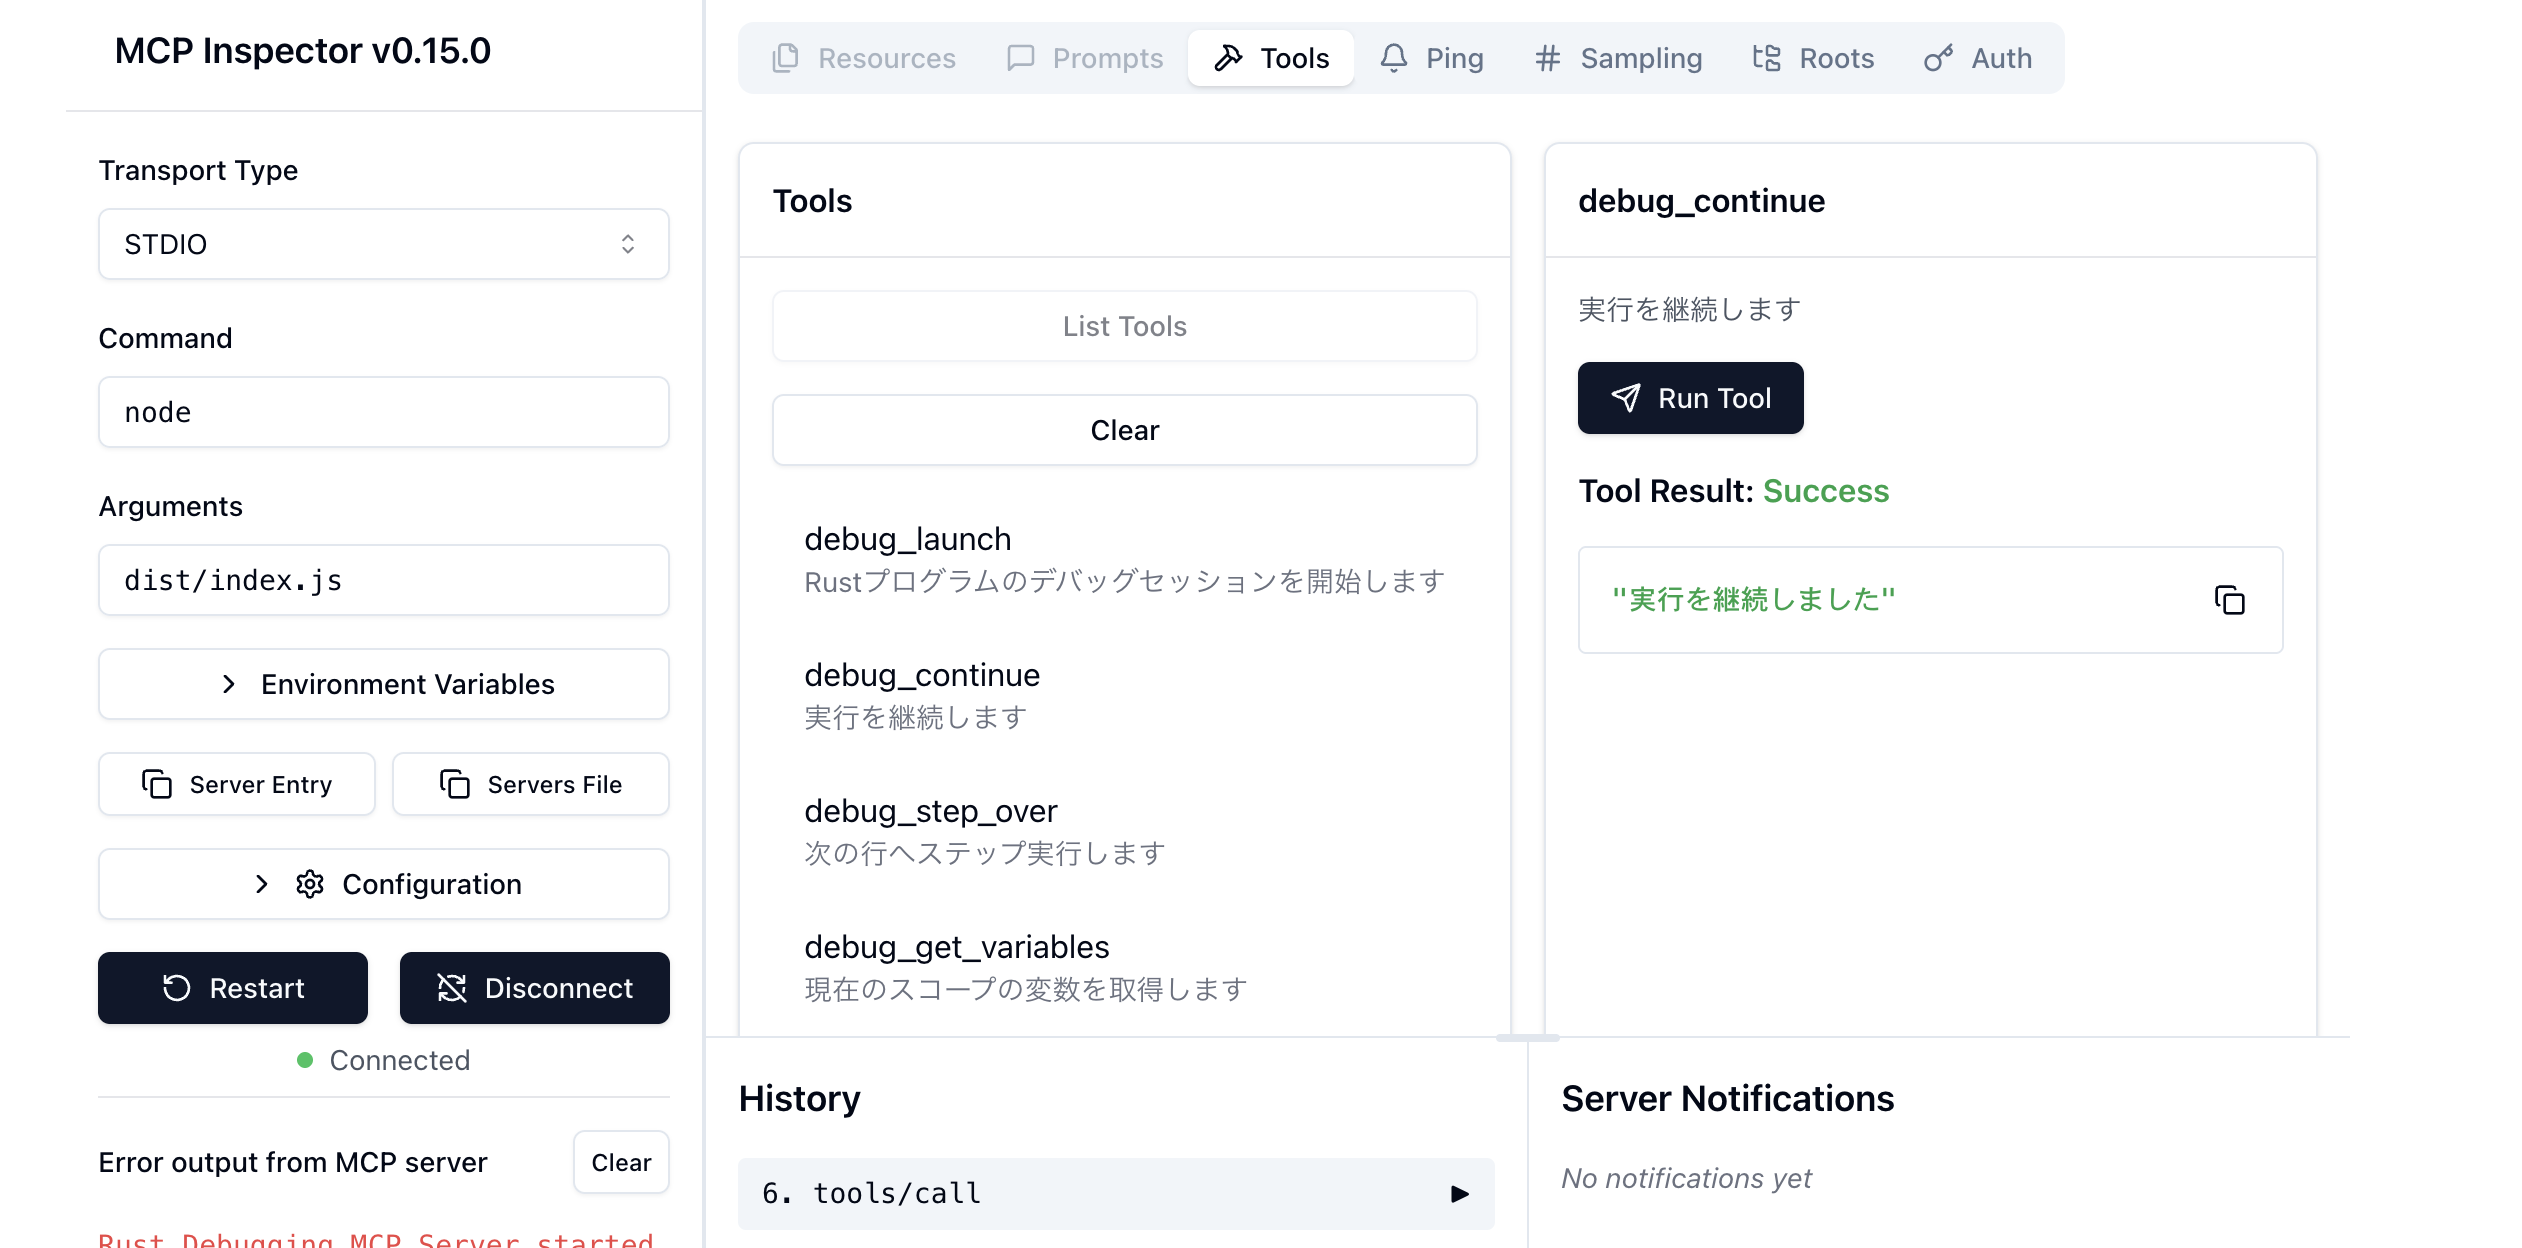
③ Continue Execution (until breakpoint)
Run the debug_continue tool.
Result:
Execution continued
The program runs until the set breakpoint (line 8) and stops there.
④ Check Variables
Run the debug_get_variables tool, resulting in:
Variables (6):
x: 10 (int)
y: 20 (int)
sum: 30 (int)
General Purpose Registers: {...} (unknown)
Floating Point Registers: {...} (unknown)
Exception State Registers: {...} (unknown)
You can see the values of variables at the breakpoint.
Register information is also retrieved.

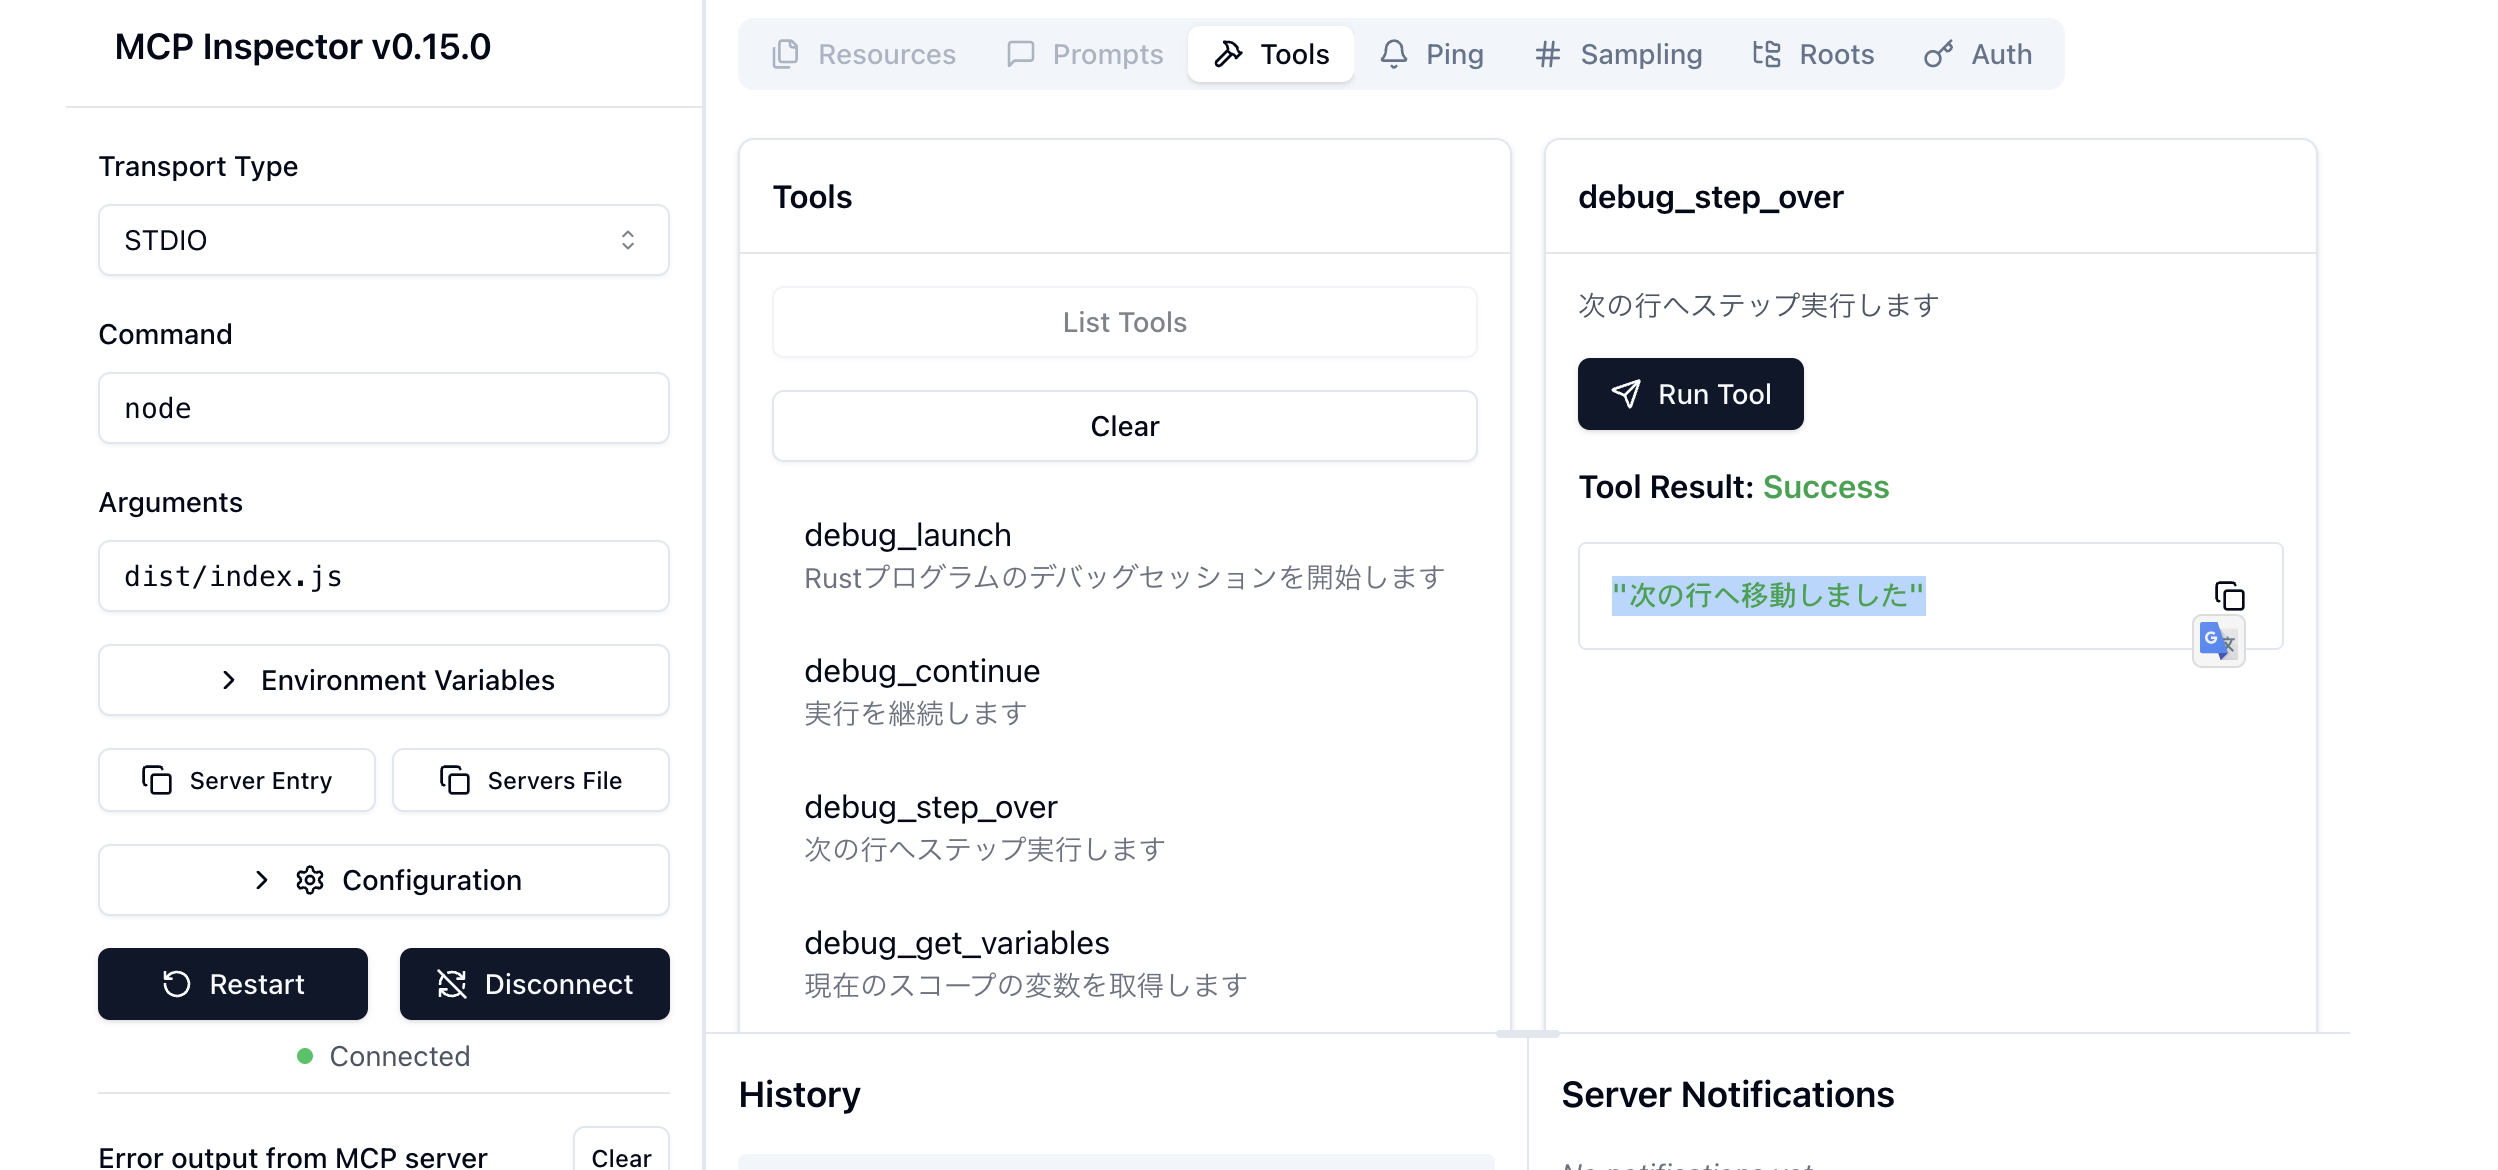
⑤ Step Over
Run the debug_step_over tool:
Moved to the next line
⑥ End Session
Finally, run debug_terminate to end:
Debug session terminated
This terminates the debug session and stops the target process.
All these operations can also be executed from agents like Claude Code.
This allows for interactive debugging.
※If you want to run from Claude Code, refer to this section
Summary
In this article, we explained how to implement debugging Rust programs using an MCP server.
Though it only covers basic functionality, it allows for interactive debugging.
With a proper implementation, you might be able to easily perform checks like
"set a breakpoint at @hoge.rs#13 and check the state of variable Z under condition XX" (unconfirmed).
Note that debugging other languages is also possible if there's a DAP-compatible debugger,
or if there's a language-specific debug protocol (e.g., Chrome DevTools Protocol).
(I successfully debugged TypeScript using CDP)
There are various MCP server debuggers on Github, so check them out.