Introduction
This is Pooja from Alliance department. This blog summaries learning New Relic through a beginner's lens.
What's New Relic
New Relic is a software company that provides cloud-based observability and application performance monitoring (APM) tools and services. Their products help organizations monitor, troubleshoot, and optimize the performance of their software applications and infrastructure in real-time. New Relic's offerings include APM, infrastructure monitoring, browser monitoring, synthetics, logs, and mobile monitoring, which are used by development and operations teams to ensure reliable and high-performing software experiences.

Use of New Relic
New Relic is used to monitor, troubleshoot, and optimize the performance of software applications and infrastructure in real-time. It provides observability and application performance monitoring (APM) tools and services that help organizations:
1. Monitor application performance: New Relic allows organizations to gain visibility into the health, performance, and behavior of their software applications, infrastructure, and user experiences.
2. Troubleshoot and diagnose issues: New Relic helps teams identify and diagnose issues in their applications and infrastructure by providing detailed insights into performance metrics, errors, crashes, and other anomalies.
3. Optimize application performance: New Relic enables organizations to optimize the performance of their applications and infrastructure by providing insights into areas that may need improvement.
4. Monitor user experiences: New Relic allows organizations to monitor user experiences with web and mobile applications, capturing data on page load times, errors, and other user interactions.
5. Test and validate applications: New Relic's synthetics product allows organizations to simulate user interactions and test the availability and performance of web applications and APIs from different global locations.
How to get started
Below are the steps which are used to get started with New Relic:
1. Sign up for an account: Go to the New Relic website (https://newrelic.com/) and sign up for a free trial or a paid account.
2. Choose your product: Select the New Relic product that best fits your monitoring and observability needs, such as APM, infrastructure monitoring, browser monitoring, synthetics, logs, or mobile monitoring.
3. Install agents or integrations: Follow the documentation and guides provided by New Relic to install and configure agents or integrations for your applications, infrastructure, or other sources to start collecting data.
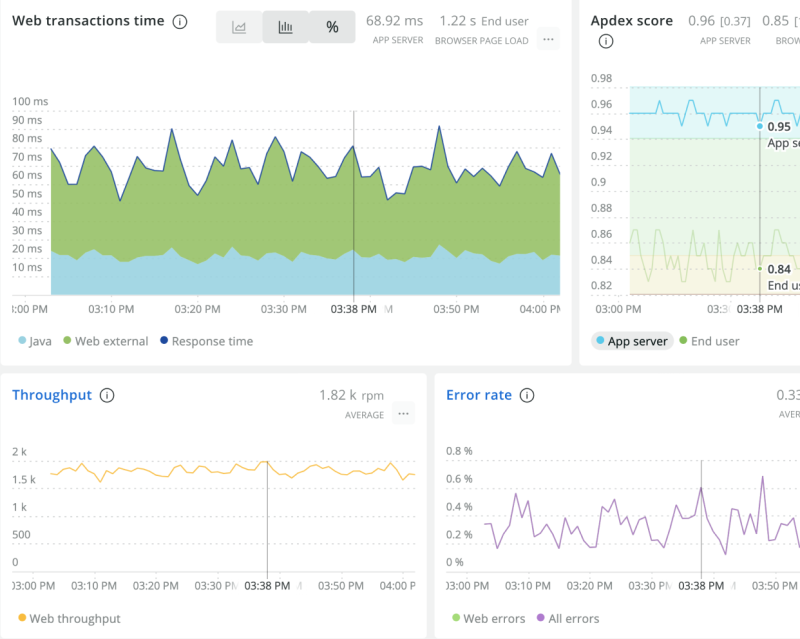
4. Explore the data: Once data is being collected, use the New Relic user interface to explore the performance metrics, traces, logs, and other data to gain insights into the performance of your applications and infrastructure.
5. Set up alerts: Configure alerts based on performance thresholds or other criteria to proactively notify you when issues or anomalies are detected in your applications or infrastructure.
6. Troubleshoot and optimize: Utilize New Relic's data and insights to troubleshoot performance issues, diagnose root causes, and optimize the performance of your applications and infrastructure.
7. Explore advanced features: New Relic offers advanced features, such as distributed tracing, anomaly detection, and machine learning-based insights, which can provide deeper visibility and analysis of your applications and infrastructure. Explore these features to enhance your monitoring capabilities.
8. Stay updated: Regularly review the New Relic documentation, release notes, and other resources to stay informed about the latest features, updates, and best practices.
Remember to refer to the official New Relic documentation and support resources for detailed instructions and guidance on using New Relic effectively for your specific use case.
Conclusion
Overall, New Relic's tools and services are used by development and operations teams to monitor, troubleshoot, and optimize the performance of their software applications and infrastructure, with the goal of delivering reliable, high-performing software experiences to end-users.
Here's hoping that this blog was helpful, thank you for your time.
Happy Learning!!!


