ALB ログフィールドが追加されても正しい Athena クエリ結果を得るための方法 〜直近の ALB ログフィールド追加の事例を添えて〜
こんにちは。クラウド事業本部トクヤマシュンです。
Amazon Application Load Balancer (以下 ALB )が出力するログは、運用や監査、トラブルシューティングのために非常に重要です。
これらのログは Amazon S3 に保存して Amazon Athena サービスでクエリを実行して分析することが一般的です。
この ALB ログですが、ログフィールドの追加が予告なく行われることがあります。
このような追加が発生すると、既存の Athena テーブルに対するクエリが動作しなくなり、業務に支障をきたす場合があります。
とくに障害時のような一分一秒を争う状況下において、クエリによる調査が行えないとなると、迅速な原因特定や対応が遅れてしまうリスクがあります。
本ブログでは、こうした追加に対して Athena テーブルに継続してクエリを実行して正しい結果を得る方法についてご紹介します。
直近のALB のログフィールド追加の例
筆者の環境では、 UTC で2025年8月19日付近を境に ALB ログのフィールドが追加されていました。
その結果、既存の Athena テーブルに対してクエリを実行しても値が返ってこなくなる事象が発生しました。
なお、筆者が確認した範囲では、ログが変わっている ALB とそうではない ALB がありました。
すべての ALB のログフィールドが一斉に変更されるわけではなさそうです。
読者のみなさまの環境によっては、まだ従来のログフィールドを持つログが出力されている可能性があります。
ご留意ください。
それでは、筆者の環境における2025年8月19日前後の変化を紹介します。
ログフィールドや Athena クエリの実行結果がどのように変わったのかを説明します。
2025年8月19日以前:正常にクエリが実行できていた時
この時の ALB のログファイルのサンプルデータは下記のようなものでした。
h2 2025-05-13T06:39:26.590604Z app/example-alb/0a4bb98662cea0bc 198.51.100.1:62196 192.168.0.1:80 -1 -1 -1 502 - 457 925 "GET https://example.com:443/test HTTP/2.0" "Mozilla/5.0 (Macintosh; Intel Mac OS X 10_15_7) AppleWebKit/537.36 (KHTML, like Gecko) Chrome/136.0.0.0 Safari/537.36" TLS_AES_128_GCM_SHA256 TLSv1.3 arn:aws:elasticloadbalancing:ap-northeast-1:123456789012:targetgroup/example-alb-tg/5aec5571baebdad4 "Root=1-6822e91e-74580f127dd29b1101dabbd3" "example.com" "arn:aws:acm:ap-northeast-1:123456789012:certificate/fed12345-1234-1f34-1da4-1234f12cbc12" 0 2025-05-13T06:39:26.579000Z "waf,forward" "-" "-" "192.168.0.1:80" "-" "-" "-" TID_56d2h4a8h634a45grs0b7fh1203a3621
h2 2025-05-13T06:39:26.761386Z app/example-alb/0a4bb98662cea0bc 198.51.100.1:62196 192.168.0.1:80 -1 -1 -1 502 - 350 925 "GET https://example.com:443/favicon.ico HTTP/2.0" "Mozilla/5.0 (Macintosh; Intel Mac OS X 10_15_7) AppleWebKit/537.36 (KHTML, like Gecko) Chrome/136.0.0.0 Safari/537.36" TLS_AES_128_GCM_SHA256 TLSv1.3 arn:aws:elasticloadbalancing:ap-northeast-1:123456789012:targetgroup/example-alb-tg/5aec5571baebdad4 "Root=1-6822e91e-18db15fd022396a6068683d5" "example.com" "arn:aws:acm:ap-northeast-1:123456789012:certificate/fed12345-1234-1f34-1da4-1234f12cbc12" 0 2025-05-13T06:39:26.753000Z "waf,forward" "-" "-" "192.168.0.1:80" "-" "-" "-" TID_56d2h4a8h634a45grs0b7fh1203a3621
ログフィールドとしては下記となっています。
| フィールド | 値 |
|---|---|
| type | h2 |
| time | 2025-05-13T06:39:26.590604Z |
| elb | app/example-alb/0a4bb98662cea0bc |
| client:port | 198.51.100.1:62196 |
| target:port | 192.168.0.1:80 |
| request_processing_time | -1 |
| target_processing_time | -1 |
| response_processing_time | -1 |
| elb_status_code | 502 |
| target_status_code | - |
| received_bytes | 457 |
| sent_bytes | 925 |
| request | GET https://example.com:443/test HTTP/2.0 |
| user_agent | Mozilla/5.0 (Macintosh; Intel Mac OS X 10_15_7) AppleWebKit/537.36 (KHTML, like Gecko) Chrome/136.0.0.0 Safari/537.36 |
| ssl_cipher | TLS_AES_128_GCM_SHA256 |
| ssl_protocol | TLSv1.3 |
| target_group_arn | arn:aws:elasticloadbalancing:ap-northeast-1:123456789012:targetgroup/example-alb-tg/5aec5571baebdad4 |
| trace_id | Root=1-6822e91e-74580f127dd29b1101dabbd3 |
| domain_name | example.com |
| chosen_cert_arn | arn:aws:acm:ap-northeast-1:123456789012:certificate/fed12345-1234-1f34-1da4-1234f12cbc12 |
| matched_rule_priority | 0 |
| request_creation_time | 2025-05-13T06:39:26.579000Z |
| actions_executed | waf,forward |
| redirect_url | - |
| error_reason | - |
| target:port_list | 192.168.0.1:80 |
| target_status_code_list | - |
| classification | - |
| classification_reason | - |
| conn_trace_id | TID_56d2h4a8h634a45grs0b7fh1203a3621 |
このようなログに対してAthenaクエリを実行するための CREATE TABLE ステートメントは下記でした。
CREATE EXTERNAL TABLE IF NOT EXISTS alb_access_logs (
            type string,
            time string,
            elb string,
            client_ip string,
            client_port int,
            target_ip string,
            target_port int,
            request_processing_time double,
            target_processing_time double,
            response_processing_time double,
            elb_status_code int,
            target_status_code string,
            received_bytes bigint,
            sent_bytes bigint,
            request_verb string,
            request_url string,
            request_proto string,
            user_agent string,
            ssl_cipher string,
            ssl_protocol string,
            target_group_arn string,
            trace_id string,
            domain_name string,
            chosen_cert_arn string,
            matched_rule_priority string,
            request_creation_time string,
            actions_executed string,
            redirect_url string,
            lambda_error_reason string,
            target_port_list string,
            target_status_code_list string,
            classification string,
            classification_reason string,
            conn_trace_id string
            )
            PARTITIONED BY
            (
             day STRING
            )
            ROW FORMAT SERDE 'org.apache.hadoop.hive.serde2.RegexSerDe'
            WITH SERDEPROPERTIES (
            'serialization.format' = '1',
            'input.regex' =
        '([^ ]*) ([^ ]*) ([^ ]*) ([^ ]*):([0-9]*) ([^ ]*)[:-]([0-9]*) ([-.0-9]*) ([-.0-9]*) ([-.0-9]*) (|[-0-9]*) (-|[-0-9]*) ([-0-9]*) ([-0-9]*) \"([^ ]*) (.*) (- |[^ ]*)\" \"([^\"]*)\" ([A-Z0-9-_]+) ([A-Za-z0-9.-]*) ([^ ]*) \"([^\"]*)\" \"([^\"]*)\" \"([^\"]*)\" ([-.0-9]*) ([^ ]*) \"([^\"]*)\" \"([^\"]*)\" \"([^ ]*)\" \"([^\\s]+?)\" \"([^\\s]+)\" \"([^ ]*)\" \"([^ ]*)\" ?([^ ]*)?'
            )
            LOCATION 's3://amzn-s3-demo-bucket/AWSLogs/<ACCOUNT-NUMBER>/elasticloadbalancing/<REGION>/'
            TBLPROPERTIES
            (
             "projection.enabled" = "true",
             "projection.day.type" = "date",
             "projection.day.range" = "2022/01/01,NOW",
             "projection.day.format" = "yyyy/MM/dd",
             "projection.day.interval" = "1",
             "projection.day.interval.unit" = "DAYS",
             "storage.location.template" = "s3://amzn-s3-demo-bucket/AWSLogs/<ACCOUNT-NUMBER>/elasticloadbalancing/<REGION>/${day}"
            )
<ACCOUNT-NUMBER> と <REGION> や S3 バケット名は適宜置き換えてください。
また、パーティションにdayを設定しています。
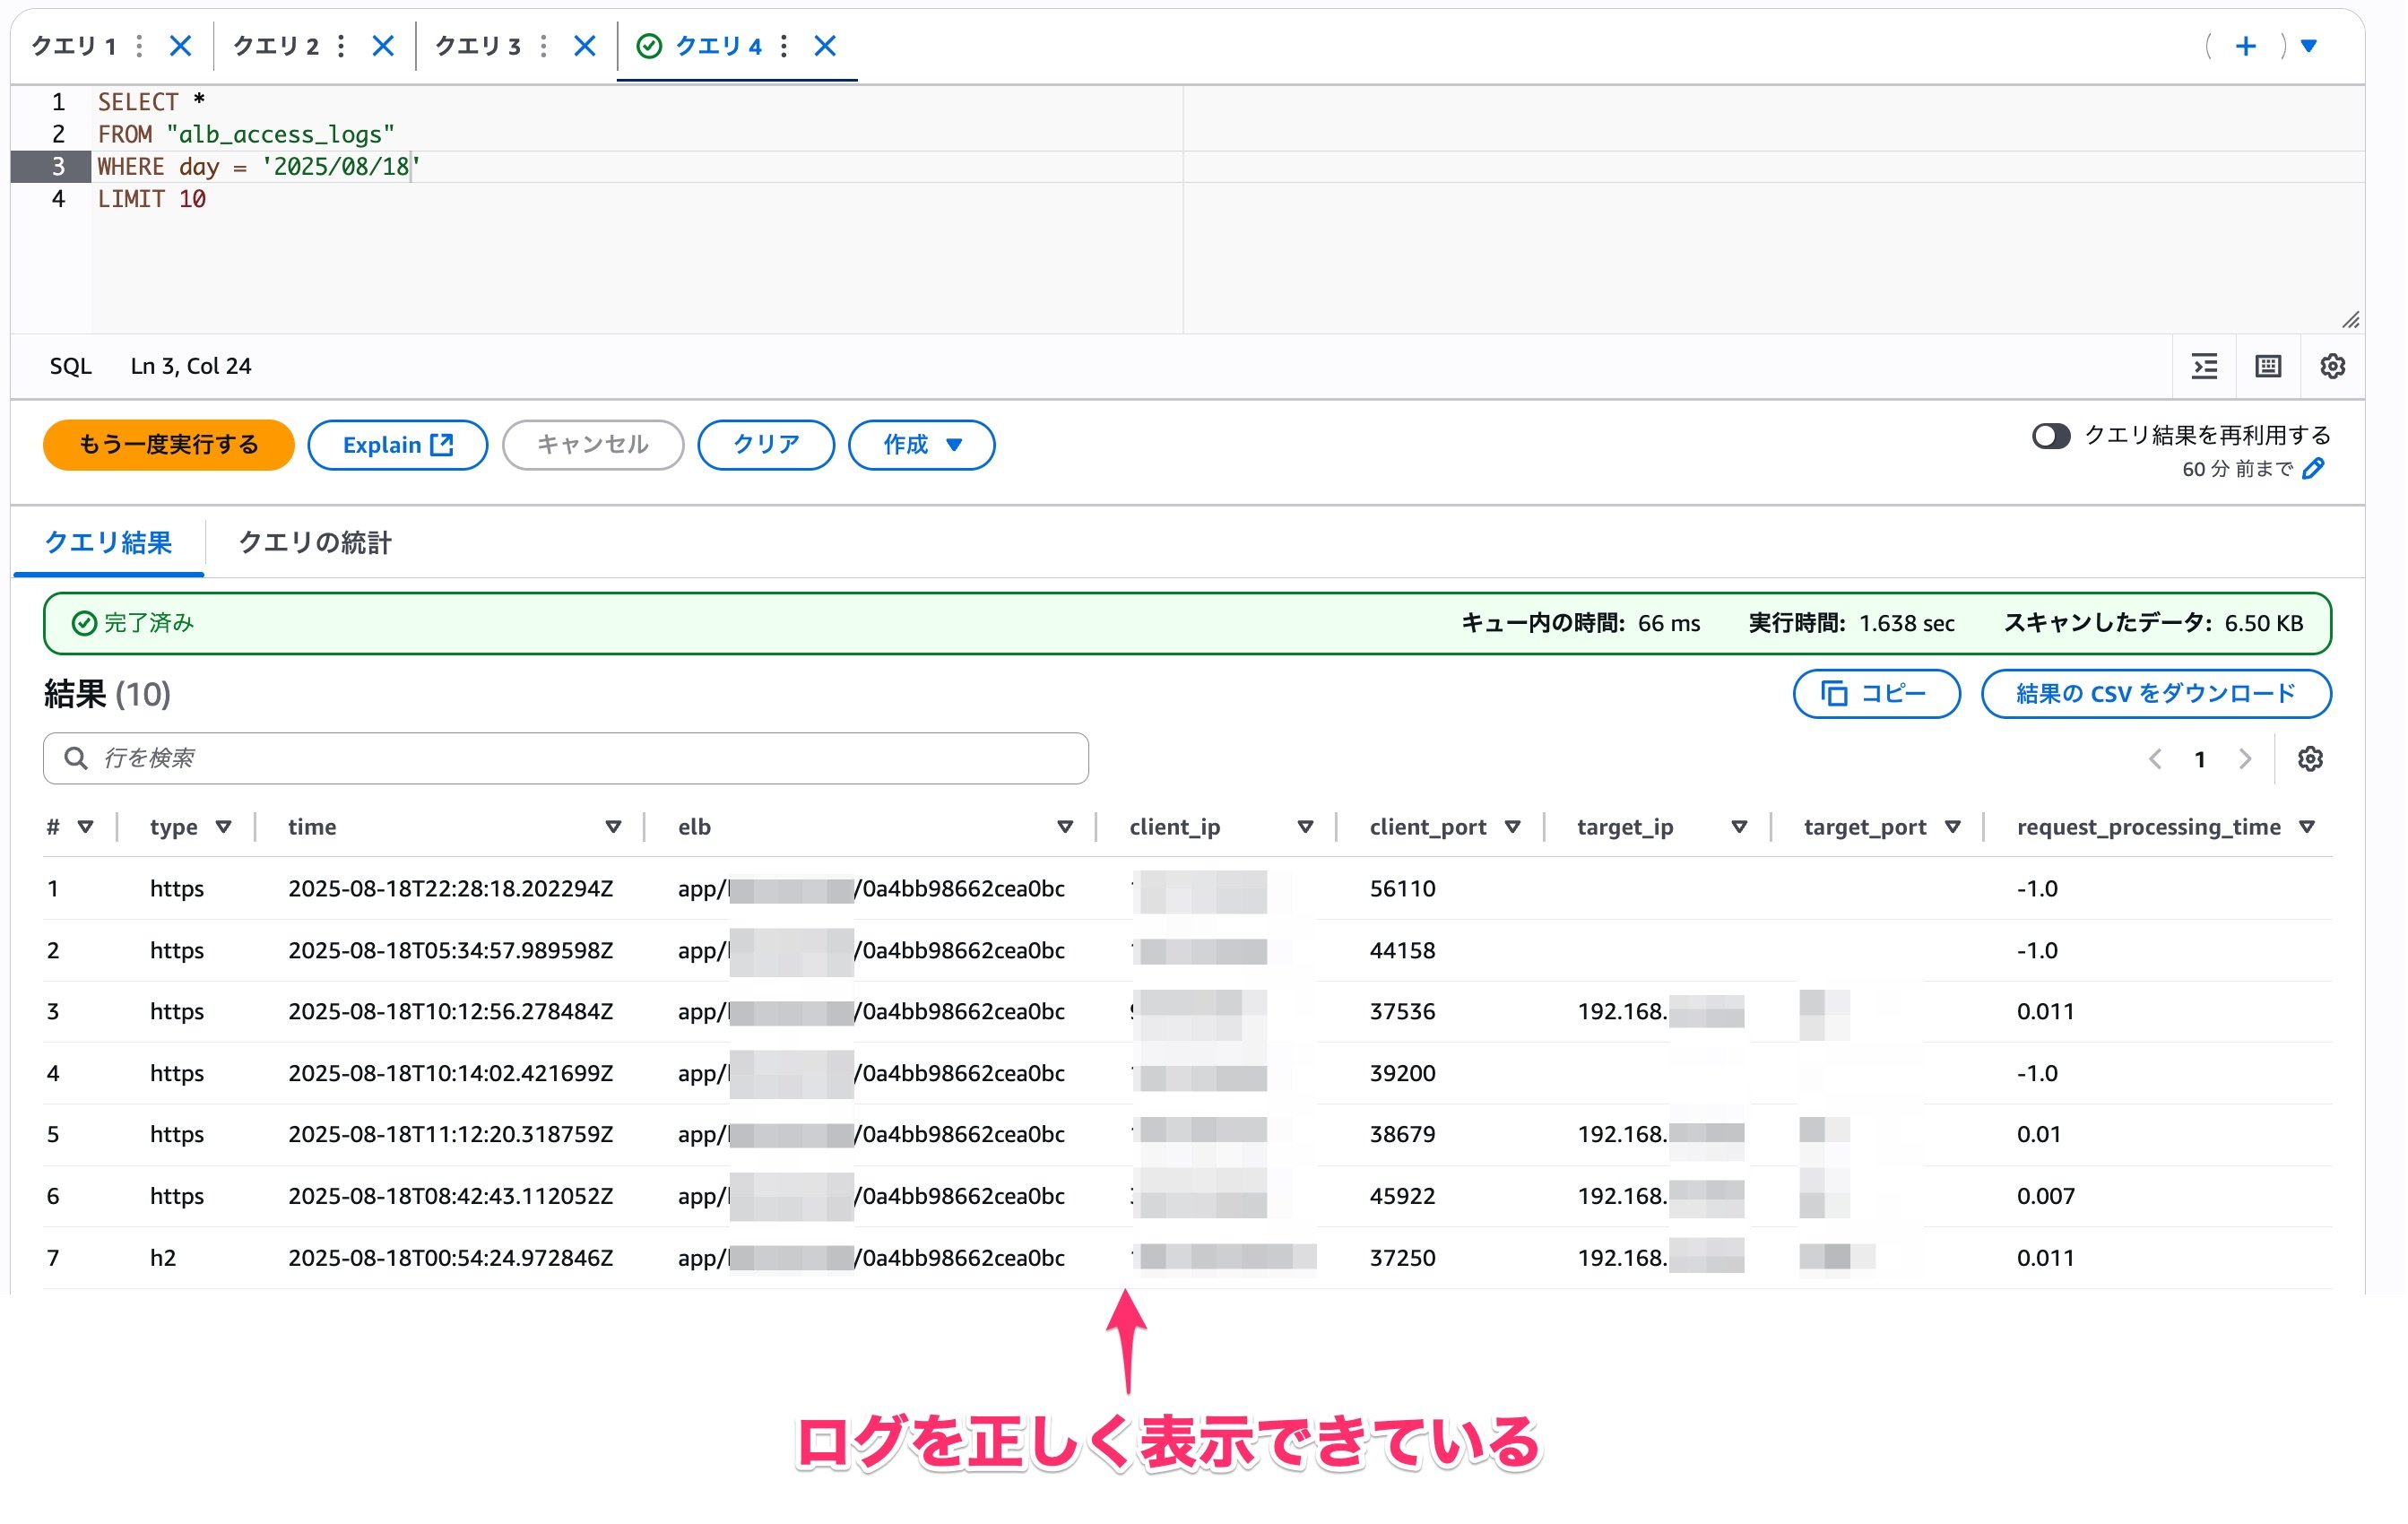
テーブルを作成して Athena クエリを実行した時の例は下図の通りで、ログを正しく表示できていました。
2025年8月19日より後:正常にクエリが実行できなくなった時
2025年8月19日より後にフィールドが追加された ALB のログファイルのサンプルデータは下記のようなものでした。
h2 2025-08-21T00:03:30.639767Z app/example-alb/0a4bb98662cea0bc 198.51.100.1:43601 192.168.0.1:80 0.011 0.005 0.000 200 200 264 3765 "GET https://example.com:443/test HTTP/2.0" "Mozilla/5.0 AppleWebKit/537.36 (KHTML, like Gecko; compatible; bingbot/2.0; +http://www.bing.com/bingbot.htm) Chrome/116.0.1938.76 Safari/537.36" TLS_AES_128_GCM_SHA256 TLSv1.3 arn:aws:elasticloadbalancing:ap-northeast-1:123456789012:targetgroup/example-alb-tg/5aec5571baebdad4 "Root=1-68a66252-473bccdd060d3cbf16b6829f" "example.com" "arn:aws:acm:ap-northeast-1:123456789012:certificate/fed12345-1234-1f34-1da4-1234f12cbc12" 0 2025-08-21T00:03:30.624000Z "waf,forward" "-" "-" "192.168.0.1:80" "200" "-" "-" TID_12b1d1d1e123f12ebc0b8ea0203d1234 "-" "-" "-"
h2 2025-08-21T00:03:31.209967Z app/example-alb/0a4bb98662cea0bc 198.51.100.1:43601 192.168.0.1:80 0.006 0.006 0.000 200 200 264 7717 "GET https://example.com:443/test2 HTTP/2.0" "Mozilla/5.0 AppleWebKit/537.36 (KHTML, like Gecko; compatible; bingbot/2.0; +http://www.bing.com/bingbot.htm) Chrome/116.0.1938.76 Safari/537.36" TLS_AES_128_GCM_SHA256 TLSv1.3 arn:aws:elasticloadbalancing:ap-northeast-1:123456789012:targetgroup/example-alb-tg/5aec5571baebdad4 "Root=1-68a66253-44d54d814caf090b0334b31d" "example.com" "arn:aws:acm:ap-northeast-1:123456789012:certificate/fed12345-1234-1f34-1da4-1234f12cbc12" 0 2025-08-21T00:03:31.197000Z "waf,forward" "-" "-" "192.168.0.1:80" "200" "-" "-" TID_12b1d1d1e123f12ebc0b8ea0203d1234 "-" "-" "-"
ログフィールドとしては下記となっており、末尾に3フィールド追加されていました。
| フィールド | 値 |
|---|---|
| type | h2 |
| time | 2025-08-21T00:03:30.639767Z |
| elb | app/example-alb/0a4bb98662cea0bc |
| client:port | 198.51.100.1:43601 |
| target:port | 192.168.0.1:80 |
| request_processing_time | 0.011 |
| target_processing_time | 0.005 |
| response_processing_time | 0.000 |
| elb_status_code | 200 |
| target_status_code | 200 |
| received_bytes | 264 |
| sent_bytes | 3765 |
| request | GET https://example.com:443/test HTTP/2.0 |
| user_agent | Mozilla/5.0 AppleWebKit/537.36 (KHTML, like Gecko; compatible; bingbot/2.0; +http://www.bing.com/bingbot.htm) Chrome/116.0.1938.76 Safari/537.36 |
| ssl_cipher | TLS_AES_128_GCM_SHA256 |
| ssl_protocol | TLSv1.3 |
| target_group_arn | arn:aws:elasticloadbalancing:ap-northeast-1:123456789012:targetgroup/example-alb-tg/5aec5571baebdad4 |
| trace_id | Root=1-68a66252-473bccdd060d3cbf16b6829f |
| domain_name | example.com |
| chosen_cert_arn | arn:aws:acm:ap-northeast-1:123456789012:certificate/fed12345-1234-1f34-1da4-1234f12cbc12 |
| matched_rule_priority | 0 |
| request_creation_time | 2025-08-21T00:03:30.624000Z |
| actions_executed | waf,forward |
| redirect_url | - |
| error_reason | - |
| target:port_list | 192.168.0.1:80 |
| target_status_code_list | 200 |
| classification | - |
| classification_reason | - |
| conn_trace_id | TID_12b1d1d1e123f12ebc0b8ea0203d1234 |
| 謎の追加列1 | - |
| 謎の追加列2 | - |
| 謎の追加列3 | - |
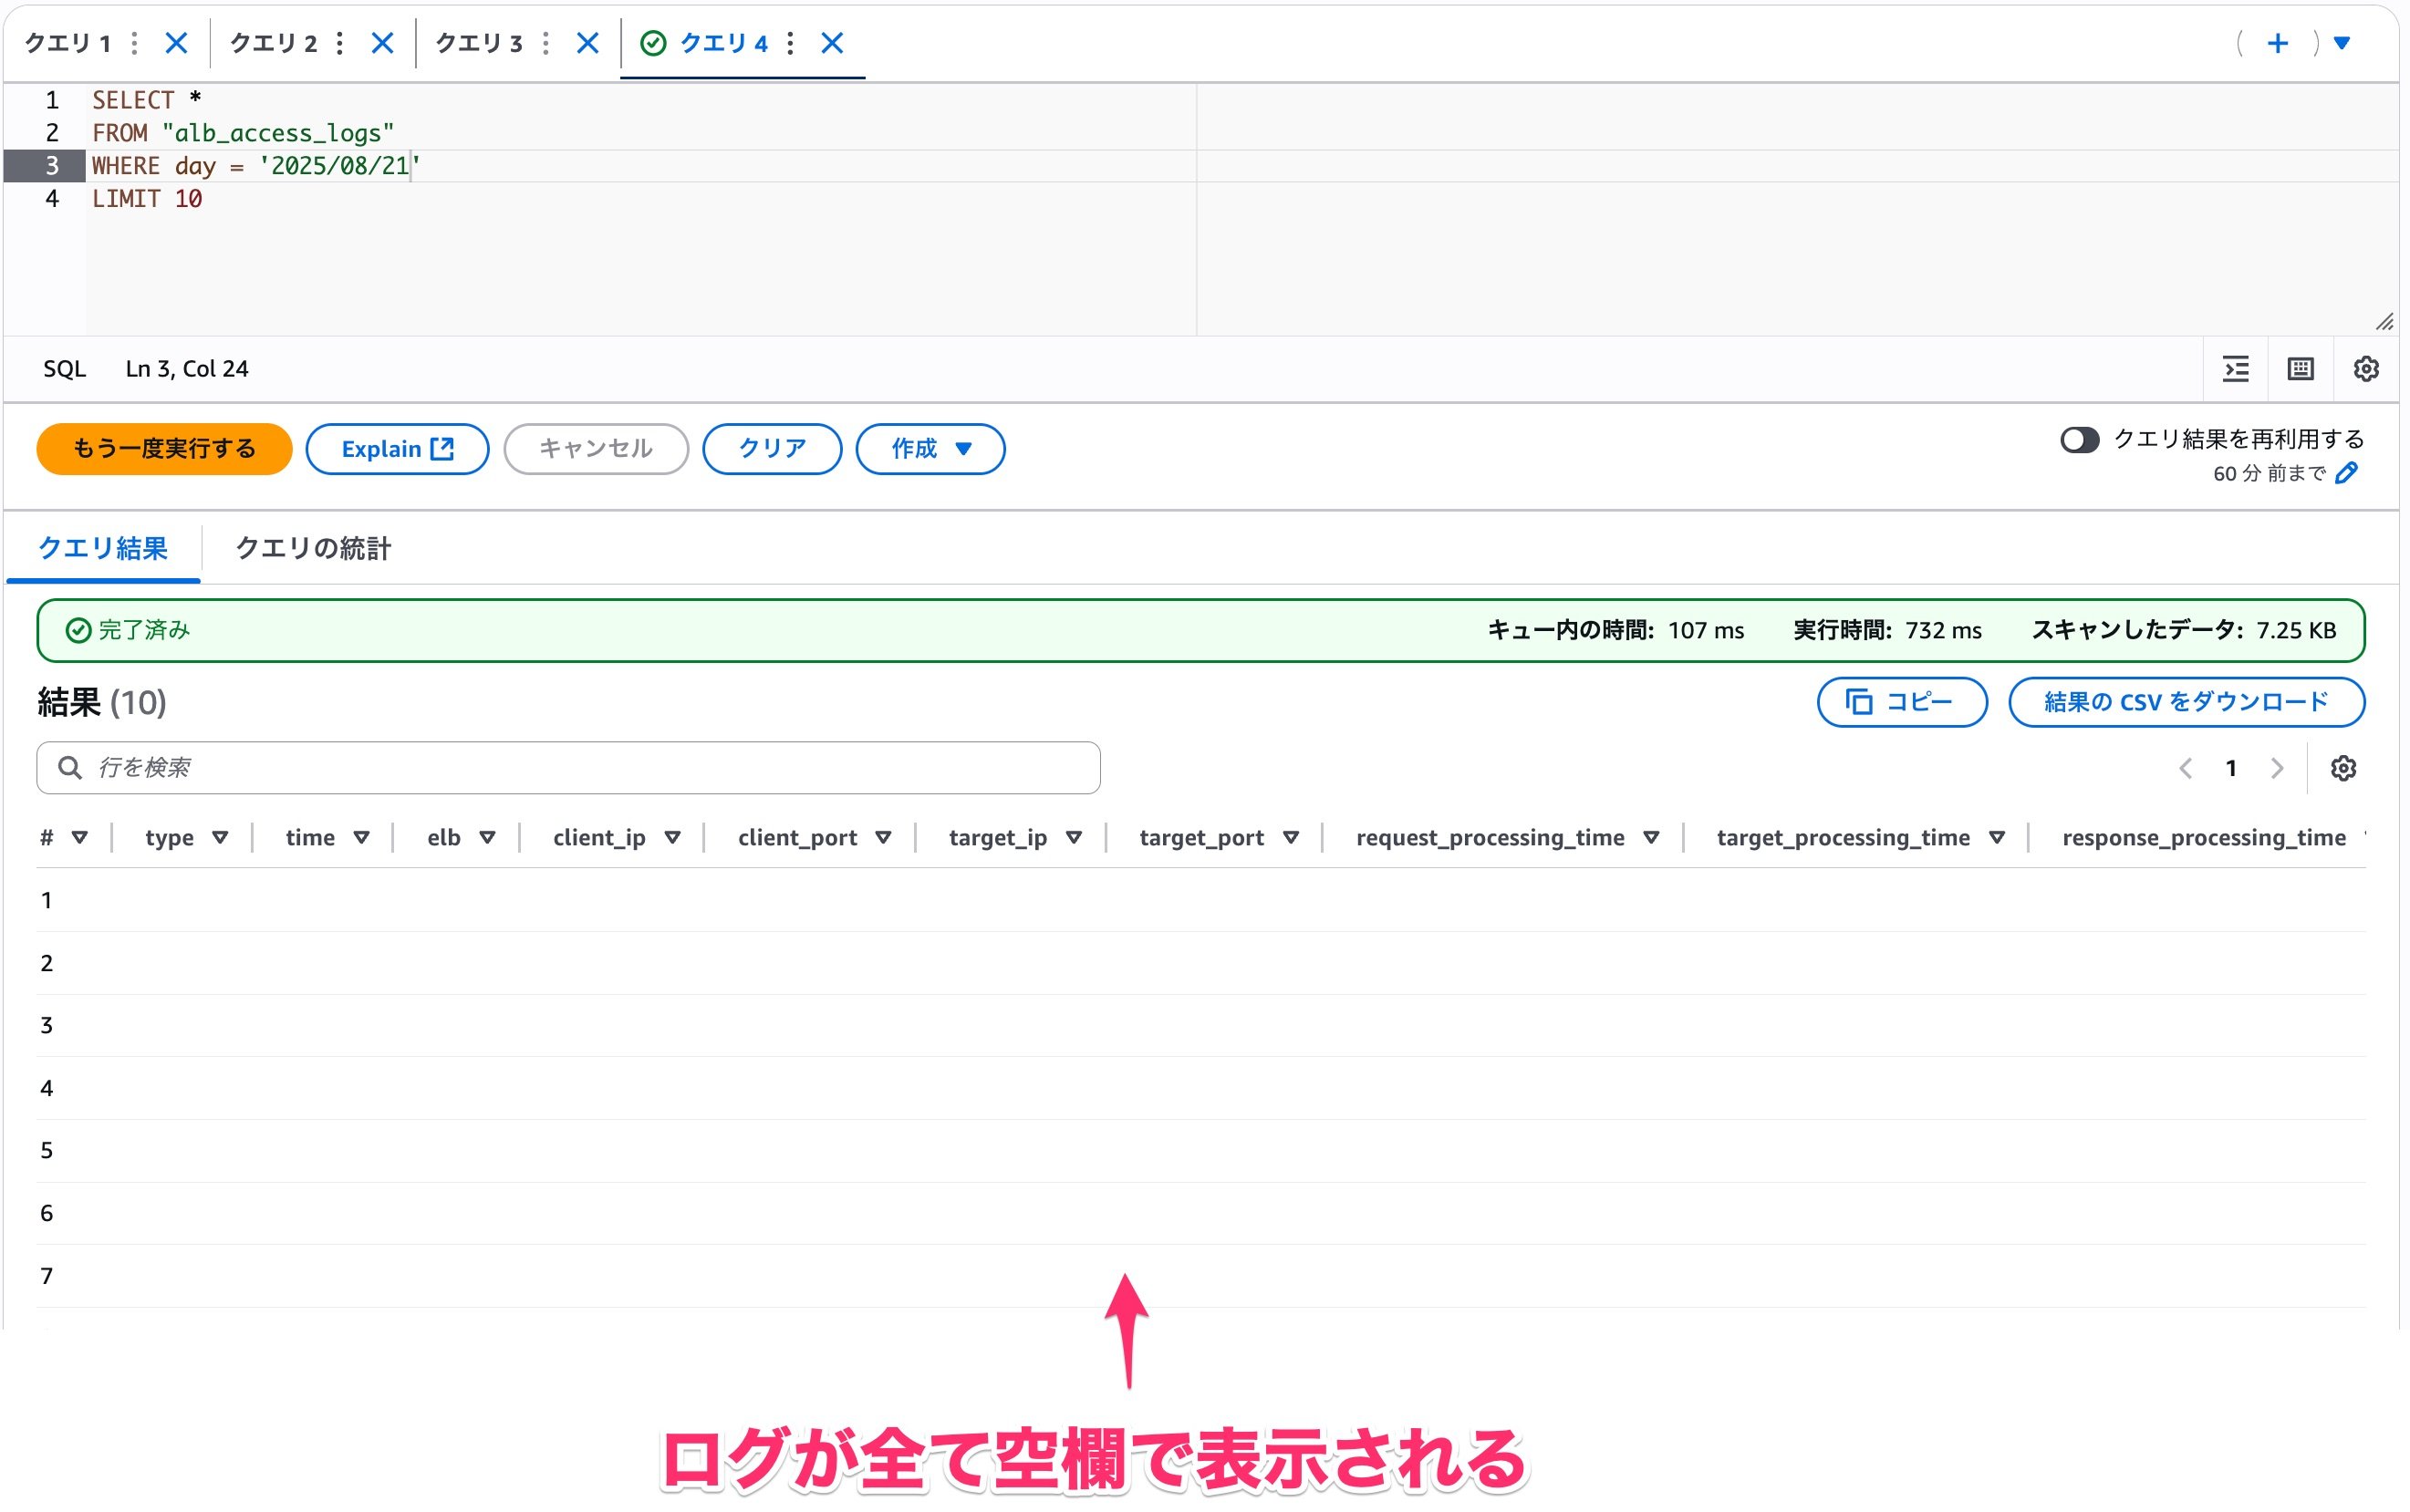
このようなログに対して先ほど作成したテーブルに同じクエリを実行すると下図のようになります。
ログがすべて空欄で表示されるようになってしまいました。
このフィールド追加については、2025年8月21日時点では ALB、Athena どちらの公式ドキュメントにも記載はありませんでした。
ログフィールドが追加されてもクエリを継続するための対応
このような状況でも正しくクエリ結果を得る方法があります。
Athena テーブルをログフィールドの追加に対応する形式に変更することで対応可能です。
問題の原因は、ログフィールドの追加によってログファイルをテーブルとして解釈できなくなることです。
そのため、新しいフィールドも解釈できるように下記のようにテーブル定義を調整します。
CREATE EXTERNAL TABLE IF NOT EXISTS alb_access_logs (
            type string,
            time string,
            elb string,
            client_ip string,
            client_port int,
            target_ip string,
            target_port int,
            request_processing_time double,
            target_processing_time double,
            response_processing_time double,
            elb_status_code int,
            target_status_code string,
            received_bytes bigint,
            sent_bytes bigint,
            request_verb string,
            request_url string,
            request_proto string,
            user_agent string,
            ssl_cipher string,
            ssl_protocol string,
            target_group_arn string,
            trace_id string,
            domain_name string,
            chosen_cert_arn string,
            matched_rule_priority string,
            request_creation_time string,
            actions_executed string,
            redirect_url string,
            lambda_error_reason string,
            target_port_list string,
            target_status_code_list string,
            classification string,
            classification_reason string,
            conn_trace_id string,
            additional_column string
            )
            PARTITIONED BY
            (
             day STRING
            )
            ROW FORMAT SERDE 'org.apache.hadoop.hive.serde2.RegexSerDe'
            WITH SERDEPROPERTIES (
            'serialization.format' = '1',
            'input.regex' =
        '([^ ]*) ([^ ]*) ([^ ]*) ([^ ]*):([0-9]*) ([^ ]*)[:-]([0-9]*) ([-.0-9]*) ([-.0-9]*) ([-.0-9]*) (|[-0-9]*) (-|[-0-9]*) ([-0-9]*) ([-0-9]*) \"([^ ]*) (.*) (- |[^ ]*)\" \"([^\"]*)\" ([A-Z0-9-_]+) ([A-Za-z0-9.-]*) ([^ ]*) \"([^\"]*)\" \"([^\"]*)\" \"([^\"]*)\" ([-.0-9]*) ([^ ]*) \"([^\"]*)\" \"([^\"]*)\" \"([^ ]*)\" \"([^\\s]+?)\" \"([^\\s]+)\" \"([^ ]*)\" \"([^ ]*)\" ?([^ ]*)? ?(.*)?'
            )
            LOCATION 's3://amzn-s3-demo-bucket/AWSLogs/<ACCOUNT-NUMBER>/elasticloadbalancing/<REGION>/'
            TBLPROPERTIES
            (
             "projection.enabled" = "true",
             "projection.day.type" = "date",
             "projection.day.range" = "2022/01/01,NOW",
             "projection.day.format" = "yyyy/MM/dd",
             "projection.day.interval" = "1",
             "projection.day.interval.unit" = "DAYS",
             "storage.location.template" = "s3://amzn-s3-demo-bucket/AWSLogs/<ACCOUNT-NUMBER>/elasticloadbalancing/<REGION>/${day}"
            )
先ほどと同様、 <ACCOUNT-NUMBER> と <REGION> や S3 バケット名は適宜置き換えてください。
また、パーティションにdayを設定しています。
この対応のポイントは下記です。
- 追加フィールドを格納するカラムを末尾に1つ追加
additional_columnの行が相当します
- 追加フィールドを1つの文字列として解釈して追加カラムに格納
- 正規表現の末尾に「 ?(.*)?」を追加し、任意の文字列にマッチさせます
この対応により、今回の ALB のログフィールド追加に対応できます。
さらに、今後フィールドが追加されても Athena クエリを継続的に実行し、正しい結果を得ることが可能となります。
最近の ALB のログフィールド変更での対応例
では、今回の ALB に対して Athena テーブル定義を変更した時の動作を説明します。
2025年8月19日以降のログに対して、対応後のテーブルでクエリを実行した結果は下記の通りです。
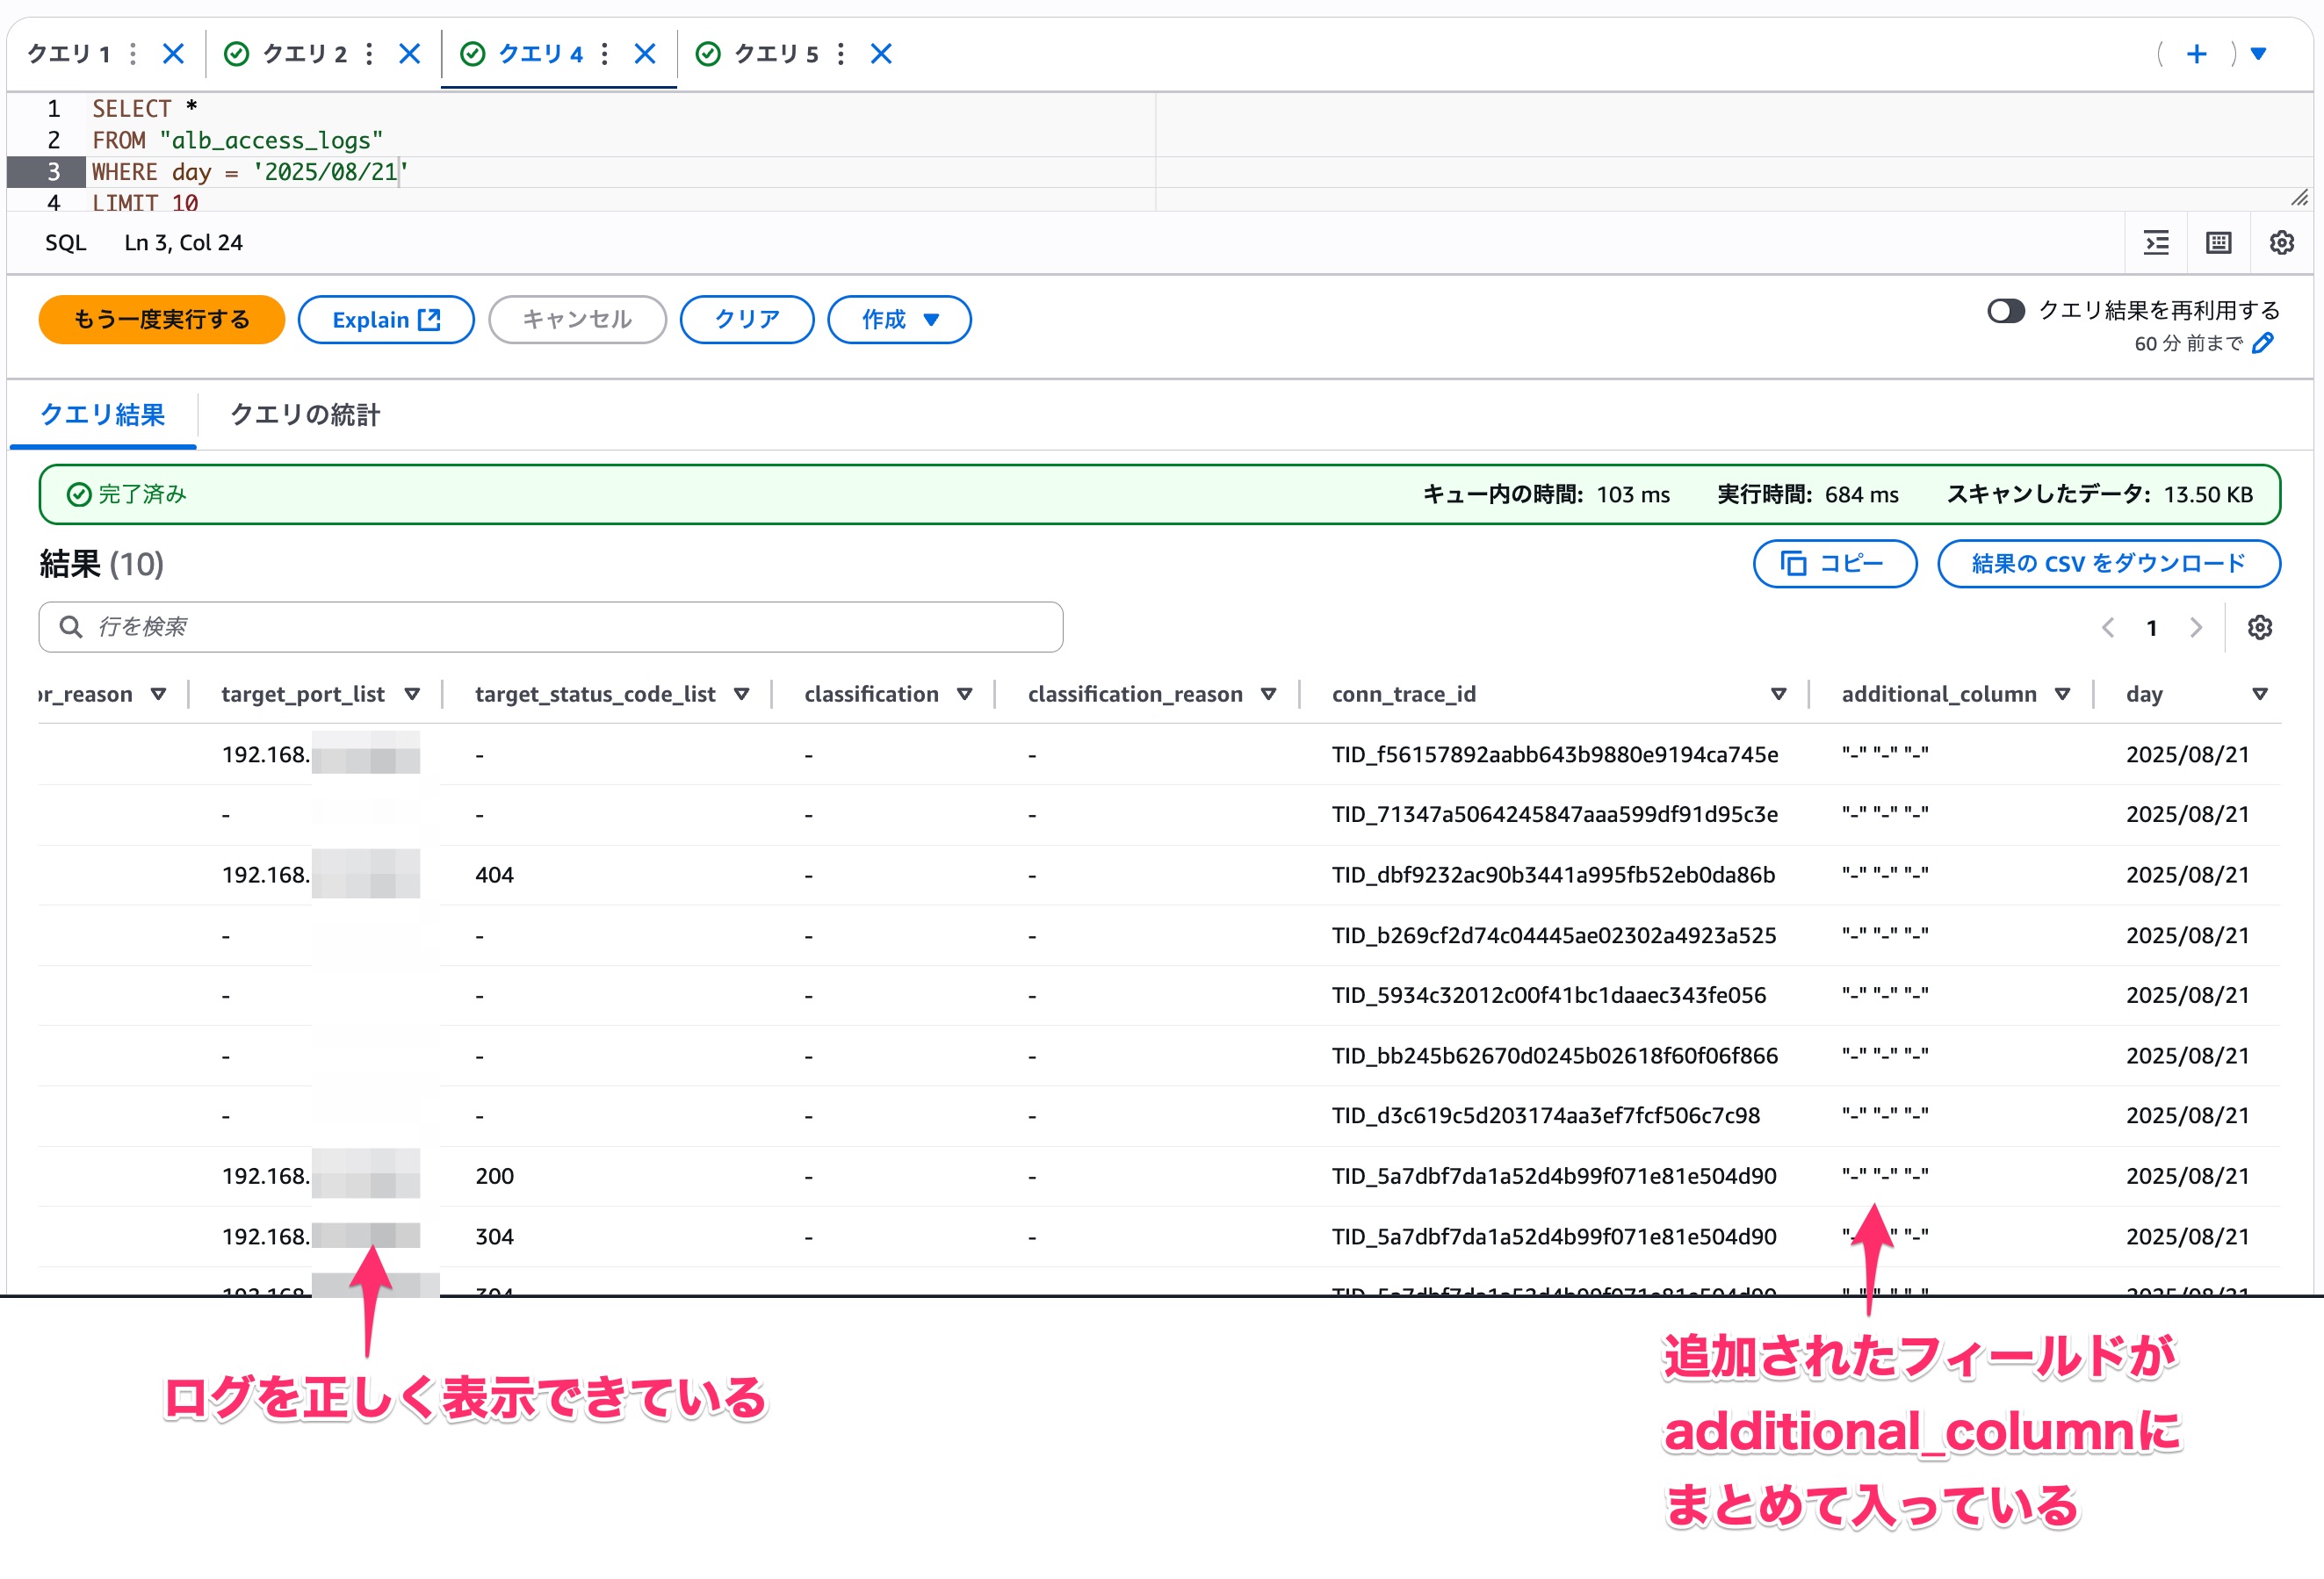
ログを正しく表示できました。
フィールドが3つ追加されていましたが、それらが1つの文字列として解釈されて追加カラムadditional_columnにまとめて入っていることがわかります。
このようにいくつフィールドが追加されても、まとめてadditional_columnに格納することで、既存フィールドは従来通り正しい結果を得ることができ、将来的な変更にも対応することが可能です。
本対応の注意点
本対応では下記が前提となっていますのでご注意ください。
- 末尾にフィールドが追加される以外の変更には対応していない
- 追加フィールドを個別の列として正しく認識するためには別途テーブル定義をしてあげることが必要
- 今回の ALB の場合、ドキュメントが更新されて3つの追加フィールドのカラム名が判明したら、
additional_column列の直前に新しい列を追加し、正規表現を内容に合わせて変更してください。
- 今回の ALB の場合、ドキュメントが更新されて3つの追加フィールドのカラム名が判明したら、
まとめ
最近行われた ALB のログフィールドに対しても Athena で正しくクエリ結果を得る方法をご紹介しました。
この方法だと将来的に末尾にログフィールドが追加されても対応が可能となります。
フィールドの変更によってうまくクエリが実行できなくなっている方はもちろん、
急に Athena クエリが使えなくなって困るという方も既存の Athena テーブルを今回ご紹介したもので作り直してみるのはいかがでしょうか。
最後に、本件のトラブルシューティングにお付き合いいただいた suzuki.ryo さんに感謝します。
本ブログがどなたかのお役に立てば嬉しいです。