![[アップデート] Amazon Managed Service for Prometheus でマネージドコレクターのログを CloudWatch ログに出力できるようになりました](https://images.ctfassets.net/ct0aopd36mqt/wp-thumbnail-1ea7363c1b664244217efede0011361f/5e51316b2b9f0a33565d10b7924afad2/amazon-managed-service-for-prometheus?w=3840&fm=webp)
[アップデート] Amazon Managed Service for Prometheus でマネージドコレクターのログを CloudWatch ログに出力できるようになりました
Amazon Managed Service for Prometheus(AMP) でマネージドコレクターのログを CloudWatch に出力できるようになりました。
アップデート概要
AMP マネージドコレクターは EKS に Prometheus エージェントをインストールせずに Prometheus 形式で出力されたメトリクスを収集できる機能です。
マネージドな機能でスクレイピングできるためにエージェント管理が不要となるのですが、何らかの理由で上手くスクレイピングできていなかった際にトラブルシューティングし辛いという欠点がありました。
今回のアップデートに依り、マネージドコレクター側のログを CloudWatch ログに出力できるようになりました。
ログには下記 3 種類が存在して、それぞれ有効化するかどうかを選択可能です。
| ログ名 | 内容 |
|---|---|
| サービス検出ログ | スクレイピングするターゲット検出に関するログ |
| コレクターログ | スクレイピングプロセスに関するログ |
| エクスポーターログ | AMP ワークスペースに送信するプロセスに関するログ |
環境セットアップ
監視対象の EKS を Terraform で作成します。
まず、VPC を作成します。
module "vpc" {
  source  = "terraform-aws-modules/vpc/aws"
  version = "~> 6.0.1"

  name = "eks-vpc"

  cidr = "10.0.0.0/16"

  azs             = ["ap-northeast-1a", "ap-northeast-1c", "ap-northeast-1d"]
  public_subnets  = ["10.0.0.0/24", "10.0.1.0/24", "10.0.2.0/24"]
  private_subnets = ["10.0.100.0/24", "10.0.101.0/24", "10.0.102.0/24"]

  enable_nat_gateway = true
  single_nat_gateway = true
  public_subnet_tags = {
    "kubernetes.io/role/elb" = 1
  }

  private_subnet_tags = {
    "kubernetes.io/role/internal-elb" = 1
  }

}
EKS クラスターを作成します。
locals {
  cluster_name = "test-cluster"
}

module "eks" {
  source  = "terraform-aws-modules/eks/aws"
  version = "~> 21.0.4"

  name               = local.cluster_name
  kubernetes_version = "1.33"

  addons = {
    coredns    = {}
    kube-proxy = {}
    vpc-cni = {
      before_compute = true
    }
  }

  endpoint_public_access  = true
  endpoint_private_access = true
  enable_irsa             = true

  authentication_mode = "API"

  vpc_id     = module.vpc.vpc_id
  subnet_ids = module.vpc.private_subnets

  enable_cluster_creator_admin_permissions = true

  eks_managed_node_groups = {
    default = {
      name = "default"

      ami_type       = "AL2023_x86_64_STANDARD"
      instance_types = ["t3.medium"]

      min_size     = 1
      max_size     = 3
      desired_size = 1

      metadata_options = {
        http_tokens                 = "required"
        http_put_response_hop_limit = 2
      }
    }
  }

  security_group_additional_rules = {
    ingress = {
      description = "Allow HTTPS Ingress Traffic"
      protocol    = "tcp"
      from_port   = 443
      to_port     = 443
      type        = "ingress"
      cidr_blocks = [module.vpc.vpc_cidr_block]
    }
    egress = {
      description = "Allow All Egress Traffic"
      protocol    = "-1"
      from_port   = 0
      to_port     = 0
      type        = "egress"
      cidr_blocks = ["0.0.0.0/0"]
    }
  }

  node_security_group_additional_rules = {
    nginx_exporter_ingress = {
      description = "Allow Ingress Traffic for Nginx Exporter"
      protocol    = "tcp"
      from_port   = 9113
      to_port     = 9113
      type        = "ingress"
      cidr_blocks = [module.vpc.vpc_cidr_block]
    }
  }
}
EKS クラスターを作成する際、クラスターエンドポイントへのプライベートアクセスが有効化されている必要があることに注意が必要です。
Amazon EKS クラスターには、プライベートアクセスを含むようにクラスターエンドポイントのアクセスコントロールが設定されている必要があります。プライベートとパブリックを含めることができますが、プライベートを含める必要があります。
Amazon EKS クラスター VPC が存在する Amazon では、 DNS が有効になっている必要があります。
https://docs.aws.amazon.com/ja_jp/prometheus/latest/userguide/AMP-collector-how-to.html#AMP-collector-create
続けて EKS に Nginx をデプロイします。
この際、Nginx Prometheus Exporter も含めておきます。
apiVersion: apps/v1
kind: Deployment
metadata:
  namespace: default
  name: nginx
  labels:
    app.kubernetes.io/name: nginx
spec:
  selector:
    matchLabels:
      app.kubernetes.io/name: nginx
  replicas: 1
  template:
    metadata:
      labels:
        app.kubernetes.io/name: nginx
      annotations:
        prometheus.io/scrape: "true"
        prometheus.io/port: "9113"
        prometheus.io/path: "/metrics"
    spec:
      containers:
        - image: nginx
          imagePullPolicy: Always
          name: nginx
          ports:
            - containerPort: 80
          volumeMounts:
            - name: nginx-config
              mountPath: /etc/nginx/conf.d
        - name: nginx-exporter
          image: nginx/nginx-prometheus-exporter:0.11.0
          args:
            - -nginx.scrape-uri=http://127.0.0.1/nginx_status
          ports:
            - containerPort: 9113
              name: metrics
      volumes:
        - name: nginx-config
          configMap:
            name: nginx-config
---
apiVersion: v1
kind: ConfigMap
metadata:
  namespace: default
  name: nginx-config
data:
  default.conf: |
    server {
        listen 80;
        server_name localhost;

        location / {
            root /usr/share/nginx/html;
            index index.html index.htm;
        }

        # nginx status endpoint for prometheus exporter
        location /nginx_status {
            stub_status on;
            access_log off;
            allow 127.0.0.1;
            deny all;
        }
    }
---
apiVersion: v1
kind: Service
metadata:
  namespace: default
  name: nginx-service
  labels:
    app.kubernetes.io/name: nginx
  annotations:
    prometheus.io/scrape: "true"
    prometheus.io/port: "9113"
    prometheus.io/path: "/metrics"
spec:
  selector:
    app.kubernetes.io/name: nginx
  ports:
    - name: http
      port: 80
      targetPort: 80
    - name: metrics
      port: 9113
      targetPort: 9113
  type: ClusterIP
下記のような状態になります。
% kubectl get all
NAME                         READY   STATUS    RESTARTS   AGE
pod/nginx-76bb4cbc58-8t85r   2/2     Running   0          2m58s

NAME                    TYPE        CLUSTER-IP      EXTERNAL-IP   PORT(S)           AGE
service/kubernetes      ClusterIP   172.20.0.1      <none>        443/TCP           23m
service/nginx-service   ClusterIP   172.20.135.51   <none>        80/TCP,9113/TCP   2m58s

NAME                    READY   UP-TO-DATE   AVAILABLE   AGE
deployment.apps/nginx   1/1     1            1           2m58s

NAME                               DESIRED   CURRENT   READY   AGE
replicaset.apps/nginx-76bb4cbc58   1         1         1       2m58s
Nginx の Pod の中に乗り込みます。
kubectl exec -it nginx-76bb4cbc58-8t85r -- /bin/bash
Service にリクエストをして、正常に動いていることを確認します。
root@nginx-76bb4cbc58-8t85r:/# curl -I http://nginx-service.default.svc.cluste
r.local
HTTP/1.1 200 OK
Server: nginx/1.29.2
Date: Thu, 23 Oct 2025 01:43:41 GMT
Content-Type: text/html
Content-Length: 615
Last-Modified: Tue, 07 Oct 2025 17:04:07 GMT
Connection: keep-alive
ETag: "68e54807-267"
Accept-Ranges: bytes
9113 番ポートから Prometheus 形式のメトリクスにアクセスできることも確認します。
root@nginx-76bb4cbc58-8t85r:/# curl http://nginx-service.default.svc.cluster.l
ocal:9113/metrics
# HELP nginx_connections_accepted Accepted client connections
# TYPE nginx_connections_accepted counter
nginx_connections_accepted 6
# HELP nginx_connections_active Active client connections
# TYPE nginx_connections_active gauge
nginx_connections_active 1
# HELP nginx_connections_handled Handled client connections
# TYPE nginx_connections_handled counter
nginx_connections_handled 6
# HELP nginx_connections_reading Connections where NGINX is reading the request header
# TYPE nginx_connections_reading gauge
nginx_connections_reading 0
# HELP nginx_connections_waiting Idle client connections
# TYPE nginx_connections_waiting gauge
nginx_connections_waiting 0
# HELP nginx_connections_writing Connections where NGINX is writing the response back to the client
# TYPE nginx_connections_writing gauge
nginx_connections_writing 1
# HELP nginx_http_requests_total Total http requests
# TYPE nginx_http_requests_total counter
nginx_http_requests_total 7
# HELP nginx_up Status of the last metric scrape
# TYPE nginx_up gauge
nginx_up 1
# HELP nginxexporter_build_info Exporter build information
# TYPE nginxexporter_build_info gauge
nginxexporter_build_info{arch="linux/amd64",commit="e4a6810d4f0b776f7fde37fea1d84e4c7284b72a",date="2022-09-07T21:09:51Z",dirty="false",go="go1.19",version="0.11.0"} 1
マネージドコレクターのスクレイパーを作成
マネジメントコンソールからスクレイパーを作成します。
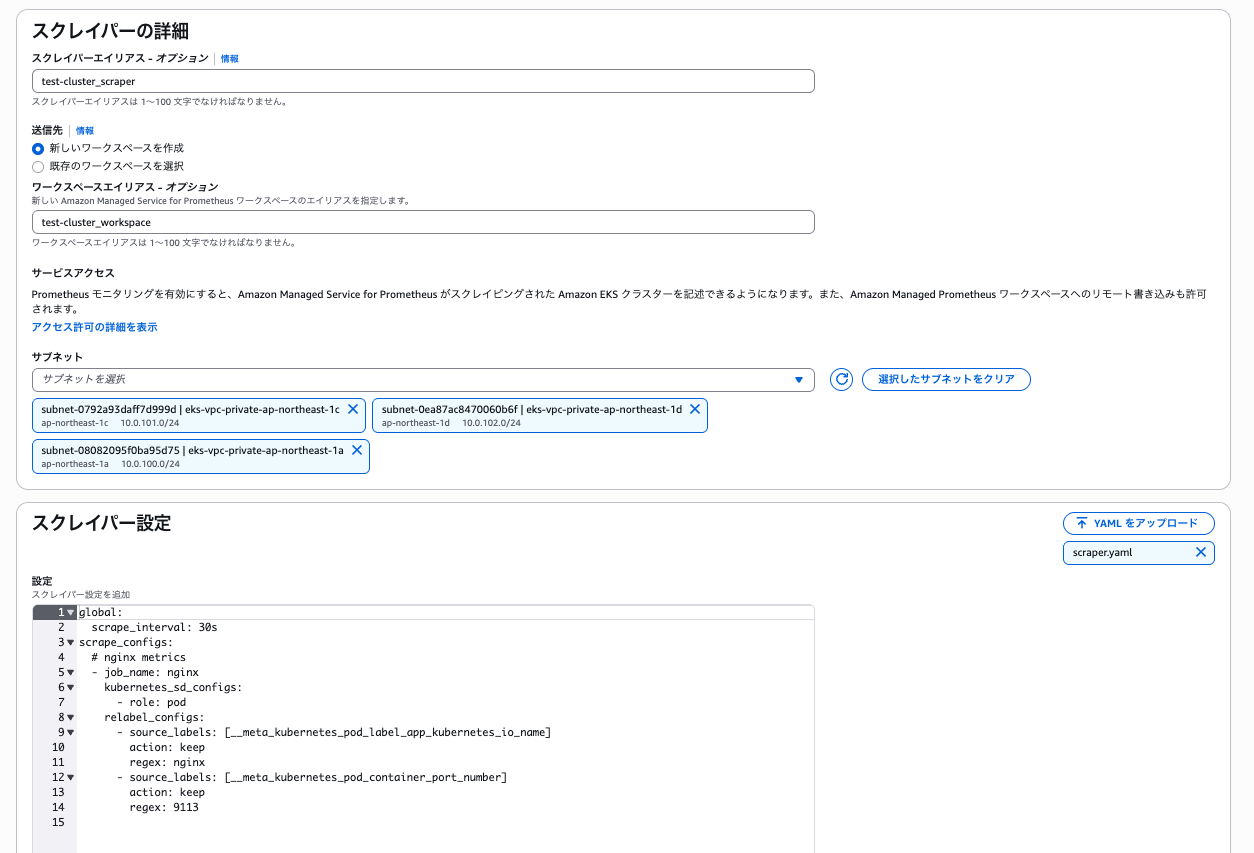
スクレイパー設定は下記として、Nginx Prometheus Exporter からメトリクスを取得します。
global:
  scrape_interval: 30s
scrape_configs:
  # nginx metrics
  - job_name: nginx
    kubernetes_sd_configs:
      - role: pod
    relabel_configs:
      - source_labels: [__meta_kubernetes_pod_label_app_kubernetes_io_name]
        action: keep
        regex: nginx
      - source_labels: [__meta_kubernetes_pod_container_port_number]
        action: keep
        regex: 9113
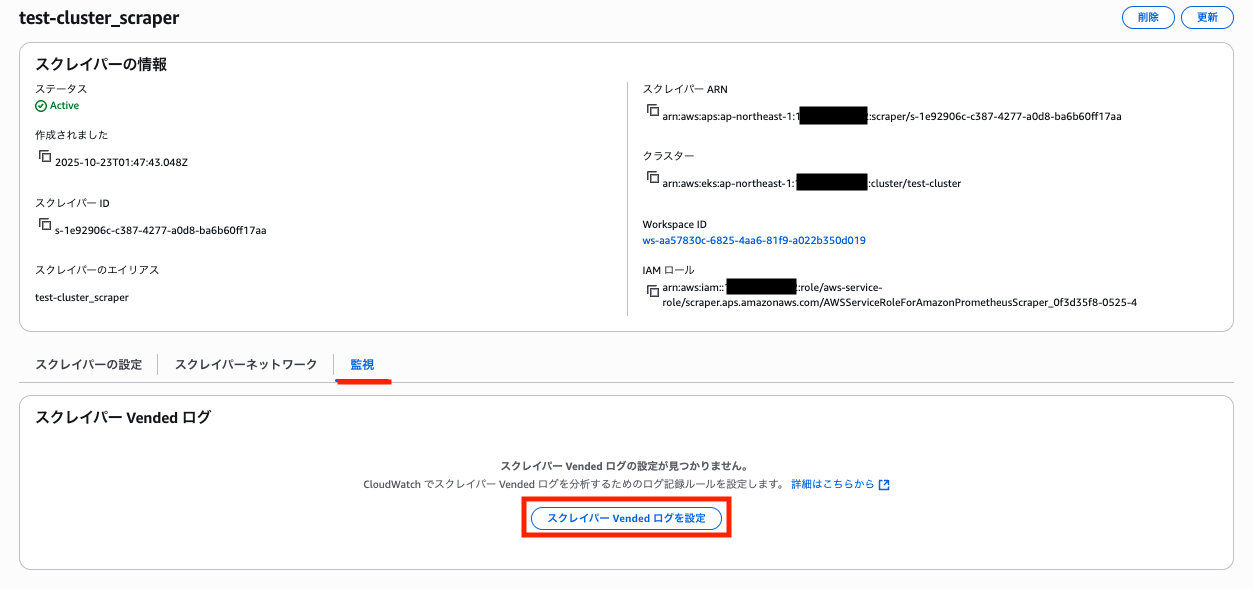
スクレイパー作成時にログを有効化することはできず、スクレイパー詳細の「監視」タブから設定します。
スクレイパー作成完了まで 20 分程度待ってから、ログ設定を行います。
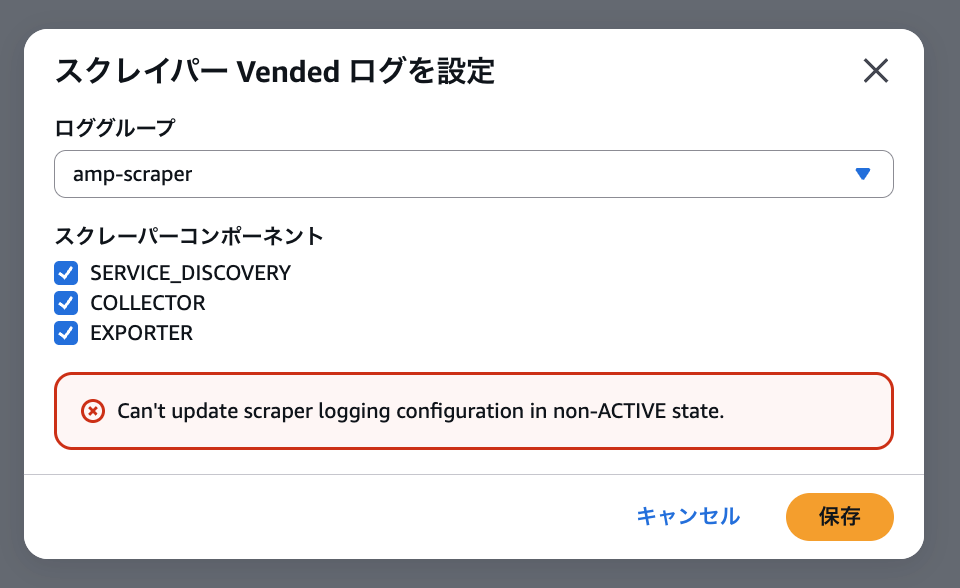
必要なログを選択して「保存」をクリックします。
この際、CloudWatch ロググループは事前に作成しておく必要があります。
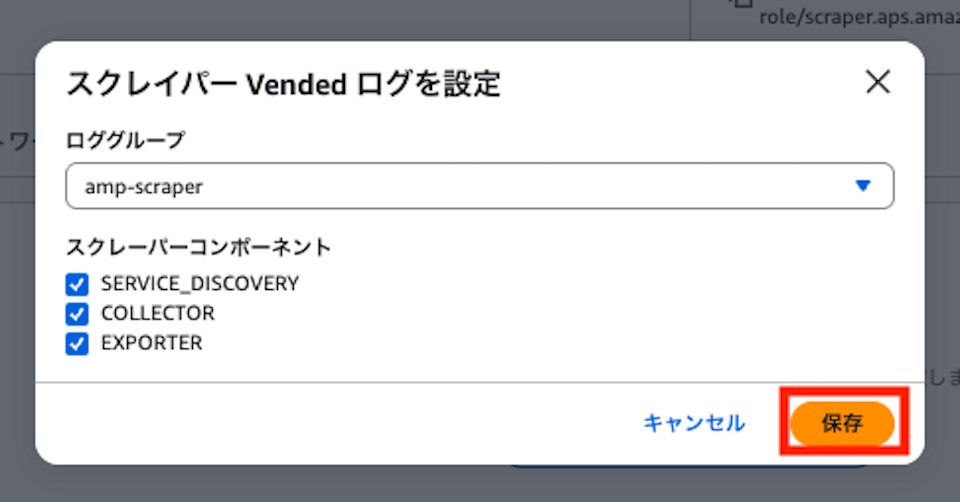
また、スクレイパーは事前に ACTIVE 状態になっている必要があります。
スクレイパー作成自体のトラブルシューティングには利用できないので、そもそもスクレイパーの作成に失敗してしまう場合は CloudTrail に記録されている CreateScraper アクションなどを見ると良いと思います。
    "responseElements": {
        "reason": "Validation error",
        "Access-Control-Expose-Headers": "x-amzn-errortype,x-amzn-requestid,x-amzn-trace-id,x-amzn-errormessage,x-amz-apigw-id,date",
        "message": "Invalid source.eksConfiguration.subnetIds: Member must satisfy constraint: [Member must have length less than or equal to 255, Member must have length greater than or equal to 0, Member must satisfy regular expression pattern: subnet-[0-9a-z]+]",
        "fieldList": [
            {
                "message": "Member must satisfy constraint: [Member must have length less than or equal to 255, Member must have length greater than or equal to 0, Member must satisfy regular expression pattern: subnet-[0-9a-z]+]",
                "name": "source.eksConfiguration.subnetIds"
            }
        ]
    },
ログを確認してみる
ApsCollector/<Scraper ID> の形式でログストリームが作成されるようです。
まず、Node のセキュリティグループで 9113 番ポートへの Ingress 通信を閉じてみました(node_security_group_additional_rules の定義を削除)。
すると、下記のようにスクレイピングできない旨のエラーが出力されました。
個別のスクレイピング対象に問題がある場合は、COLLECTOR ログとして出力されます。
{
  "component": "COLLECTOR",
  "message": {
    "log": "Failed to scrape Prometheus endpoint - verify /metrics endpoint is available",
    "job": "nginx",
    "targetLabels": "{__name__=\"up\", instance=\"10.0.101.167:9113\", job=\"nginx\"}"
  },
  "timestamp": "1761194018152",
  "scraperId": "s-1e92906c-c387-4277-a0d8-ba6b60ff17aa"
}
security_group_additional_rules を削除して Kube API Server へアクセスできない状態でスクレイパーを作り直すと、SERVICE_DISCOVERY ログを確認できました。
SERVICE_DISCOVERY ログが出力された場合は、そもそもスクレイピングの条件を満たしている EKS クラスターが無いことを疑うと良いでしょう。
{
  "component": "SERVICE_DISCOVERY",
  "message": {
    "log": "Failed to watch Service - Verify your scraper source exists."
  },
  "timestamp": "1761193199552",
  "scraperId": "s-1e92906c-c387-4277-a0d8-ba6b60ff17aa"
}
あまり無い状況な気はしますが、AMP WorkSpace 自体を消すと EXPORTER ログが出力されました。
スクレイピングはできるが AMP Workspace にエクスポートできない場合にこの種類のログが出力されるようです。
{
  "component": "EXPORTER",
  "message": {
    "log": "Failed to export to the target workspace - Verify your scraper destination.",
    "samplesDropped": 14
  },
  "timestamp": "1761194608381",
  "scraperId": "s-1e92906c-c387-4277-a0d8-ba6b60ff17aa"
}
最後に
AMP マネージドコレクターは魅力的な機能ではあるものの、ブラックボックスな部分が多くて扱い辛いなと思っていました。
今回のアップデートで大分扱いやすくなったので、EKS で Prometheus を扱う際はマネージドコレクターの利用も是非検討みてはいかがでしょうか?