Container InsightsでECSクラスターについてCloudWatch Application Insightsを設定した場合にどのようなCloudWatchアラームが設定されるのか確認してみた
ECSでCloudWatch Application Insightsを設定した場合にどのようなCloudWatchアラームが設定されるのか確認したい
こんにちは、のんピ(@non____97)です。
皆さんはECSでCloudWatch Application Insightsを設定した場合にどのようなCloudWatchアラームが設定されるのか確認したいなと思ったことはありますか? 私はあります。
以下記事で紹介されているとおり、Container InsightsのコンソールからCloudWatch Application Insightsを簡単に有効化することが可能です。
Application Insightsを設定することで簡単にアプリケーションのダッシュボードやアラームを設定および、イベント管理をすることが可能です。
では、どのようなアラームが設定されるのでしょうか。ドキュメントを探してもどのようなアラームが設定されるのかの記載はありませんでした。実際に確認してみました。
いきなりまとめ
- ECSでCloudWatch Application Insightsを設定した場合にどのようなCloudWatch Alarmが設定される
- ALBの
HTTPCode_Target_4XX_Count - ALBの
HTTPCode_Target_5XX_Count - ECSクラスターの
MemoryUtilized - ECSクラスターの
CpuUtilized
- ALBの
やってみた
検証環境
検証環境は以下のとおりです。
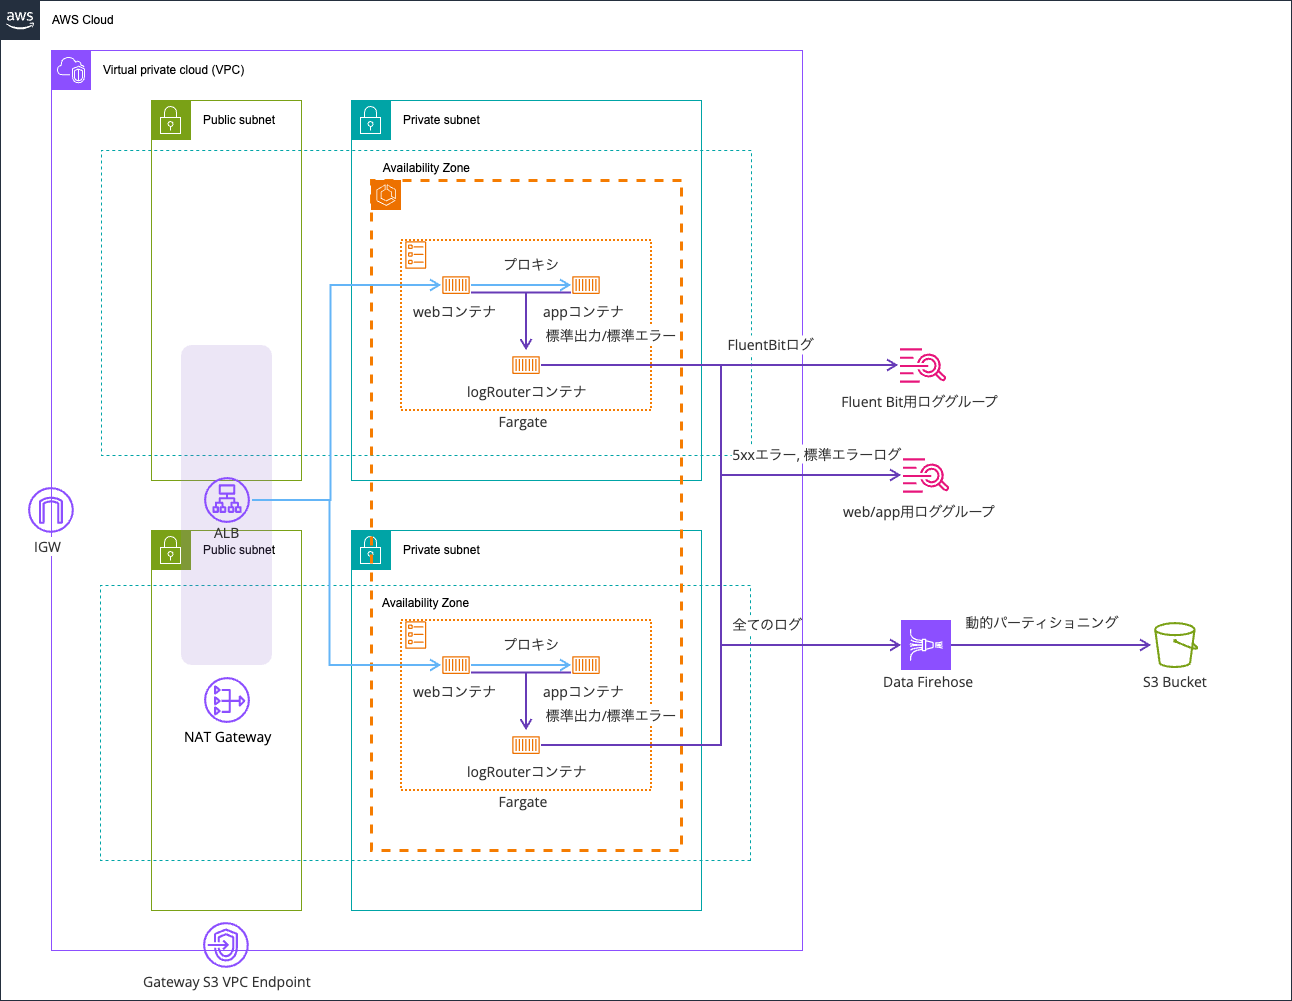
以下記事で使用したものを流用します。
コードは以下リポジトリに保存しています。
CloudWatch Application Insightsの有効化
Application Insightsの有効化を行います。
有効化はContainer Insightsのコンソールから行います。
Application Insightsタブを確認するとアプリケーションのモニタリングが正常に有効になりました。結果が表示されるまでにはしばらく時間がかかります。結果を表示するには、更新ボタンを使用してください。と表示されていました。
Application Insightsを自動設定をクリックし、有効化します。
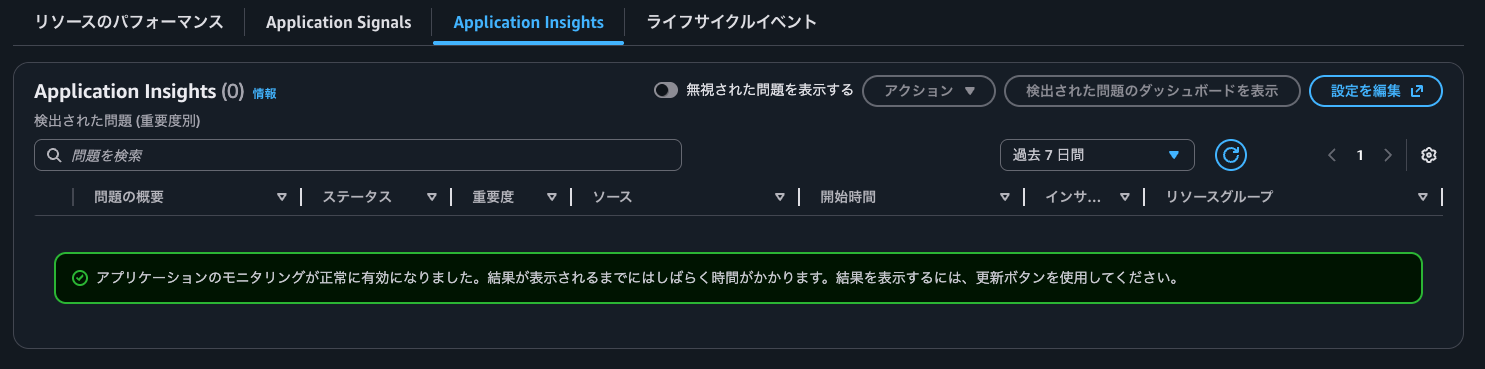
有効化がされたようです。
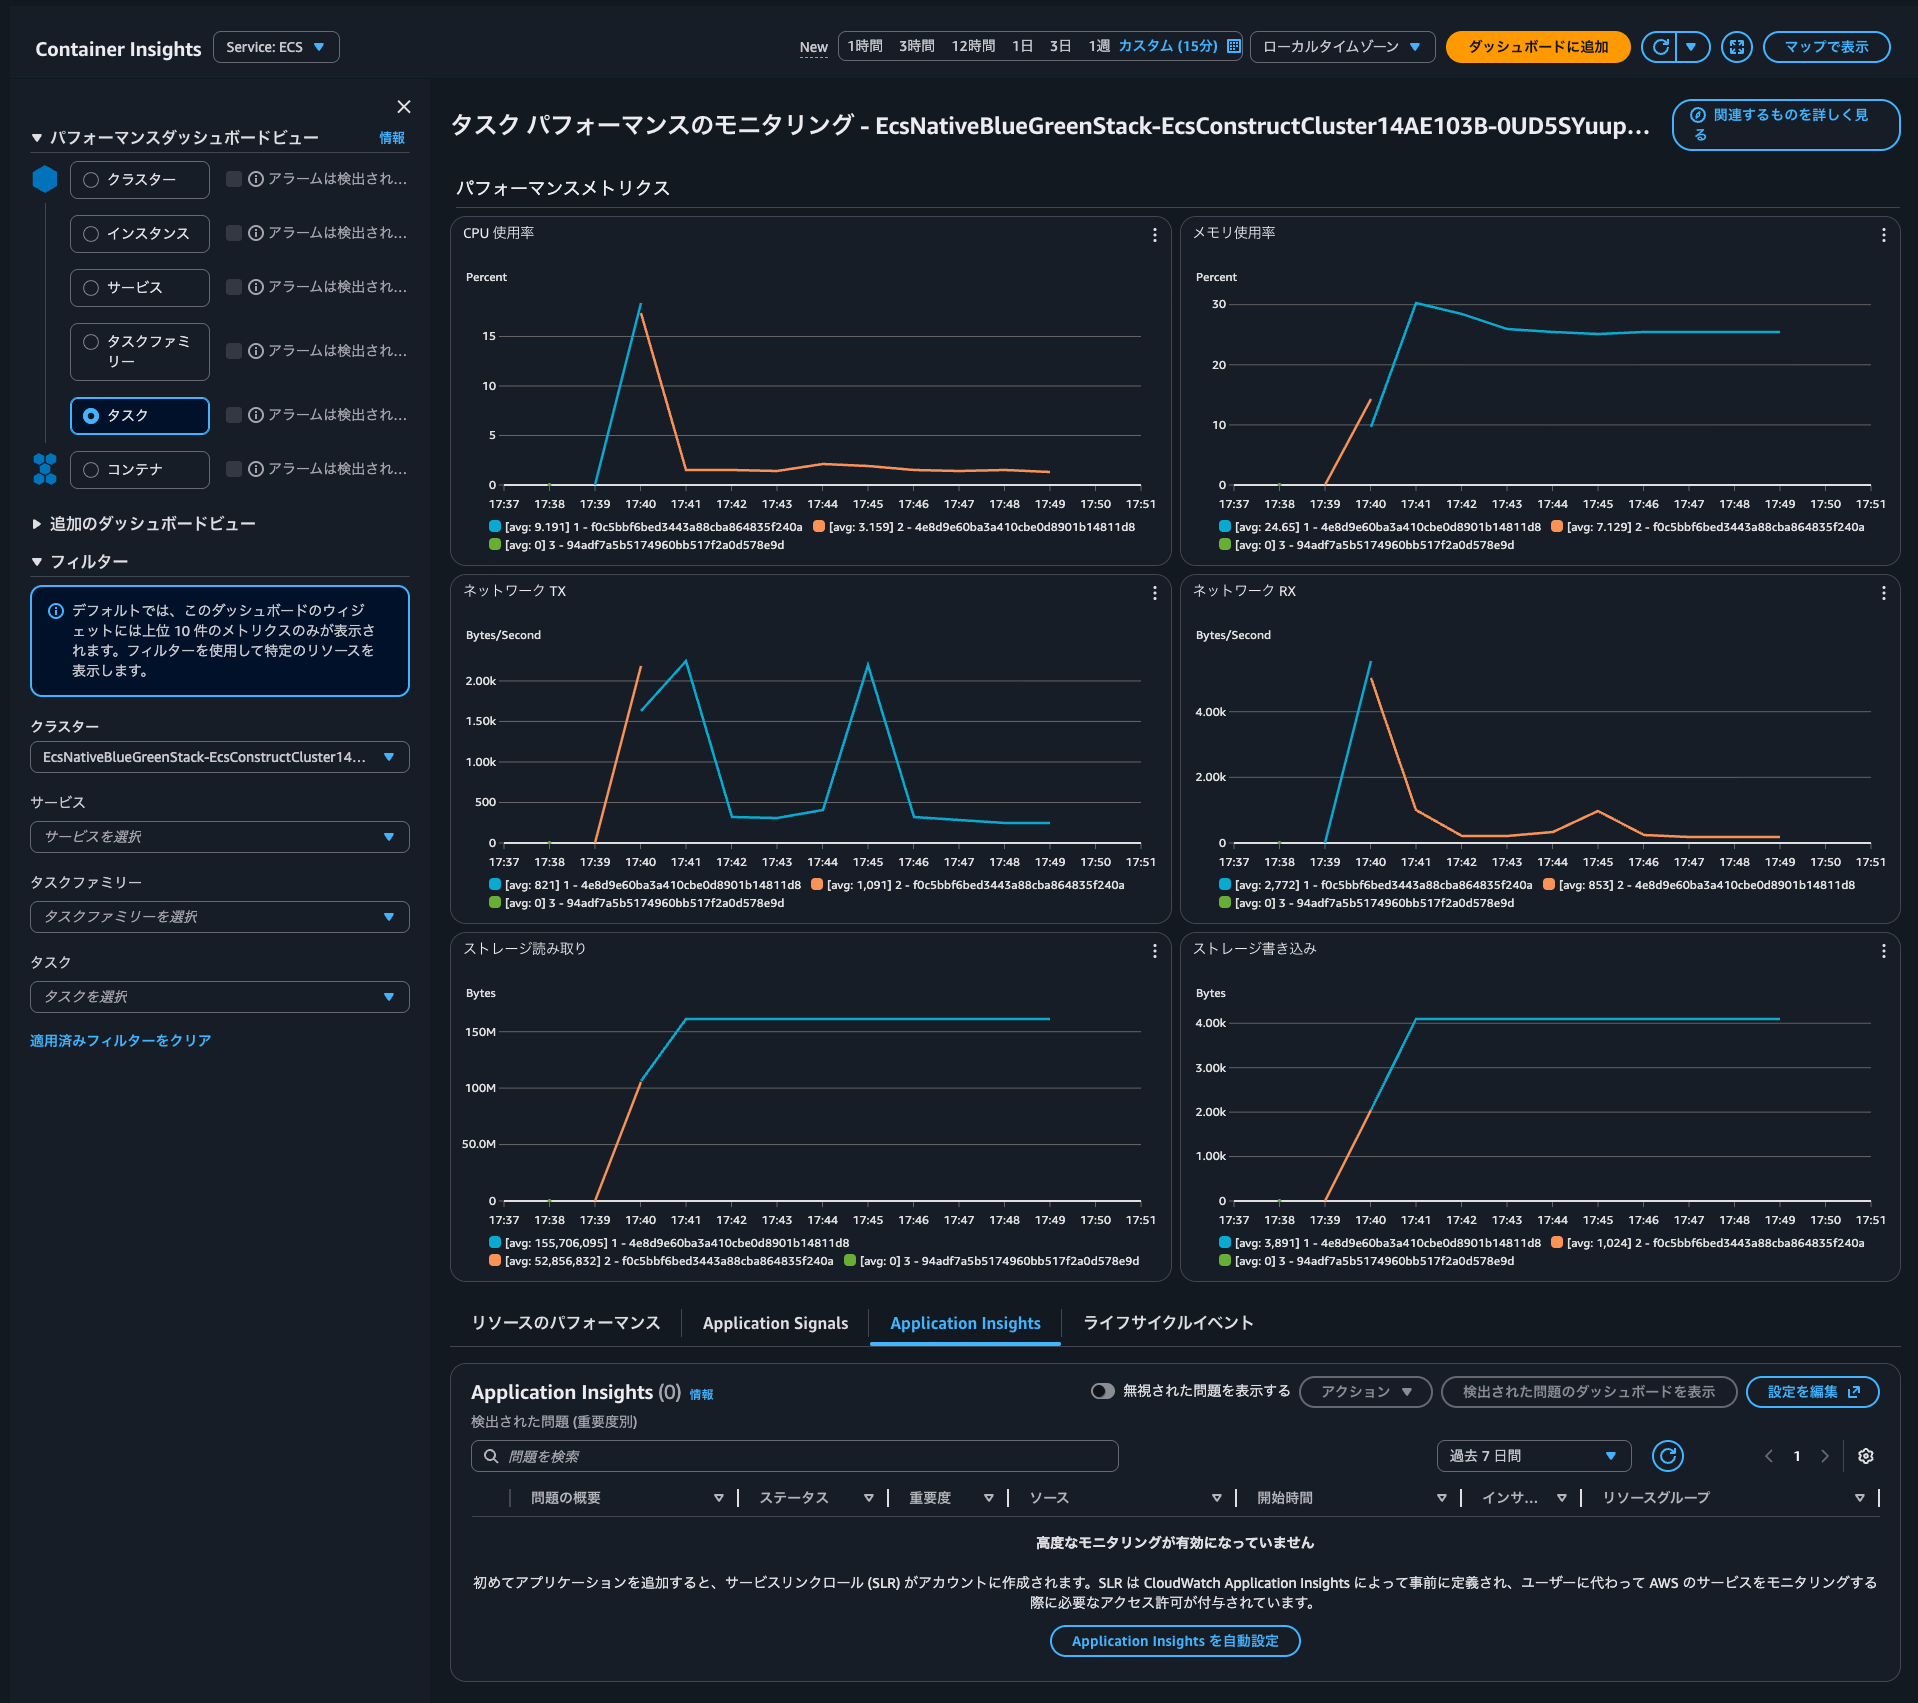
Application Insightsのダッシュボードの確認
しばらくすると、以下のように発生した問題を確認できました。バックエンド返した4XXエラーについてのようです。
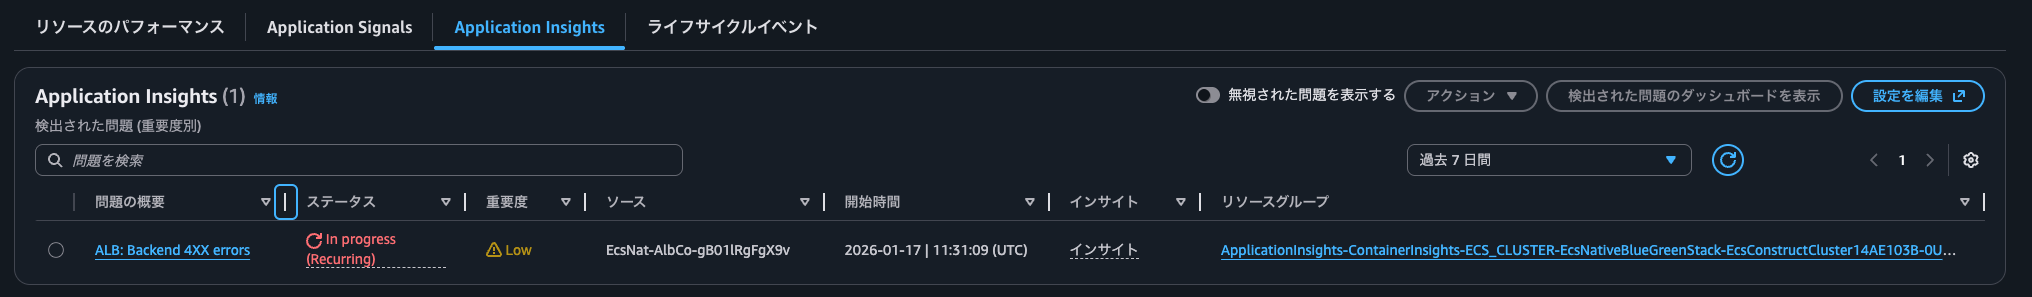
Application Insightsのコンソールを確認すると、同様の内容を確認できました。
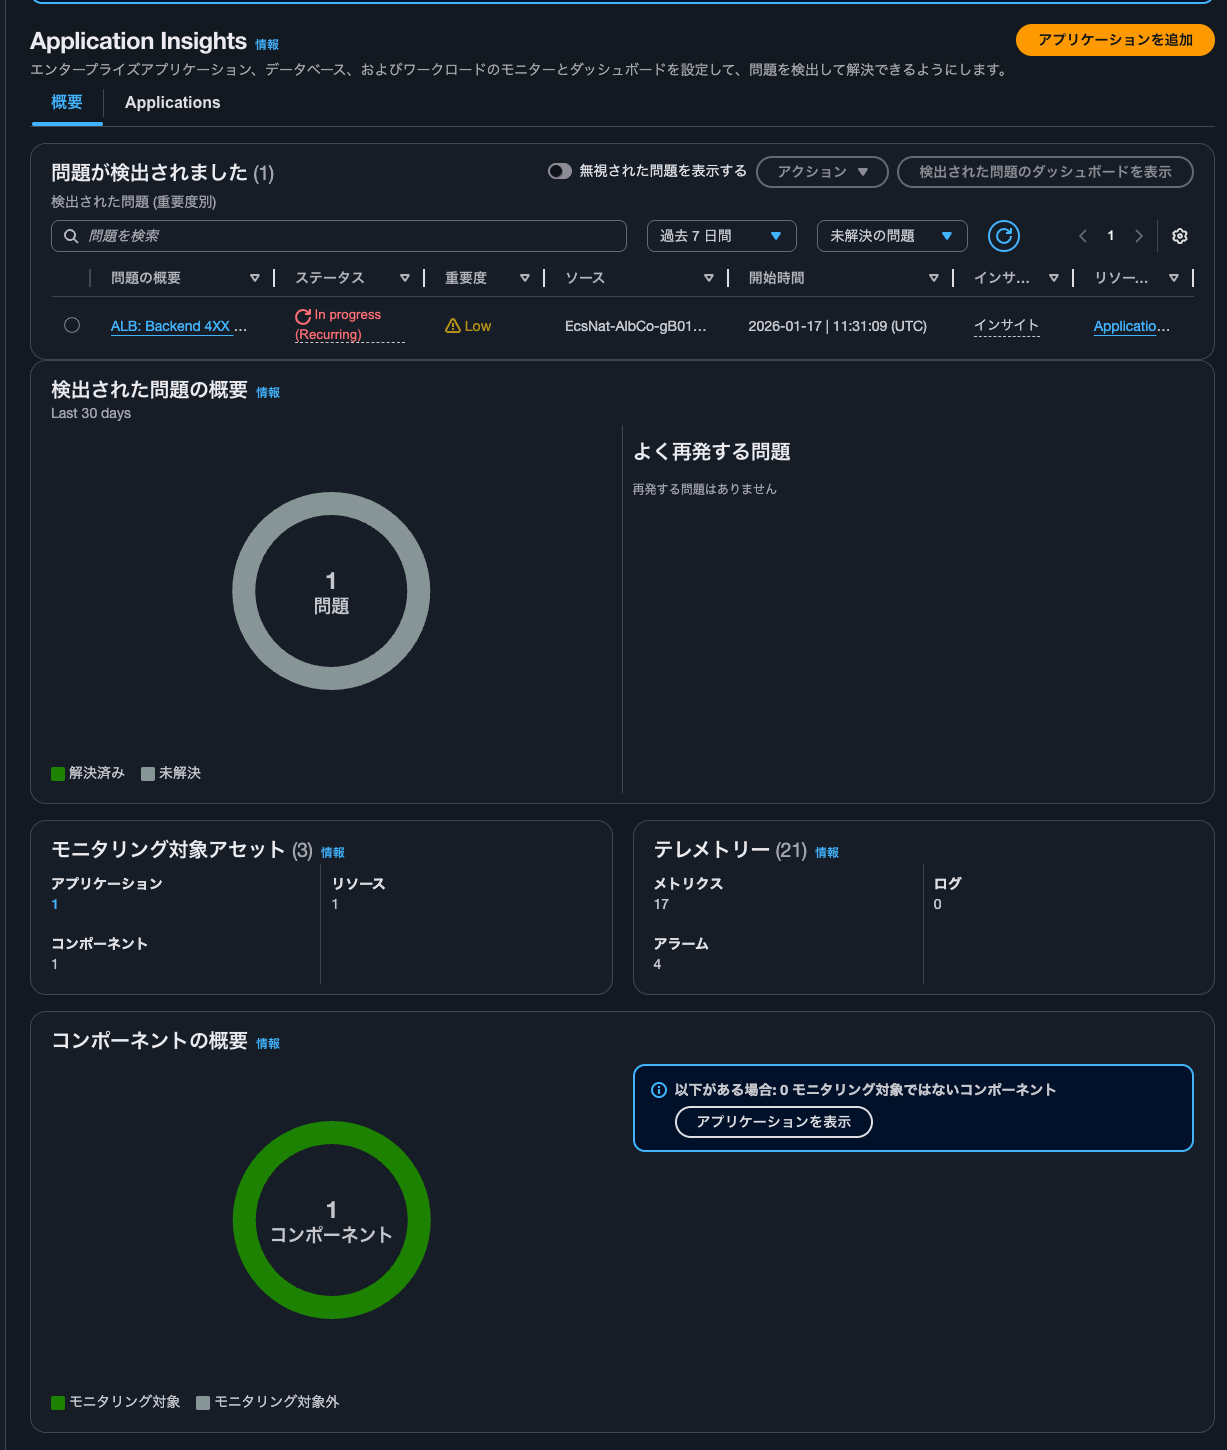
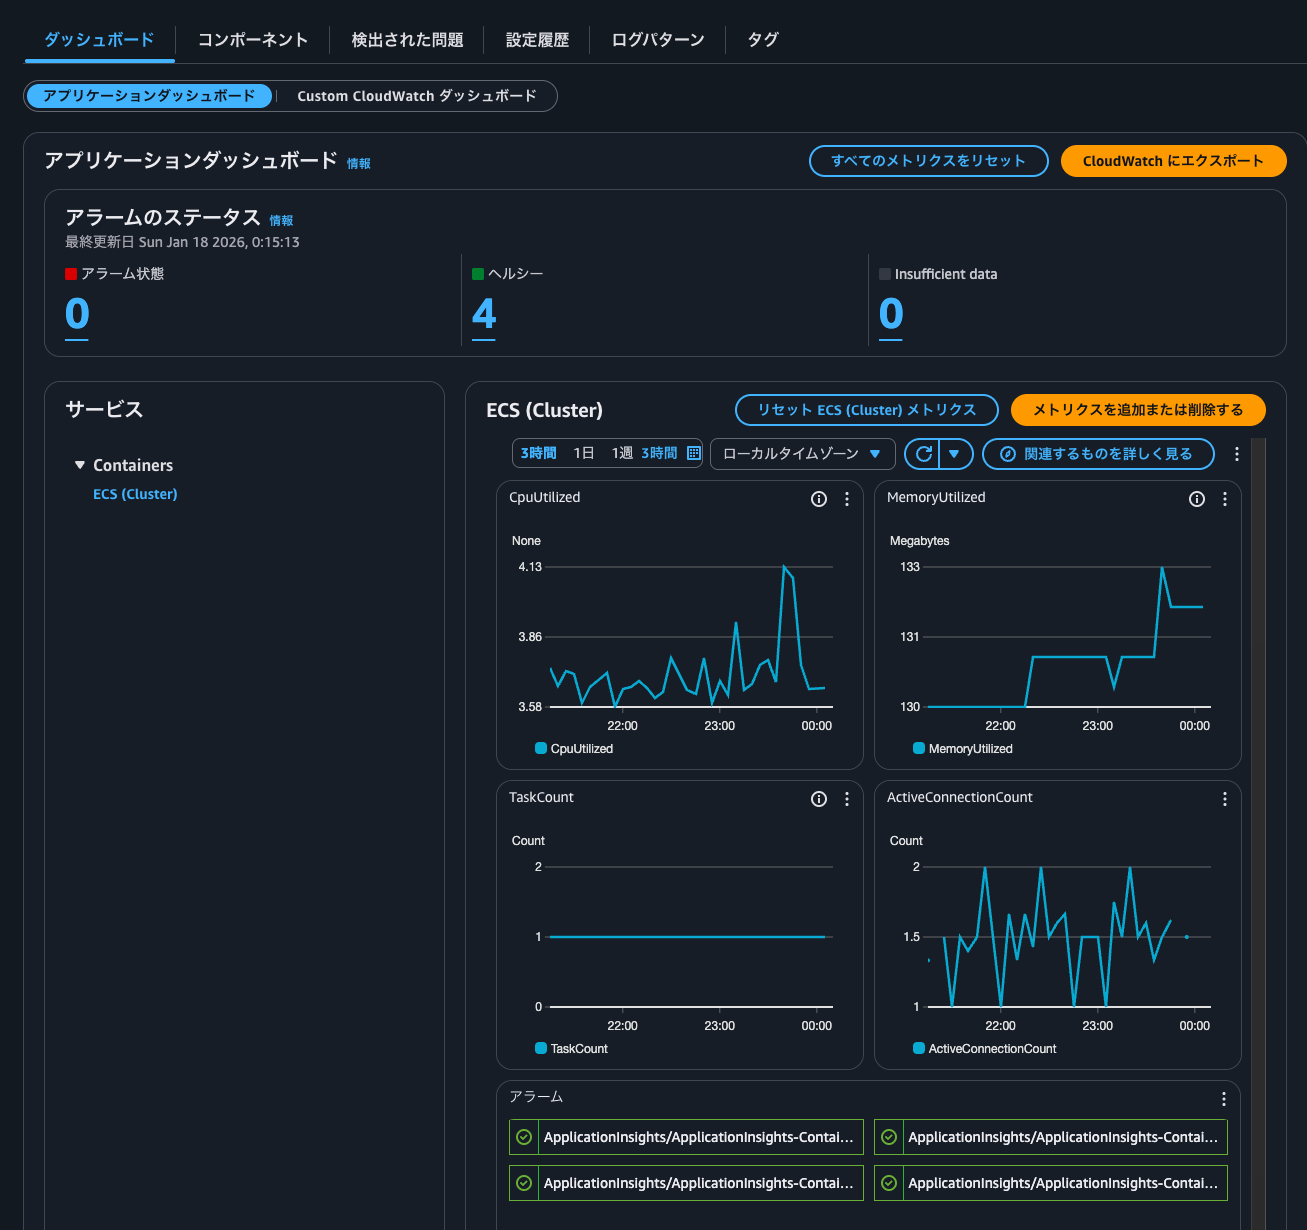
Applicationsからアプリケーションを選択すると、以下のようにApplication Insightsのダッシュボードを確認できました。
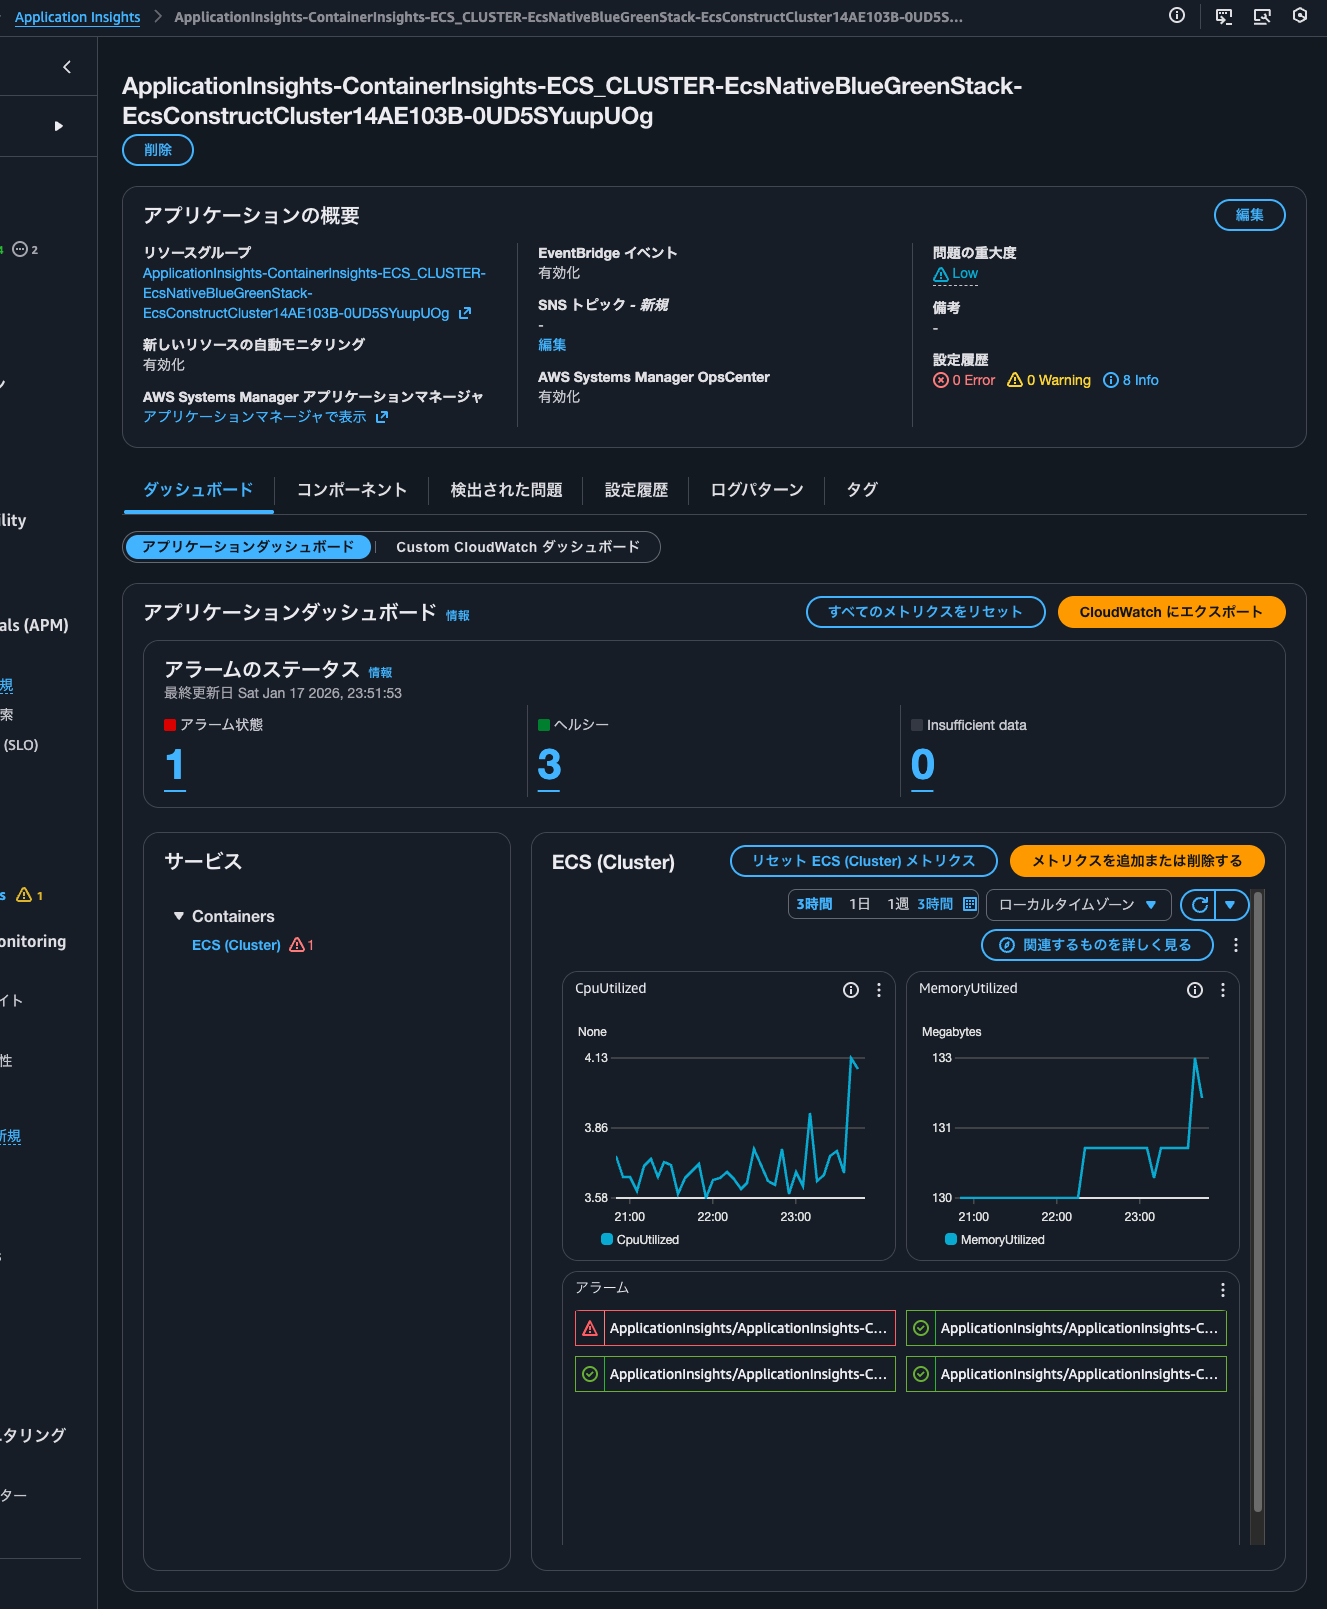
4つほどのアラームが設定されており、1つがアラーム状態になっていることが分かります。
ダッシュボードはCPUとメモリ使用率のメトリクスになっていますね。
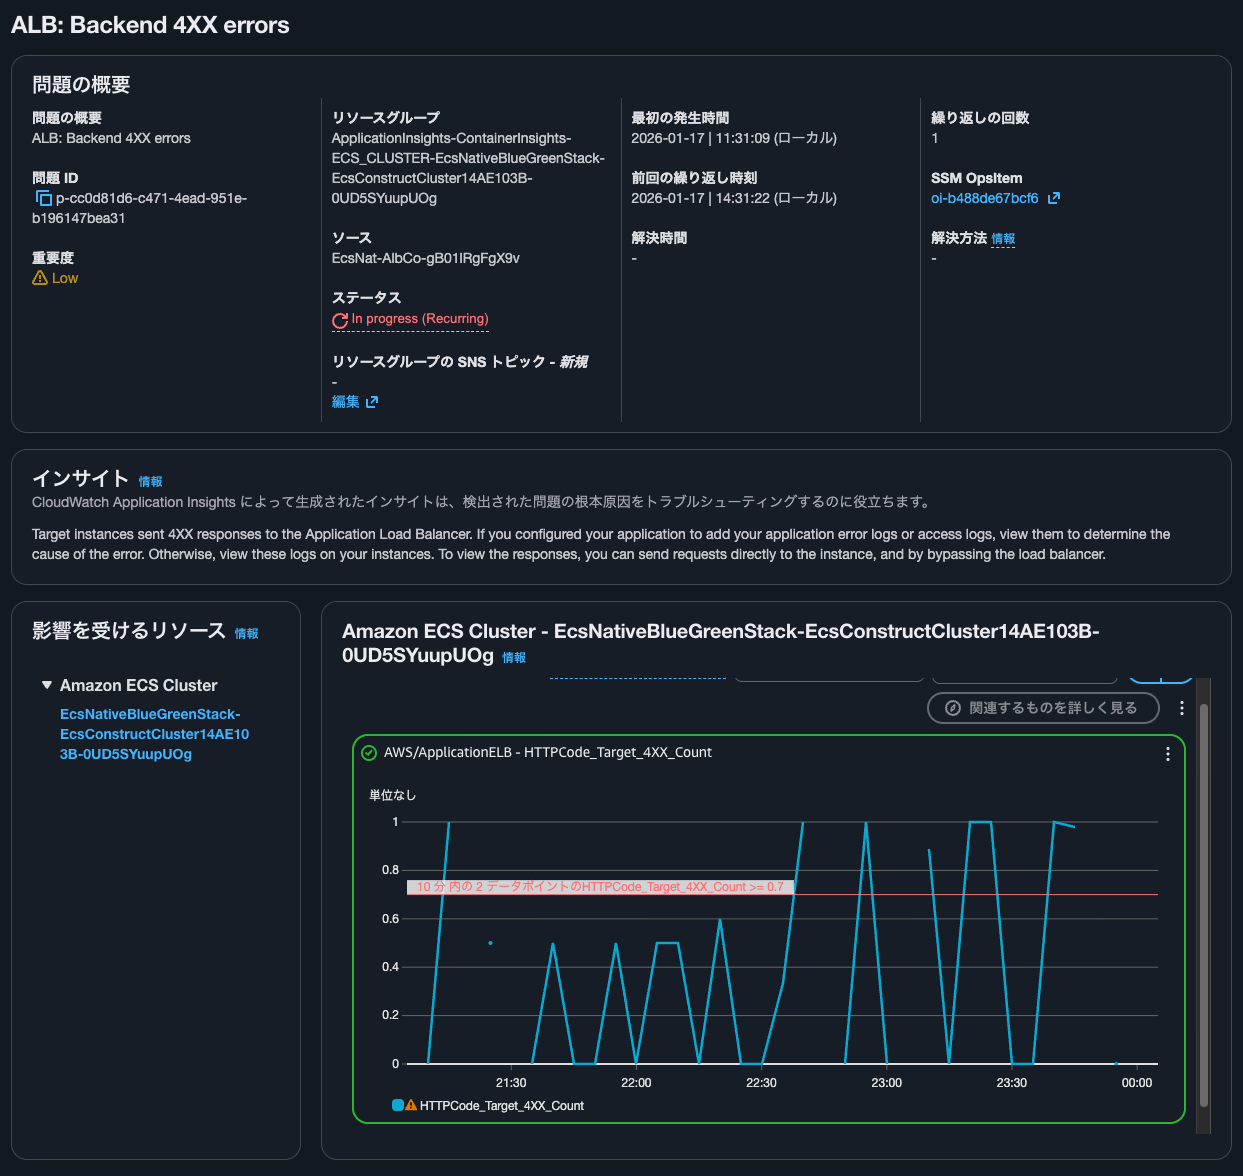
Container InsightsのALB: Backend 4XX errorsのリンクをクリックすると、以下のような画面になりました。
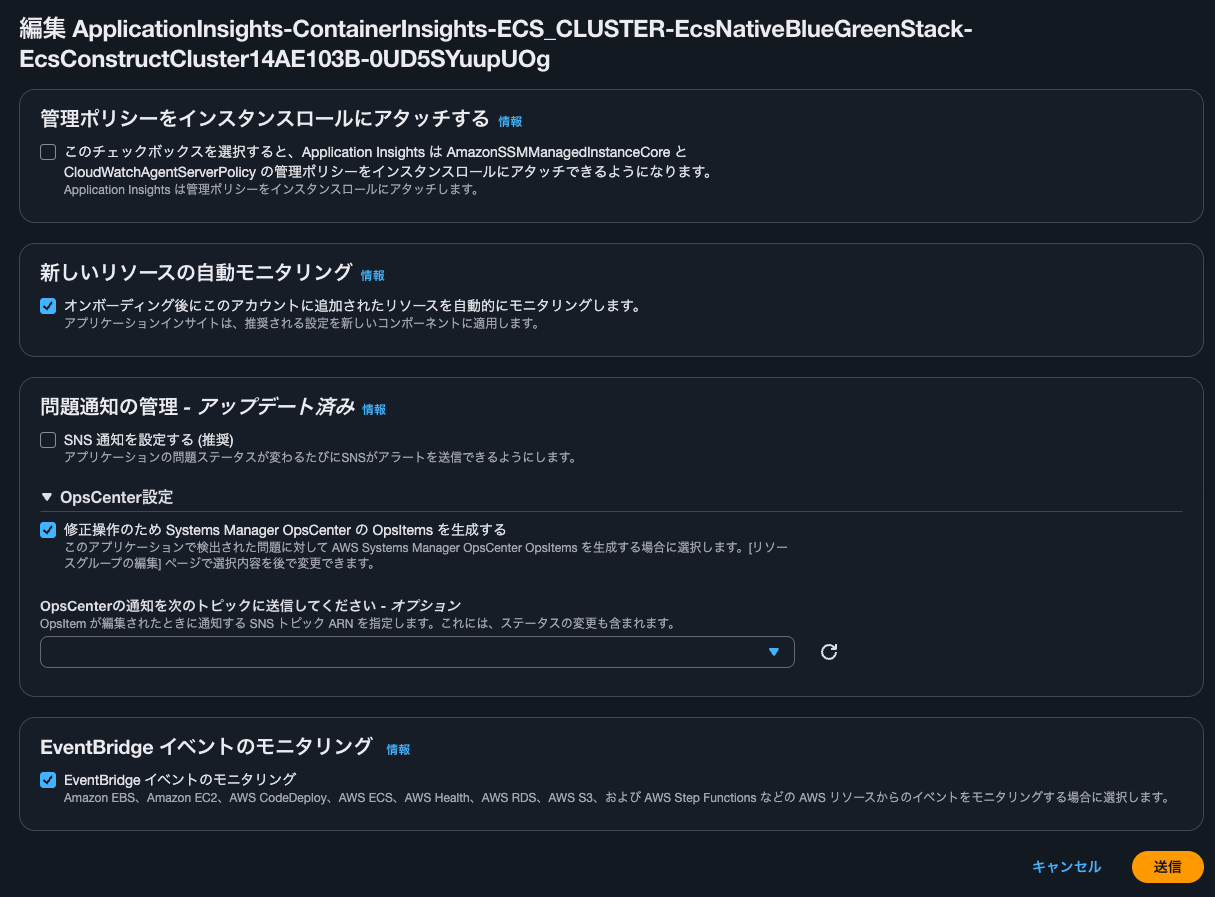
参考までに編集をクリックすると以下のような画面になります。
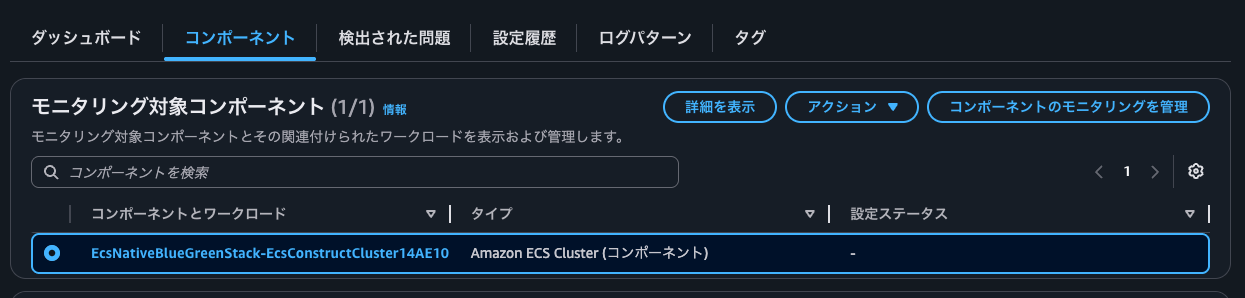
コンポーネントの確認
コンポーネントの確認をします。
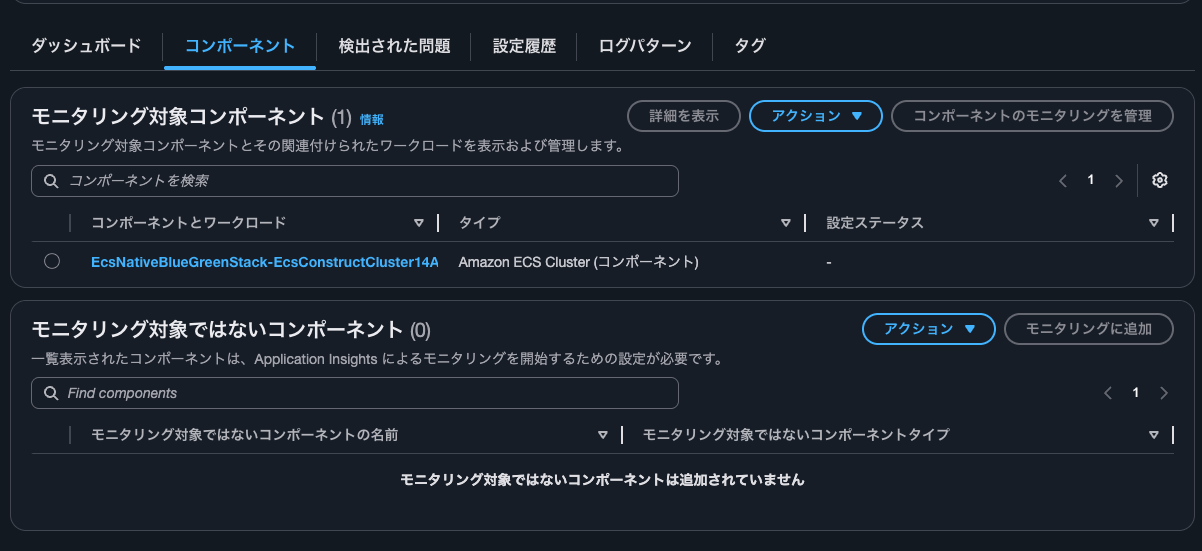
タイプはECSクラスターのようです。コンポーネントとワークロードのリンクをクリックします。
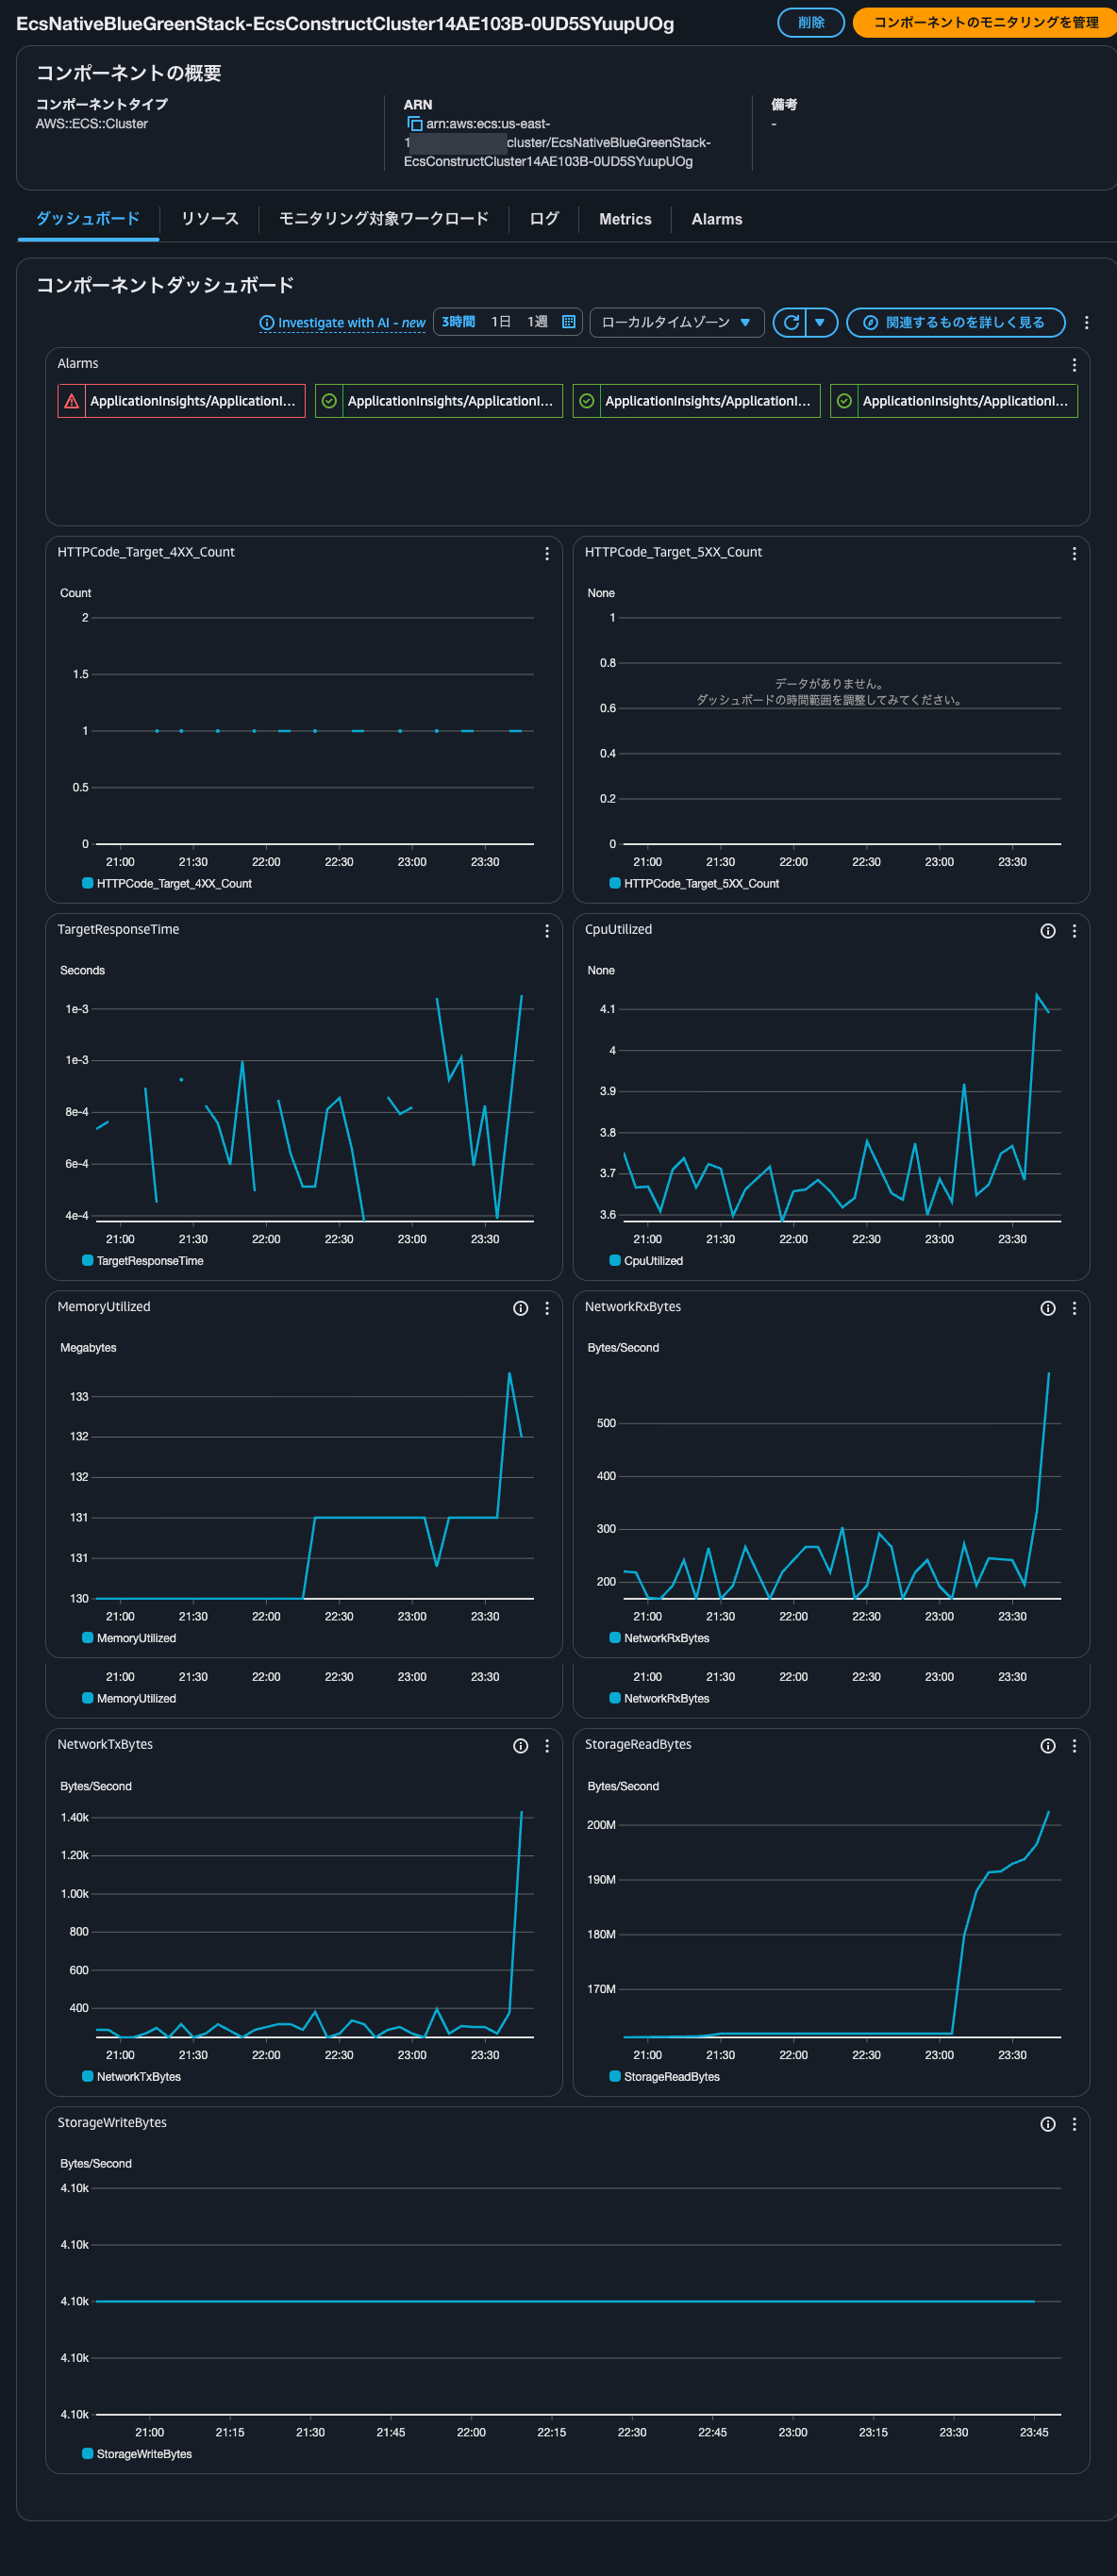
以下のようにダッシュボードが確認できました。
リソースタブをクリックします。ECSサービスがリソースとして登録されているようです。
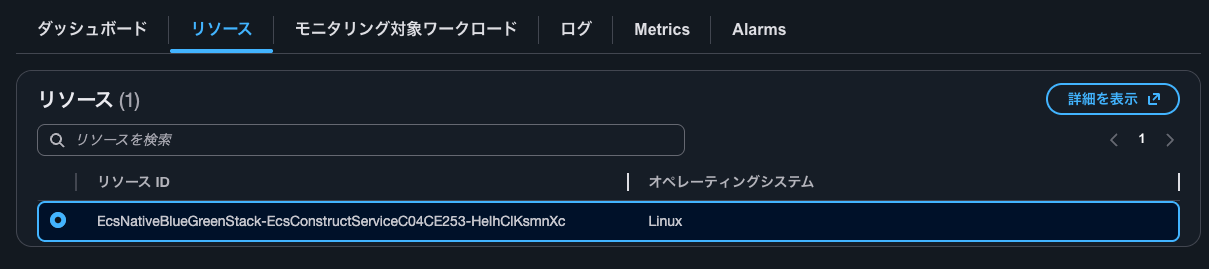
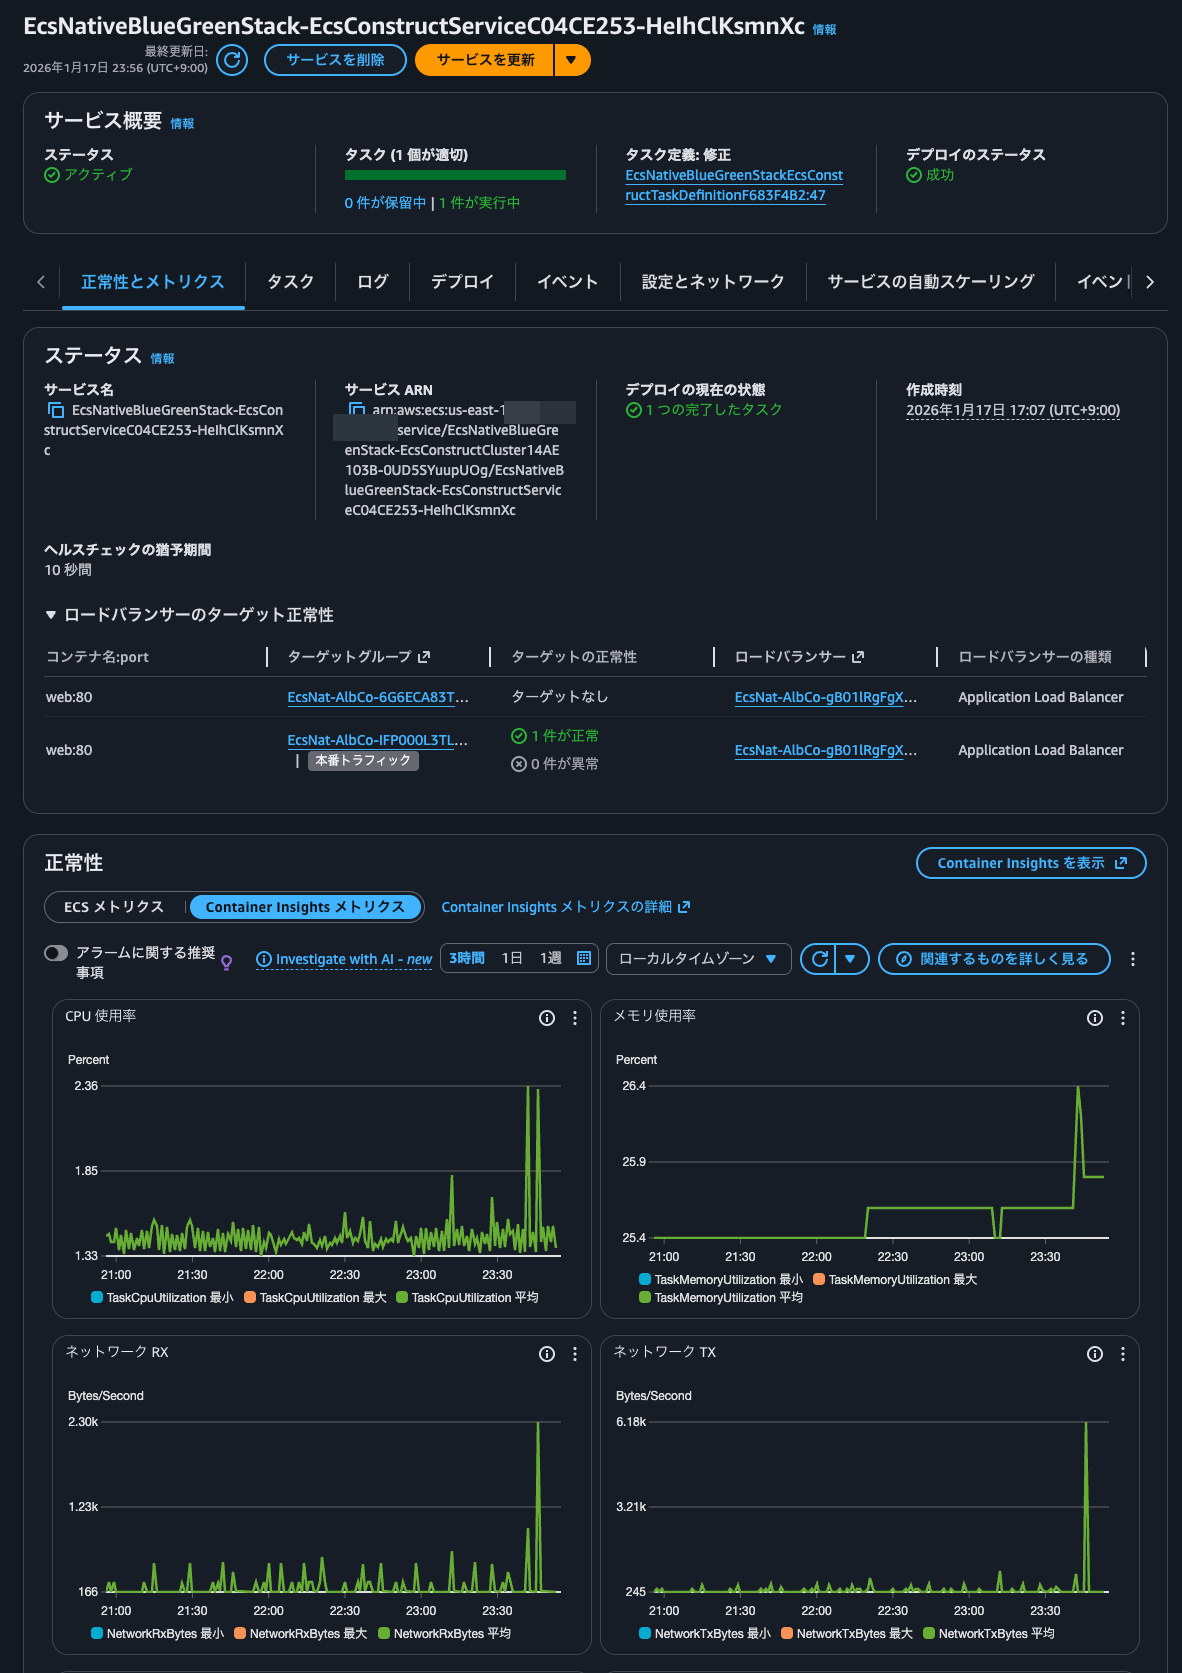
選択して詳細を表示をクリックすると、ECSサービスが表示されていました。
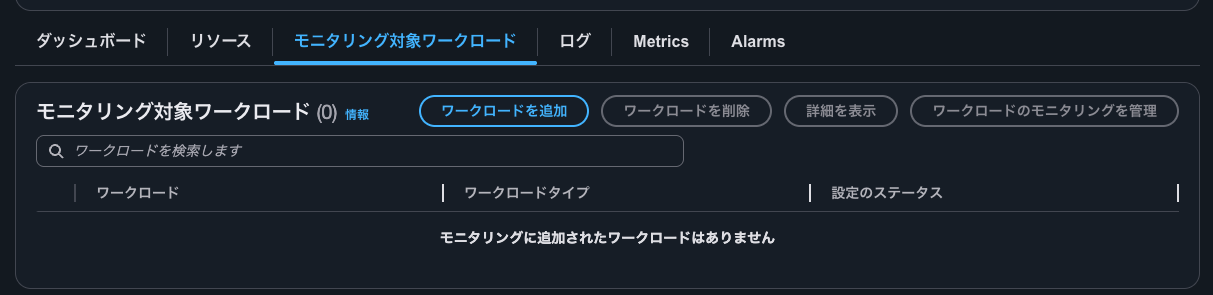
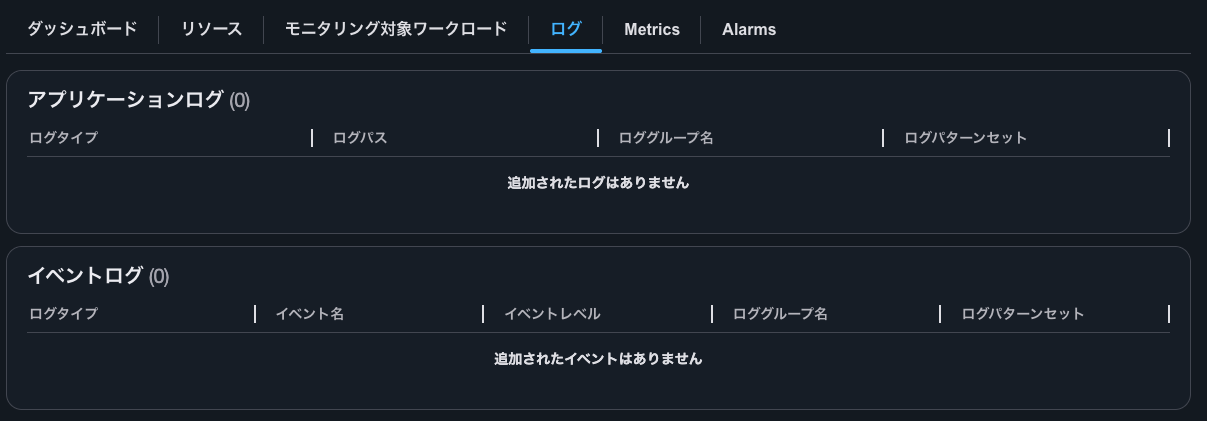
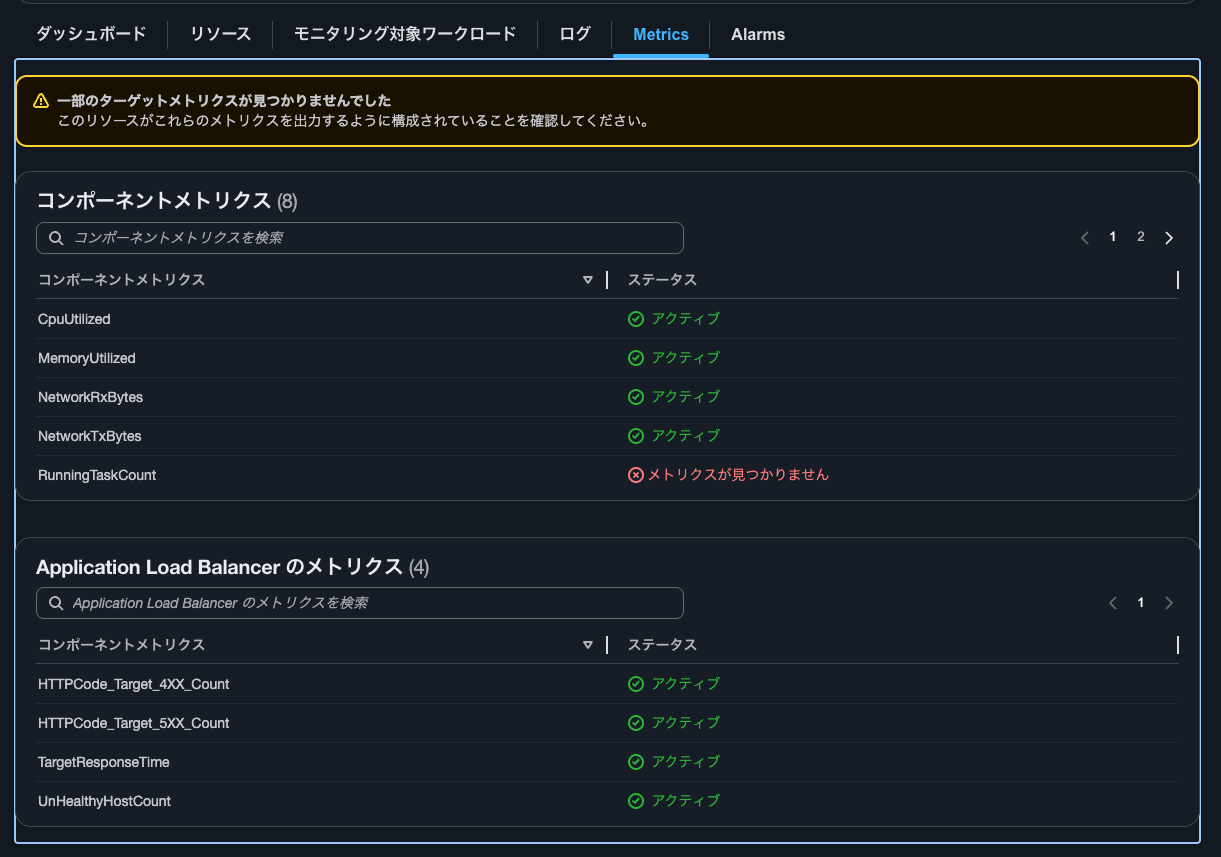
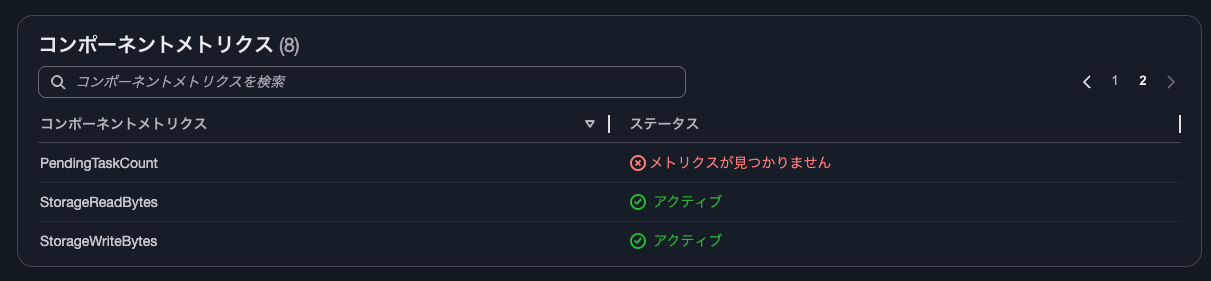
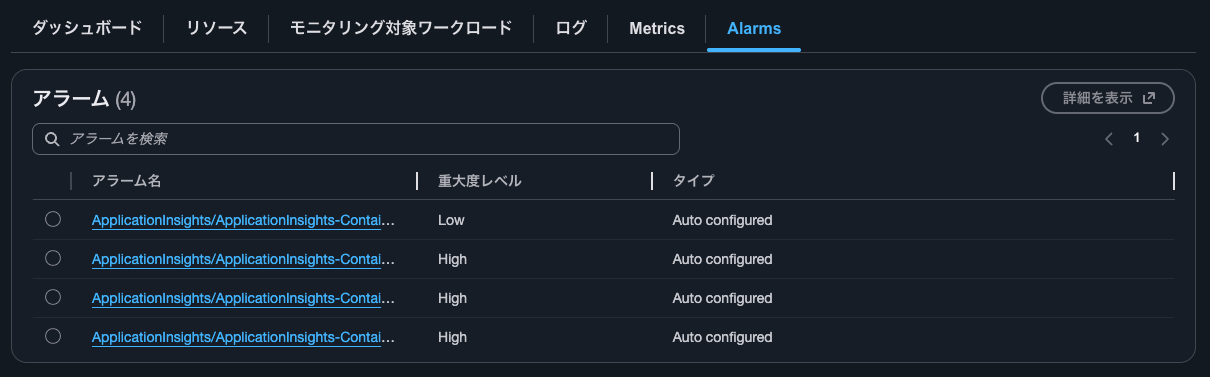
モニタリング対象ワークロードタブやログタブ、Metricsタブ、Alarmsタブは以下のとおりです。
コンポーネントのモニタリングの管理
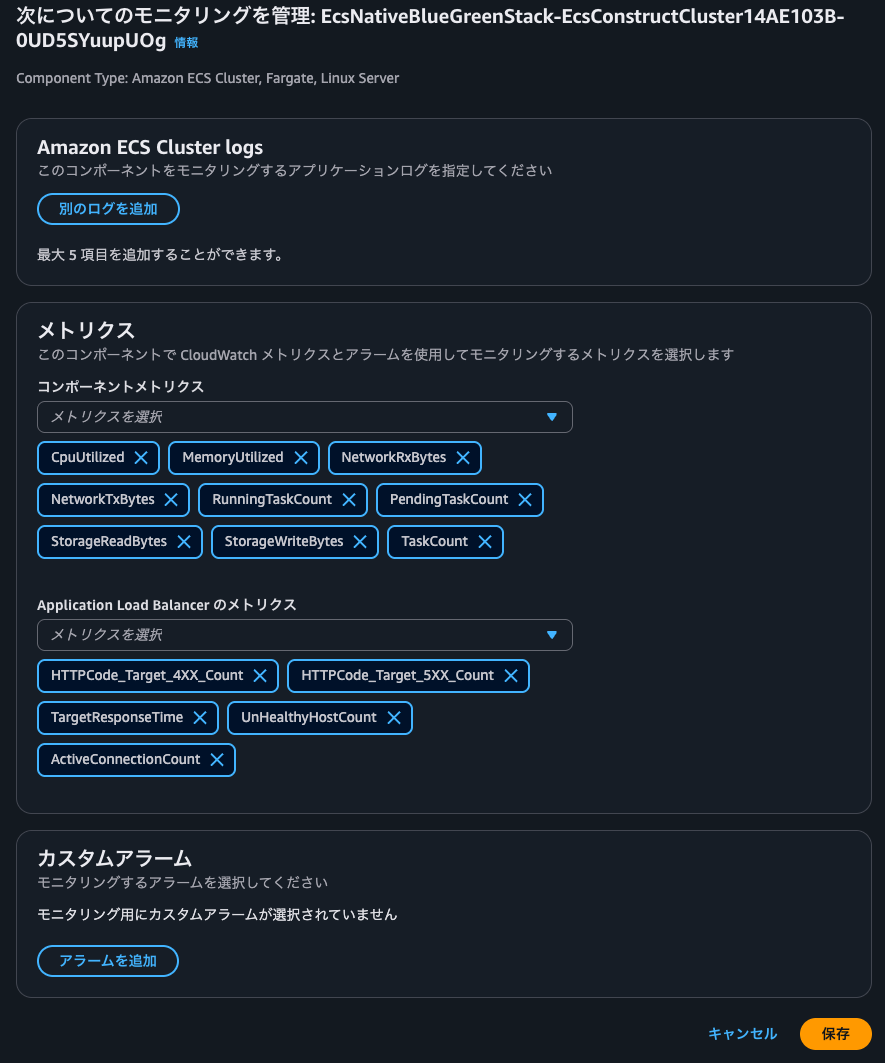
コンポーネントのモニタリングで扱うメトリクスを編集します。コンポーネントのモニタリングを管理をクリックします。
以下のようにモニタリングするメトリクスの管理やカスタムアラームを設定できる画面になりました。
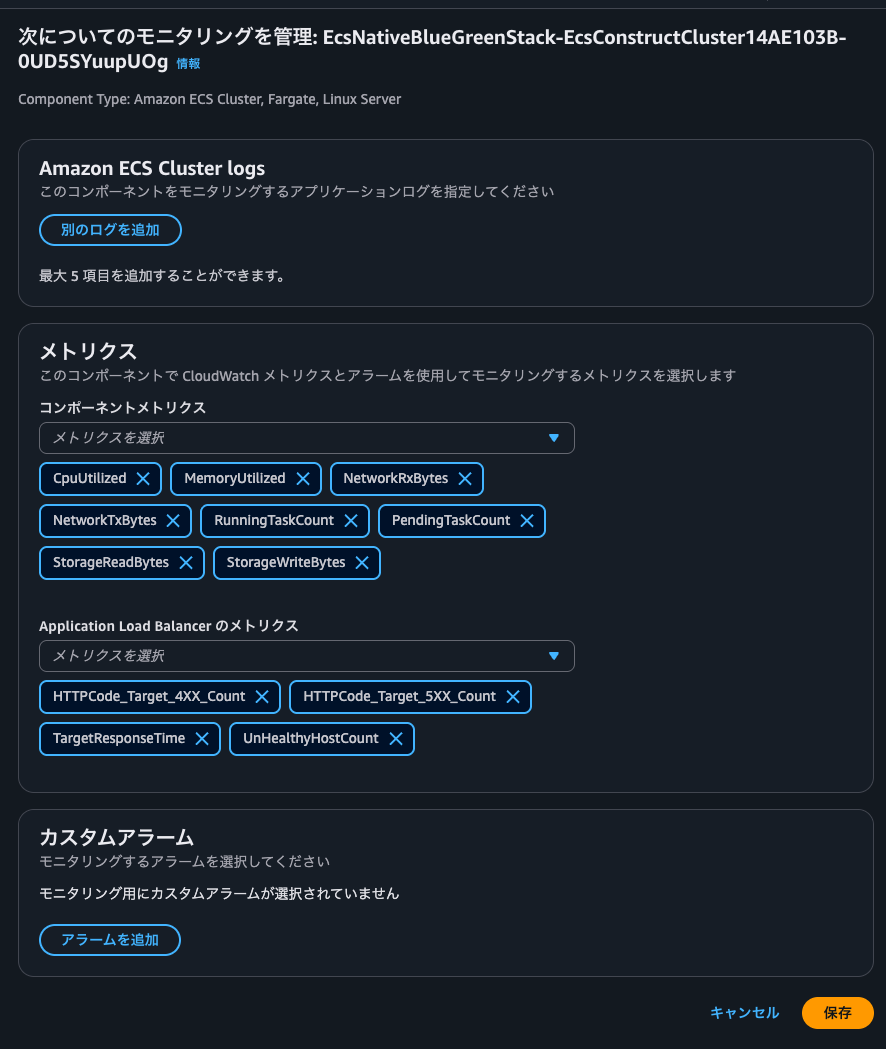
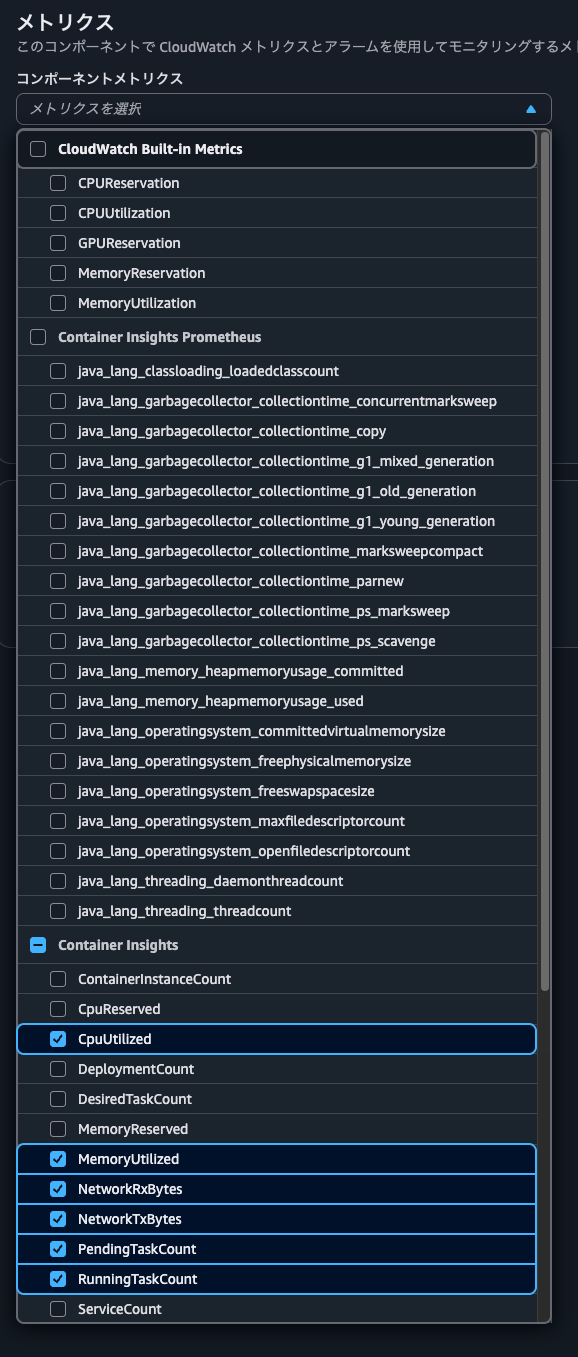
コンポーネントメトリクスではビルトインメトリクもしくはContainer Insightsで取得できるメトリクスを選択可能です。
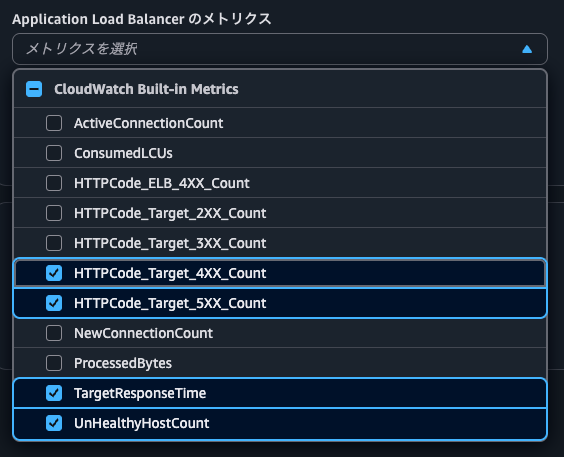
ALBのメトリクスも以下のように選択可能です。
今回はTaskCountとActiveConnectionCountを追加して保存をクリックします。
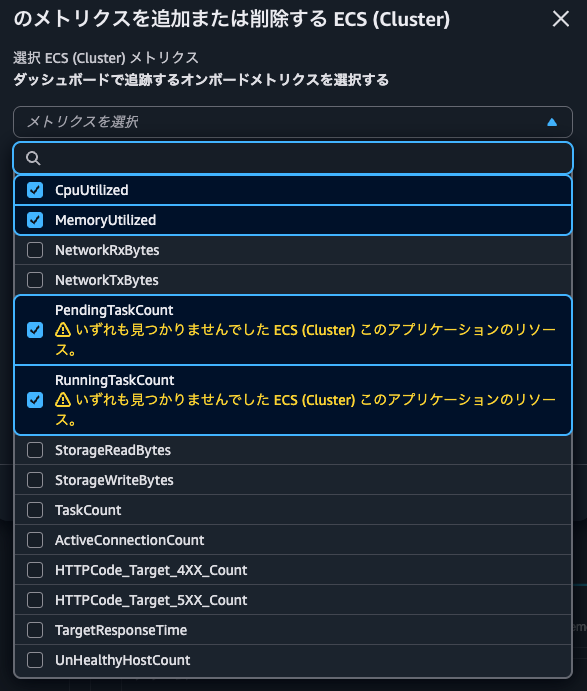
するとダッシュボードでメトリクスを追加または削除するからメトリクスの選択一覧を確認すると、先ほど追加したメトリクスを確認できるようになりました。
メトリクスを追加すると以下のようにダッシュボードにも反映されていました。
設定履歴の確認
設定履歴タブを確認します。
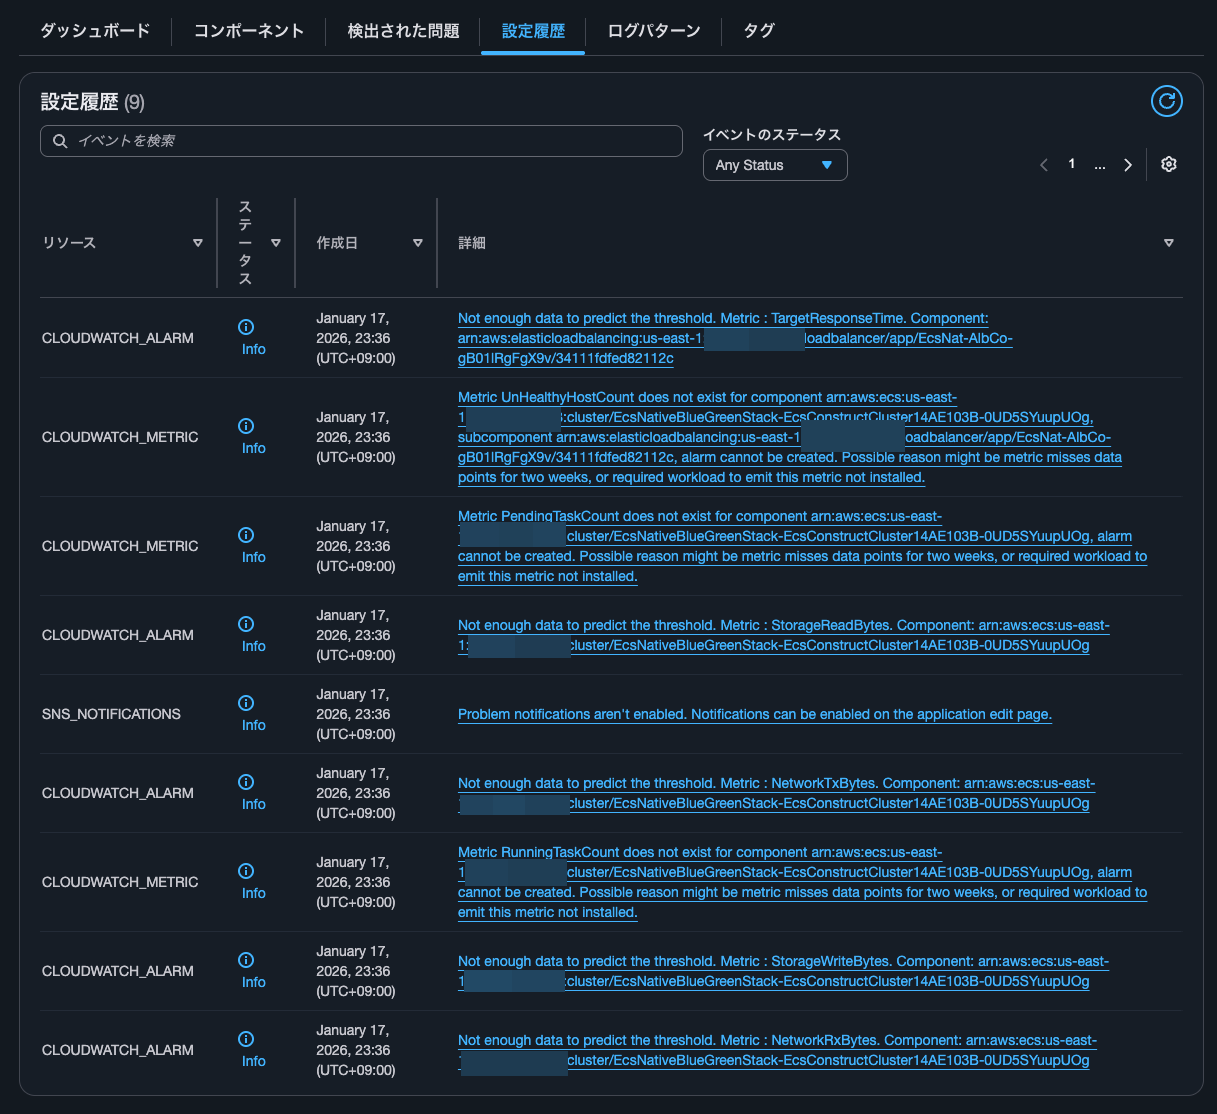
| リソース | ステータス | 作成日 | 詳細 |
|---|---|---|---|
| CLOUDWATCH_ALARM | Info | January 17, 2026, 23:36 (UTC+09:00) | Not enough data to predict the threshold. Metric : TargetResponseTime. Component: arn:aws:elasticloadbalancing:us-east-1:<AWSアカウントID>:loadbalancer/app/EcsNat-AlbCo-gB01lRgFgX9v/34111fdfed82112c |
| CLOUDWATCH_METRIC | Info | January 17, 2026, 23:36 (UTC+09:00) | Metric UnHealthyHostCount does not exist for component arn:aws:ecs:us-east-1:<AWSアカウントID>:cluster/EcsNativeBlueGreenStack-EcsConstructCluster14AE103B-0UD5SYuupUOg, subcomponent arn:aws:elasticloadbalancing:us-east-1:<AWSアカウントID>:loadbalancer/app/EcsNat-AlbCo-gB01lRgFgX9v/34111fdfed82112c, alarm cannot be created. Possible reason might be metric misses data points for two weeks, or required workload to emit this metric not installed. |
| CLOUDWATCH_METRIC | Info | January 17, 2026, 23:36 (UTC+09:00) | Metric PendingTaskCount does not exist for component arn:aws:ecs:us-east-1:<AWSアカウントID>:cluster/EcsNativeBlueGreenStack-EcsConstructCluster14AE103B-0UD5SYuupUOg, alarm cannot be created. Possible reason might be metric misses data points for two weeks, or required workload to emit this metric not installed. |
| CLOUDWATCH_ALARM | Info | January 17, 2026, 23:36 (UTC+09:00) | Not enough data to predict the threshold. Metric : StorageReadBytes. Component: arn:aws:ecs:us-east-1:<AWSアカウントID>:cluster/EcsNativeBlueGreenStack-EcsConstructCluster14AE103B-0UD5SYuupUOg |
| SNS_NOTIFICATIONS | Info | January 17, 2026, 23:36 (UTC+09:00) | Problem notifications aren't enabled. Notifications can be enabled on the application edit page. |
| CLOUDWATCH_ALARM | Info | January 17, 2026, 23:36 (UTC+09:00) | Not enough data to predict the threshold. Metric : NetworkTxBytes. Component: arn:aws:ecs:us-east-1:<AWSアカウントID>:cluster/EcsNativeBlueGreenStack-EcsConstructCluster14AE103B-0UD5SYuupUOg |
| CLOUDWATCH_METRIC | Info | January 17, 2026, 23:36 (UTC+09:00) | Metric RunningTaskCount does not exist for component arn:aws:ecs:us-east-1:<AWSアカウントID>:cluster/EcsNativeBlueGreenStack-EcsConstructCluster14AE103B-0UD5SYuupUOg, alarm cannot be created. Possible reason might be metric misses data points for two weeks, or required workload to emit this metric not installed. |
| CLOUDWATCH_ALARM | Info | January 17, 2026, 23:36 (UTC+09:00) | Not enough data to predict the threshold. Metric : StorageWriteBytes. Component: arn:aws:ecs:us-east-1:<AWSアカウントID>:cluster/EcsNativeBlueGreenStack-EcsConstructCluster14AE103B-0UD5SYuupUOg |
| CLOUDWATCH_ALARM | Info | January 17, 2026, 23:36 (UTC+09:00) | Not enough data to predict the threshold. Metric : NetworkRxBytes. Component: arn:aws:ecs:us-east-1:<AWSアカウントID>:cluster/EcsNativeBlueGreenStack-EcsConstructCluster14AE103B-0UD5SYuupUOg |
Not enough data to predict the threshold. MetricといくつかリソースCLOUDWATCH_ALARMのものがありますね。
対象の以下メトリクスは以下です。
- ALBの
TargetResponseTime - ECSクラスターの
StorageReadBytes - ECSクラスターの
StorageWriteBytes - ECSクラスターの
NetworkTxBytes - ECSクラスターの
NetworkRxBytes
後述確認するCloudWatchアラームにはありませんでした。
メッセージ的にCloudWatch Anomaly Detectionを設定しようとしていたのではないかと思ったのですが、CloudTrailを確認してもこのようなCloudWatchアラームを作成しようとした形跡はありませんでした。
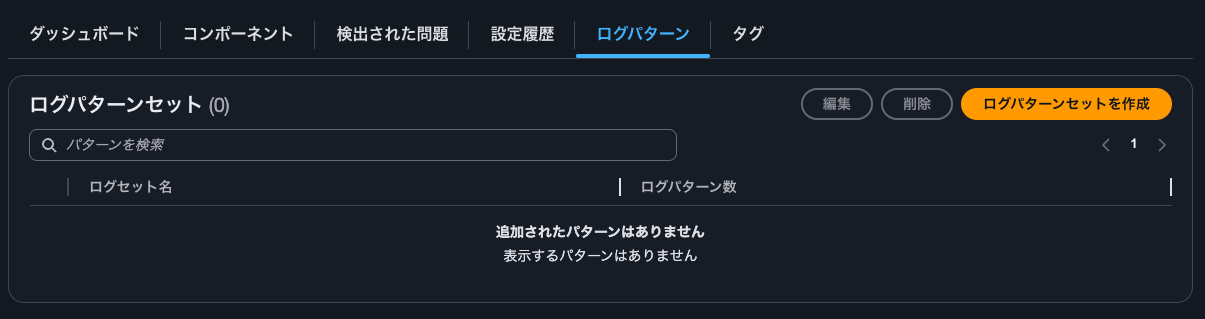
ログパターンの確認
ログパターンは何も設定されていません。
CloudWatchアラームの確認
CloudWatchアラームの確認をします。
CloudWatch Alarmを確認すると以下のとおり4つ設定されていました。
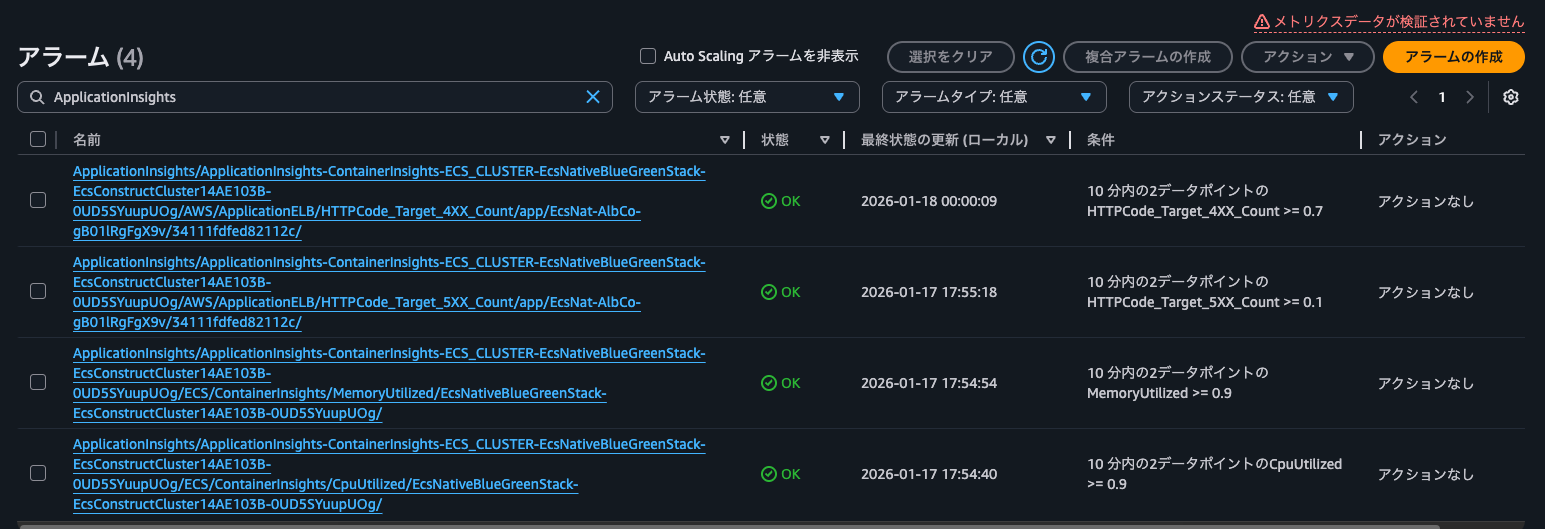
具体的には以下4メトリクスのアラームが設定されていました。
- ALBの
HTTPCode_Target_4XX_Count - ALBの
HTTPCode_Target_5XX_Count - ECSクラスターの
MemoryUtilized - ECSクラスターの
CpuUtilized
各アラームの設定は以下のとおりです。
Type: AWS::CloudWatch::Alarm
Properties:
    AlarmName: ApplicationInsights/ApplicationInsights-ContainerInsights-ECS_CLUSTER-EcsNativeBlueGreenStack-EcsConstructCluster14AE103B-0UD5SYuupUOg/AWS/ApplicationELB/HTTPCode_Target_4XX_Count/app/EcsNat-AlbCo-gB01lRgFgX9v/34111fdfed82112c/
    AlarmDescription: This is math expression alarm created and managed by the
        CloudWatch Application Insights. To make changes please go to your
        application's configuration in Application Insights
    Tags:
        - Key: ApplicationInsightsManaged
          Value: "TRUE"
    ActionsEnabled: true
    OKActions: []
    AlarmActions: []
    InsufficientDataActions: []
    Dimensions: []
    EvaluationPeriods: 2
    DatapointsToAlarm: 2
    Threshold: 0.7
    ComparisonOperator: GreaterThanOrEqualToThreshold
    TreatMissingData: notBreaching
    Metrics:
        - Id: m8
          Label: HTTPCode_Target_4XX_Count
          Expression: m8_HTTPCode_Target_4XX_Count/m8_RequestCount
        - Id: m8_HTTPCode_Target_4XX_Count
          Label: input
          ReturnData: false
          MetricStat:
              Metric:
                  Namespace: AWS/ApplicationELB
                  MetricName: HTTPCode_Target_4XX_Count
                  Dimensions:
                      - Name: LoadBalancer
                        Value: app/EcsNat-AlbCo-gB01lRgFgX9v/34111fdfed82112c
              Period: 300
              Stat: Sum
              Unit: Count
        - Id: m8_RequestCount
          Label: input
          ReturnData: false
          MetricStat:
              Metric:
                  Namespace: AWS/ApplicationELB
                  MetricName: RequestCount
                  Dimensions:
                      - Name: LoadBalancer
                        Value: app/EcsNat-AlbCo-gB01lRgFgX9v/34111fdfed82112c
              Period: 300
              Stat: Sum
              Unit: Count
Type: AWS::CloudWatch::Alarm
Properties:
    AlarmName: ApplicationInsights/ApplicationInsights-ContainerInsights-ECS_CLUSTER-EcsNativeBlueGreenStack-EcsConstructCluster14AE103B-0UD5SYuupUOg/AWS/ApplicationELB/HTTPCode_Target_5XX_Count/app/EcsNat-AlbCo-gB01lRgFgX9v/34111fdfed82112c/
    AlarmDescription: This is math expression alarm created and managed by the
        CloudWatch Application Insights. To make changes please go to your
        application's configuration in Application Insights
    Tags:
        - Key: ApplicationInsightsManaged
          Value: "TRUE"
    ActionsEnabled: true
    OKActions: []
    AlarmActions: []
    InsufficientDataActions: []
    Dimensions: []
    EvaluationPeriods: 2
    DatapointsToAlarm: 2
    Threshold: 0.1
    ComparisonOperator: GreaterThanOrEqualToThreshold
    TreatMissingData: notBreaching
    Metrics:
        - Id: m7
          Label: HTTPCode_Target_5XX_Count
          Expression: m7_HTTPCode_Target_5XX_Count/m7_RequestCount
        - Id: m7_HTTPCode_Target_5XX_Count
          Label: input
          ReturnData: false
          MetricStat:
              Metric:
                  Namespace: AWS/ApplicationELB
                  MetricName: HTTPCode_Target_5XX_Count
                  Dimensions:
                      - Name: LoadBalancer
                        Value: app/EcsNat-AlbCo-gB01lRgFgX9v/34111fdfed82112c
              Period: 300
              Stat: Sum
              Unit: Count
        - Id: m7_RequestCount
          Label: input
          ReturnData: false
          MetricStat:
              Metric:
                  Namespace: AWS/ApplicationELB
                  MetricName: RequestCount
                  Dimensions:
                      - Name: LoadBalancer
                        Value: app/EcsNat-AlbCo-gB01lRgFgX9v/34111fdfed82112c
              Period: 300
              Stat: Sum
              Unit: Count
Type: AWS::CloudWatch::Alarm
Properties:
    AlarmName: ApplicationInsights/ApplicationInsights-ContainerInsights-ECS_CLUSTER-EcsNativeBlueGreenStack-EcsConstructCluster14AE103B-0UD5SYuupUOg/ECS/ContainerInsights/MemoryUtilized/EcsNativeBlueGreenStack-EcsConstructCluster14AE103B-0UD5SYuupUOg/
    AlarmDescription: This is math expression alarm created and managed by the
        CloudWatch Application Insights. To make changes please go to your
        application's configuration in Application Insights
    Tags:
        - Key: ApplicationInsightsManaged
          Value: "TRUE"
    ActionsEnabled: true
    OKActions: []
    AlarmActions: []
    InsufficientDataActions: []
    Dimensions: []
    EvaluationPeriods: 2
    DatapointsToAlarm: 2
    Threshold: 0.9
    ComparisonOperator: GreaterThanOrEqualToThreshold
    TreatMissingData: ignore
    Metrics:
        - Id: m1
          Label: MemoryUtilized
          Expression: m1_MemoryUtilized/m1_MemoryReserved
        - Id: m1_MemoryUtilized
          Label: input
          ReturnData: false
          MetricStat:
              Metric:
                  Namespace: ECS/ContainerInsights
                  MetricName: MemoryUtilized
                  Dimensions:
                      - Name: ClusterName
                        Value: EcsNativeBlueGreenStack-EcsConstructCluster14AE103B-0UD5SYuupUOg
              Period: 300
              Stat: Average
              Unit: Megabytes
        - Id: m1_MemoryReserved
          Label: input
          ReturnData: false
          MetricStat:
              Metric:
                  Namespace: ECS/ContainerInsights
                  MetricName: MemoryReserved
                  Dimensions:
                      - Name: ClusterName
                        Value: EcsNativeBlueGreenStack-EcsConstructCluster14AE103B-0UD5SYuupUOg
              Period: 300
              Stat: Average
              Unit: Megabytes
Type: AWS::CloudWatch::Alarm
Properties:
    AlarmName: ApplicationInsights/ApplicationInsights-ContainerInsights-ECS_CLUSTER-EcsNativeBlueGreenStack-EcsConstructCluster14AE103B-0UD5SYuupUOg/ECS/ContainerInsights/CpuUtilized/EcsNativeBlueGreenStack-EcsConstructCluster14AE103B-0UD5SYuupUOg/
    AlarmDescription: This is math expression alarm created and managed by the
        CloudWatch Application Insights. To make changes please go to your
        application's configuration in Application Insights
    Tags:
        - Key: ApplicationInsightsManaged
          Value: "TRUE"
    ActionsEnabled: true
    OKActions: []
    AlarmActions: []
    InsufficientDataActions: []
    Dimensions: []
    EvaluationPeriods: 2
    DatapointsToAlarm: 2
    Threshold: 0.9
    ComparisonOperator: GreaterThanOrEqualToThreshold
    TreatMissingData: ignore
    Metrics:
        - Id: m3
          Label: CpuUtilized
          Expression: m3_CpuUtilized/m3_CpuReserved
        - Id: m3_CpuUtilized
          Label: input
          ReturnData: false
          MetricStat:
              Metric:
                  Namespace: ECS/ContainerInsights
                  MetricName: CpuUtilized
                  Dimensions:
                      - Name: ClusterName
                        Value: EcsNativeBlueGreenStack-EcsConstructCluster14AE103B-0UD5SYuupUOg
              Period: 300
              Stat: Average
              Unit: None
        - Id: m3_CpuReserved
          Label: input
          ReturnData: false
          MetricStat:
              Metric:
                  Namespace: ECS/ContainerInsights
                  MetricName: CpuReserved
                  Dimensions:
                      - Name: ClusterName
                        Value: EcsNativeBlueGreenStack-EcsConstructCluster14AE103B-0UD5SYuupUOg
              Period: 300
              Stat: Average
              Unit: None
アプリケーションごとのダッシュボードやアラームを管理したい場合に
Container InsightsでECSクラスターについてCloudWatch Application Insightsを設定した場合にどのようなCloudWatch Alarmが設定されるのか確認してみました。
アプリケーションごとのダッシュボードやアラームを管理したい場合に便利そうですね。
ちなみに以下記事で紹介されているApplication Insights設定後にUpdateClusterSettingsが実行されて、Container Insightsがwith enhanced observabilityでなくなってしまうと言う事象は発生しませんでした。
この記事が誰かの助けになれば幸いです。
以上、クラウド事業本部 コンサルティング部の のんピ(@non____97)でした!