Recap of AWS Community Day DACH 2025: Rethinking CloudWatch: Advanced AWS-native Observability That Can Save You $100k+ On 3rd Party Tools
Session Information
Presenter: Tobias Schmidt
Rethinking CloudWatch: Advanced AWS-native Observability That Can Save You $100k+ On 3rd Party Tools
CloudWatch has changed—and most people haven’t noticed.
In this talk, I’ll dig into why the usual complaints about CloudWatch being clunky, overpriced, or too limited just don’t hold up anymore. I’ll walk through real-world ways to use its newer features to build solid observability setups—without jumping straight to expensive third-party tools.
I’ll also cover how to keep costs low without losing the metrics, logs, and traces you actually need.
Overview
The talk addressed the evolving state of CloudWatch, which has significantly improved in recent years but many people haven't noticed these changes.
Tobias introduced practical ways to leverage CloudWatch's newer features to build solid observability setups without paying for expensive third-party tools.
Here you can find whole session slides: Rethinking CloudWatch
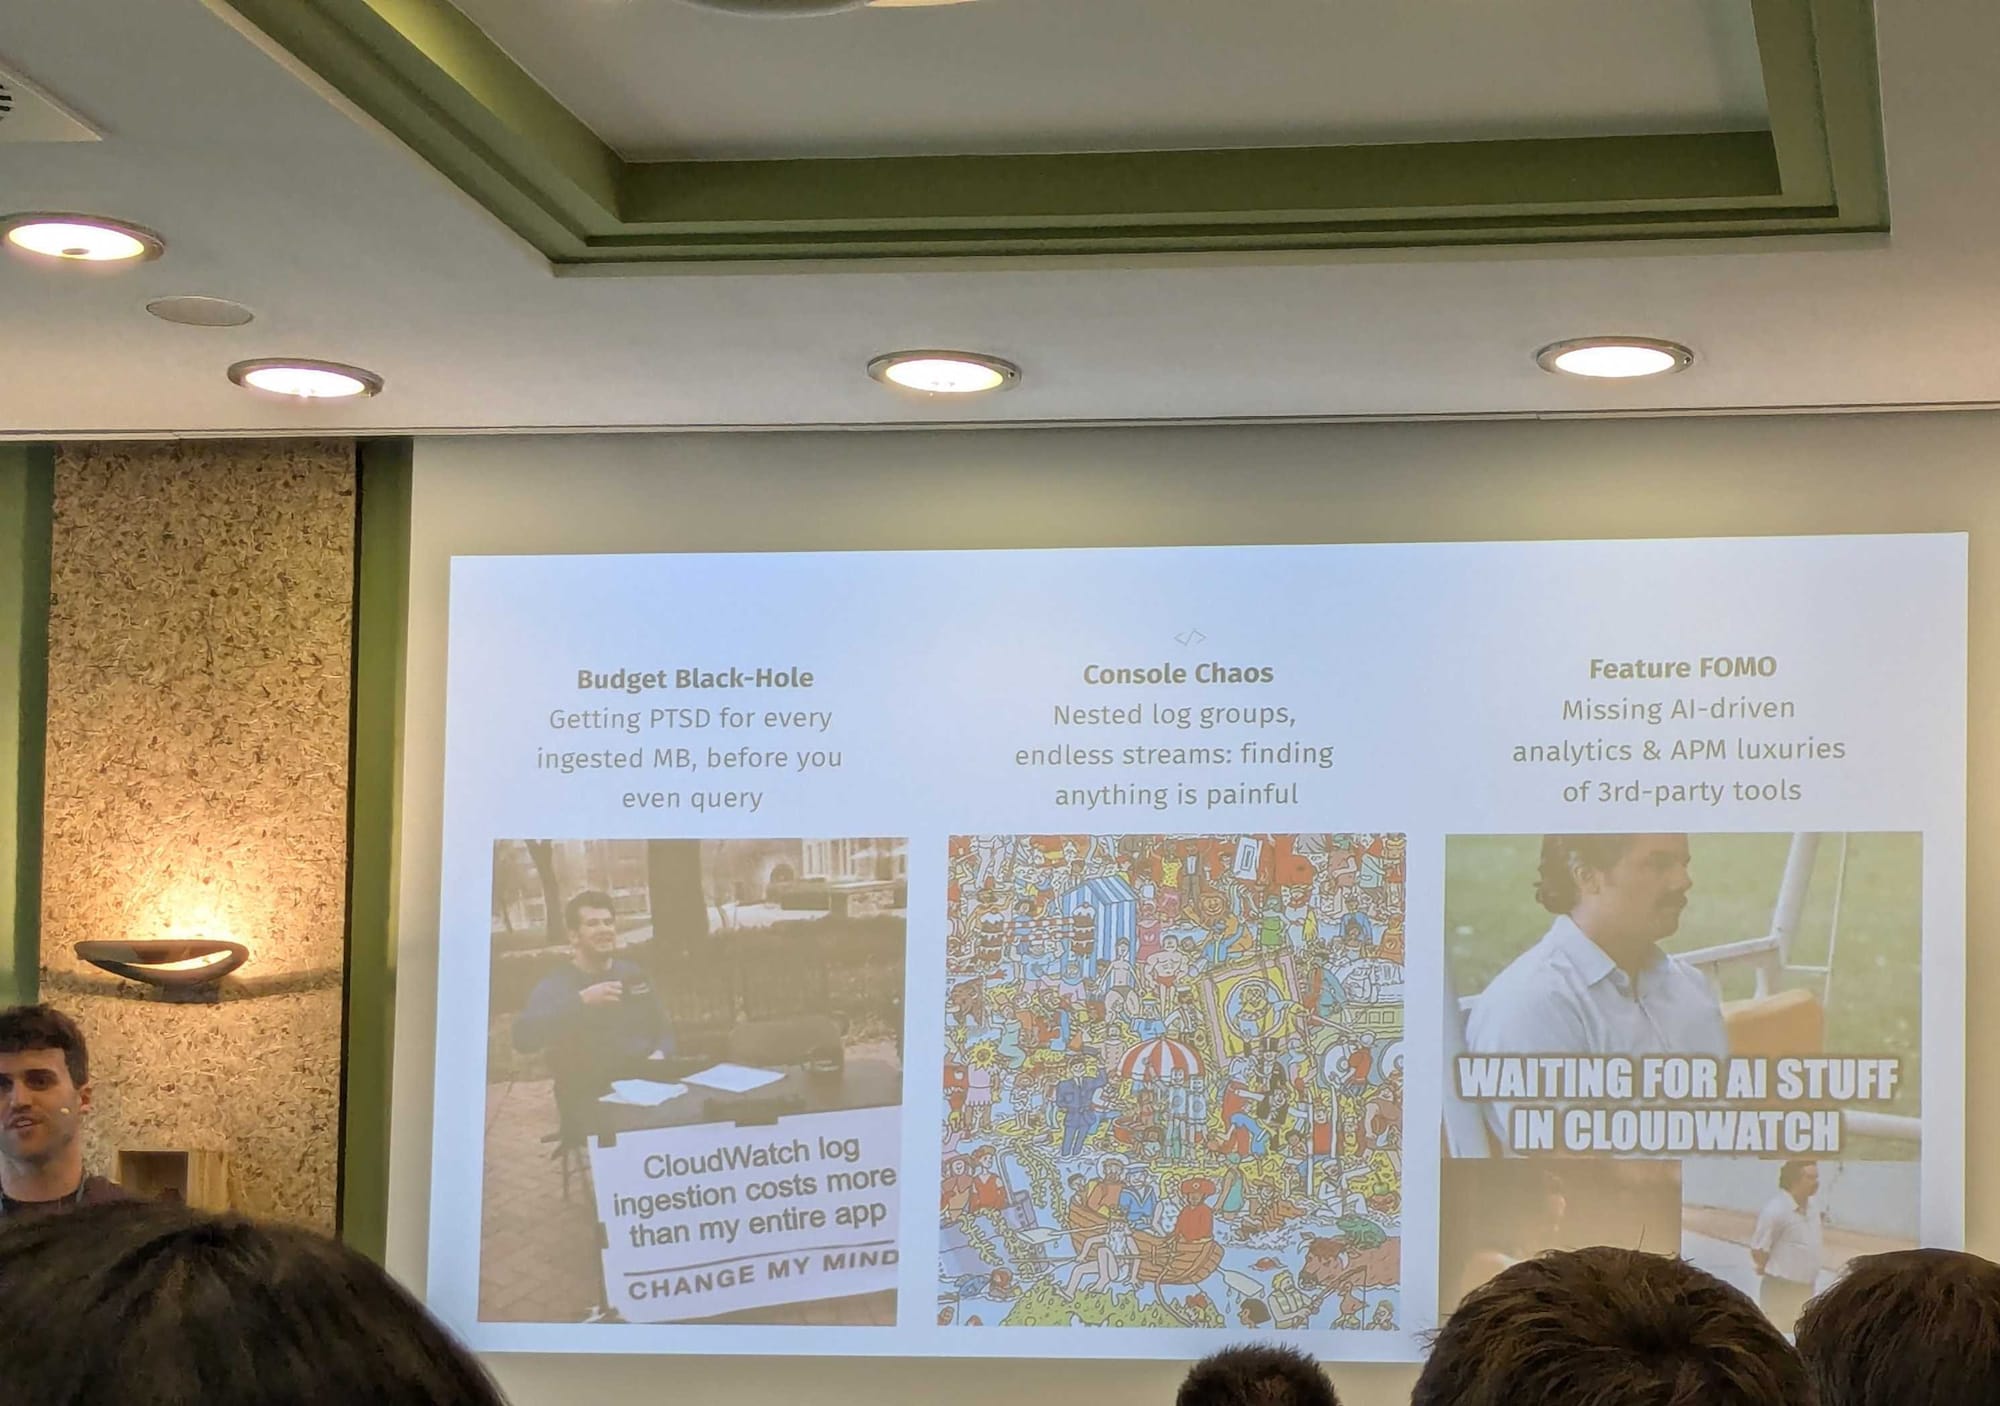
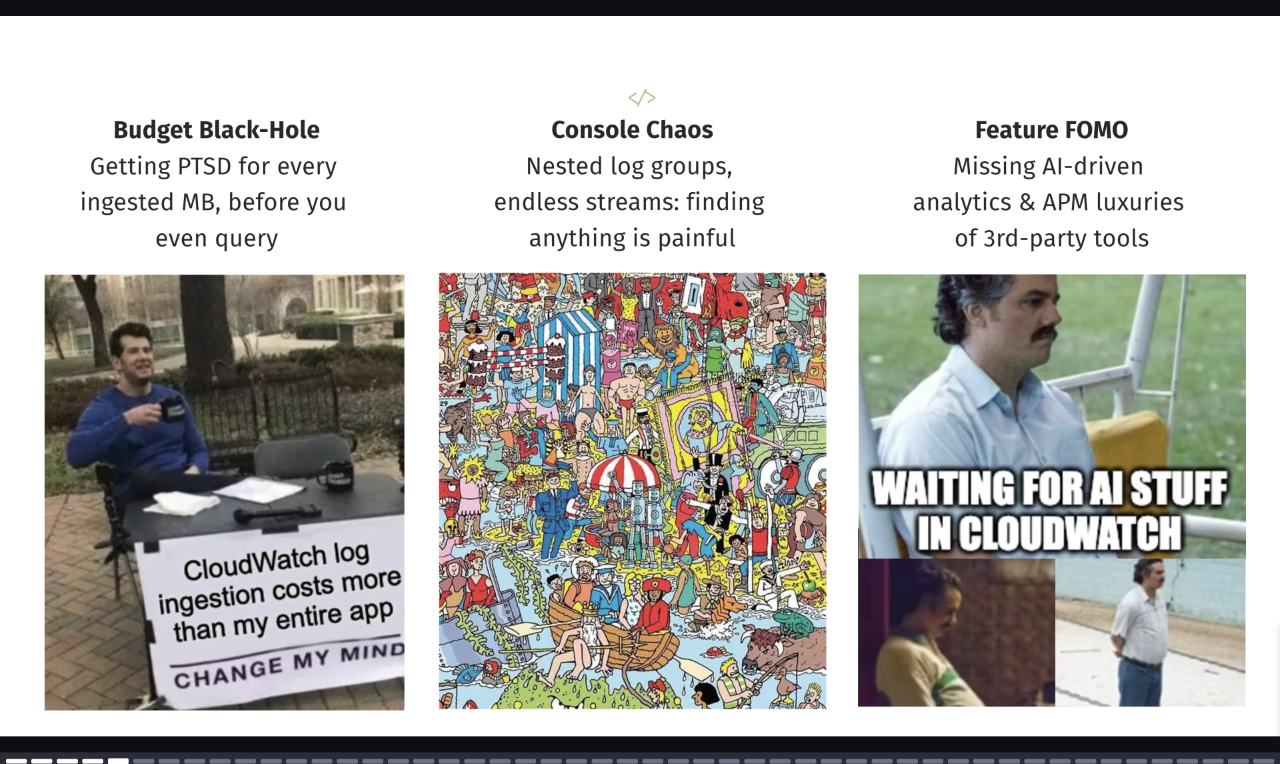
Common Myths About CloudWatch
Tobias identified three main myths that he aimed to debunk:
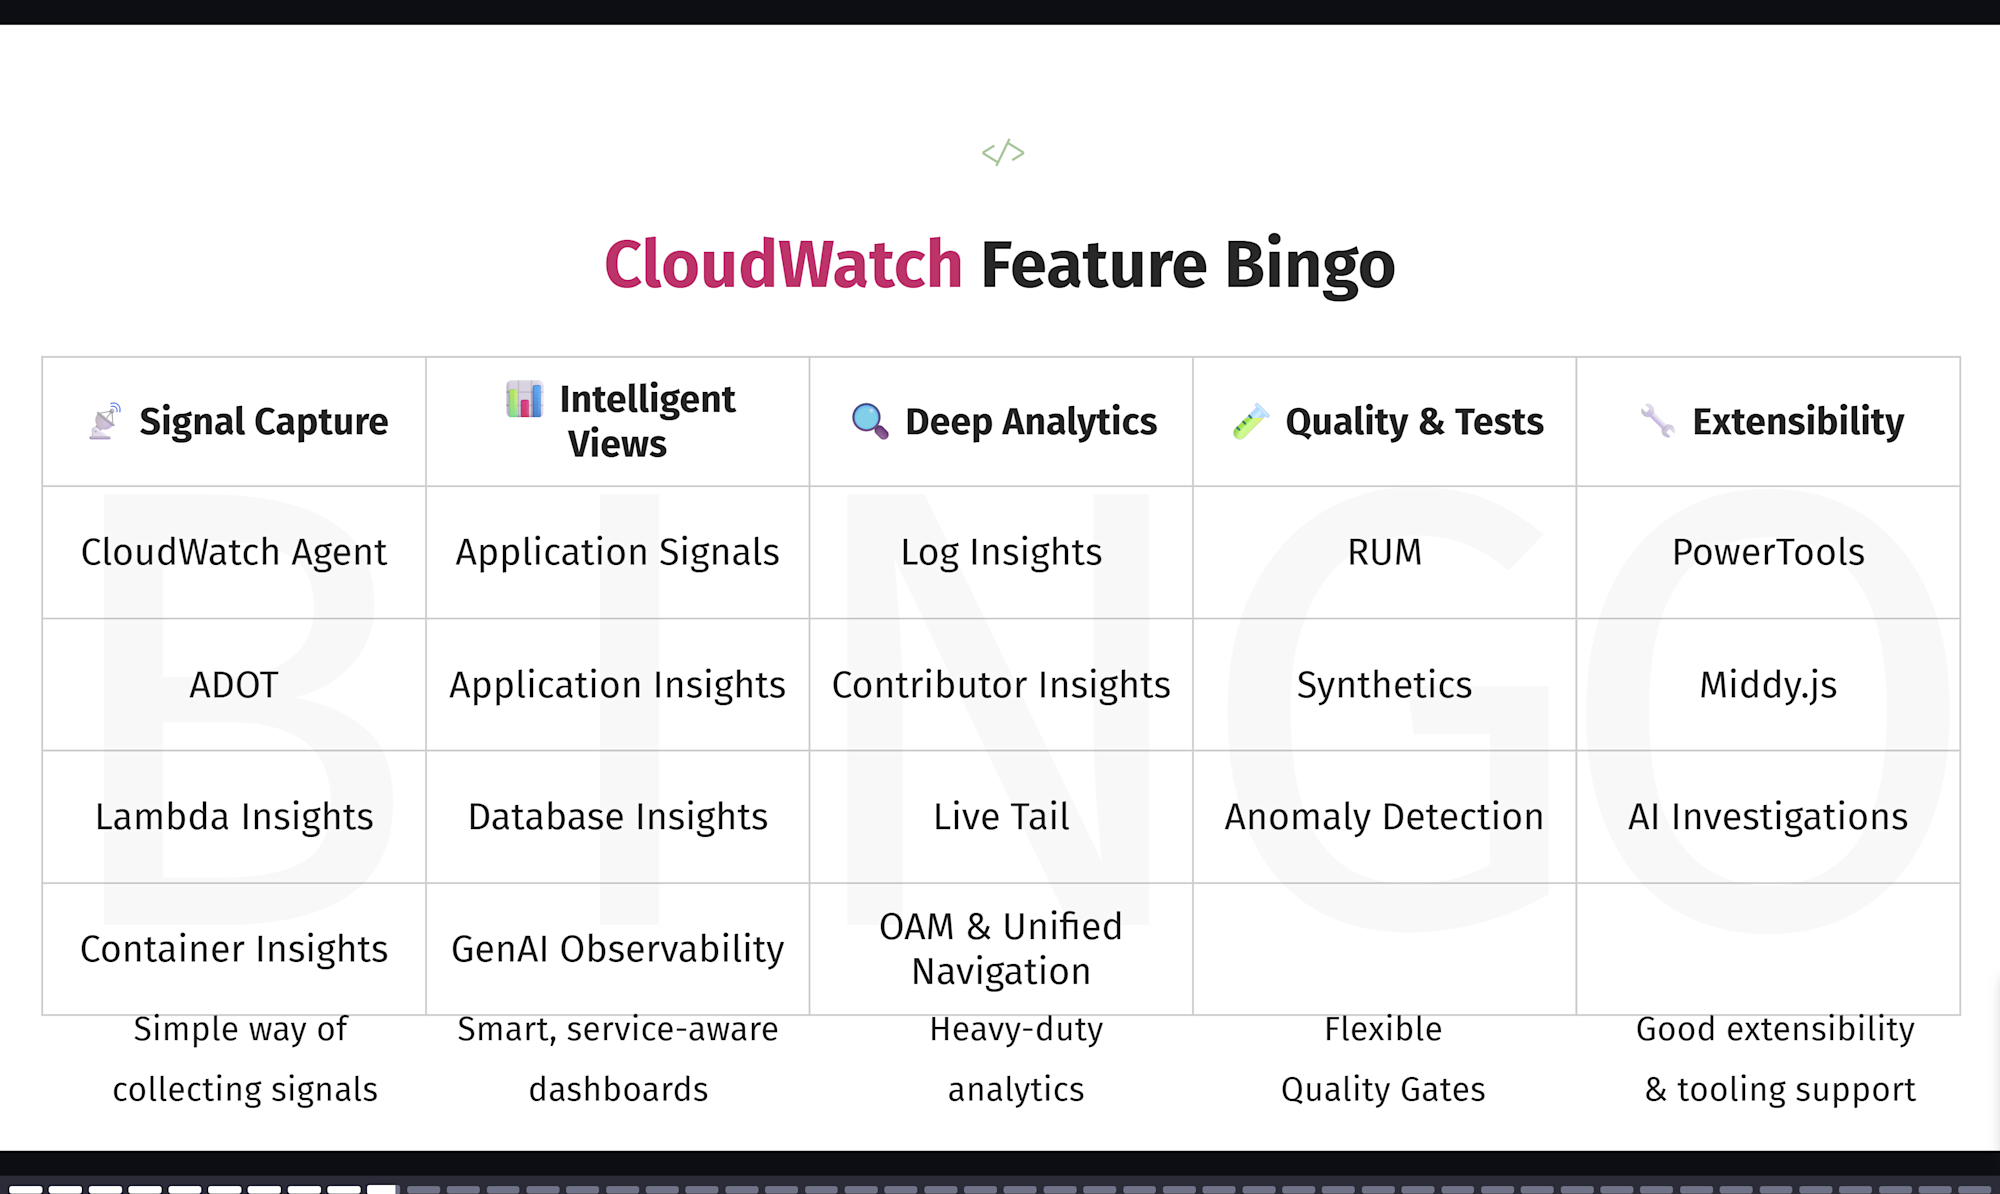
Latest Key Features of CloudWatch
The picture below summarizes the key points from the session:
Personal Notes
From here, I will summarize the parts which attracted my attention.
OpenTelemetry
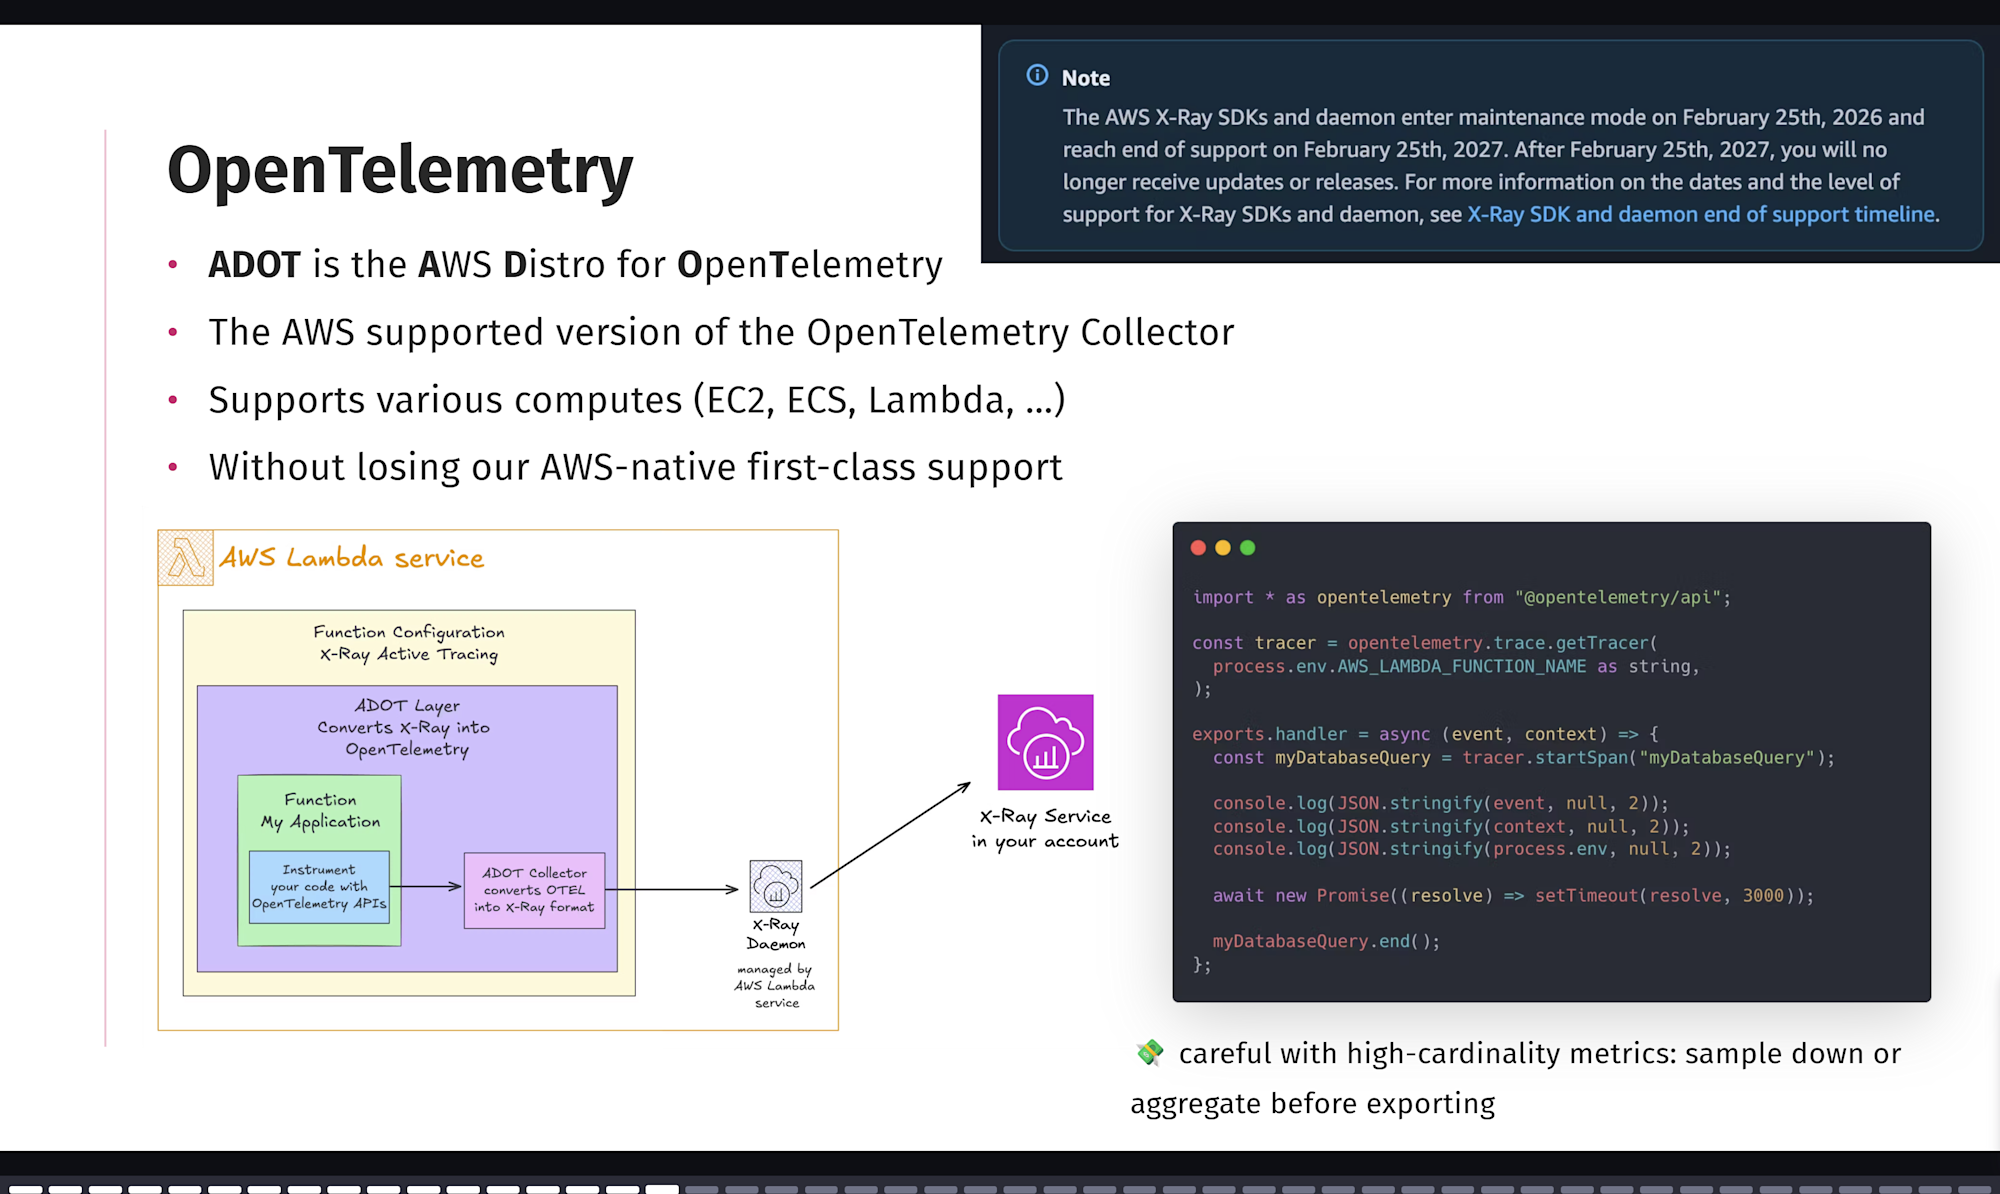
One of the highlights from Tobias's talk was AWS support for OpenTelemetry.
While I knew AWS was supporting it, this session helped me understand the practical details.
ADOT (AWS Distro for OpenTelemetry) is the AWS supported version of the OpenTelemetry Collector that works with EC2, ECS, Lambda, and other AWS services.
https://github.com/aws-observability/aws-otel-collector
For example, by running the OpenTelemetry Collector as a sidecar in ECS, you can collect application telemetry data (metrics, logs, traces) and send them to CloudWatch, X-Ray, or third-party tools.
This standardized approach helps avoid vendor lock-in.
Use ADOT to instrument your applications running on AWS App Runner, AWS Lambda, Amazon Elastic Compute Cloud (EC2), Amazon Elastic Container Service (ECS), and Amazon Elastic Kubernetes Service (EKS) on EC2, and AWS Fargate, as well as in your on-premises datacenter.
https://aws-otel.github.io/docs/introduction
Important note: The AWS X-Ray SDK and daemon will enter maintenance mode on February 25, 2026. With the ADOT Collector now available, the AWS-specific X-Ray SDK is no longer needed.
Cross Account Observability
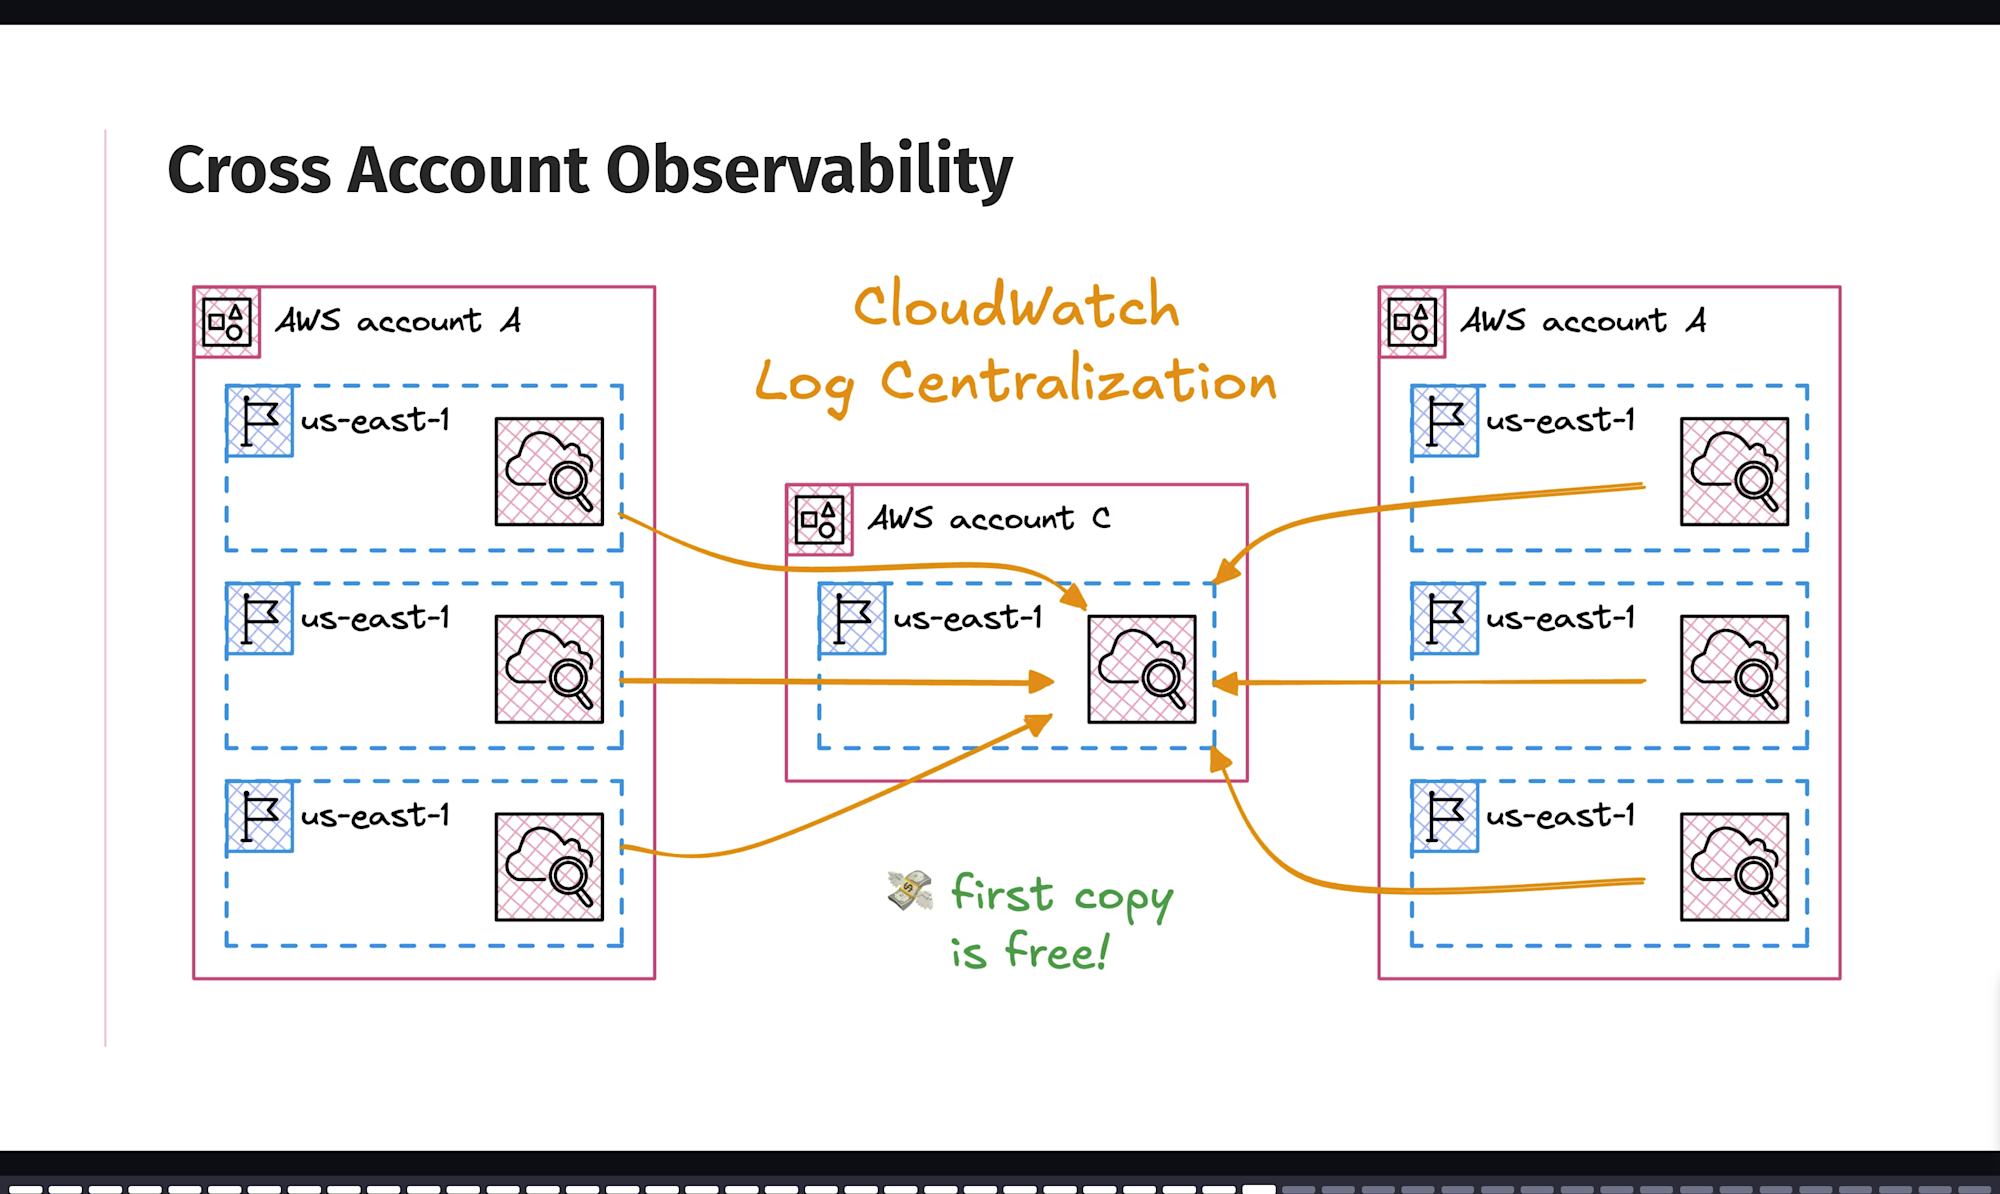
Tobias described CloudWatch's cross-account observability feature, which enables centralized telemetry data (metrics, logs, traces) across multiple AWS accounts.
I'm already using this feature in my current project for cross-account metrics aggregation.
This is particularly useful for organizations with multiple AWS accounts, as it simplifies monitoring and reduces management overhead.
However, note that some logs, such as S3 bucket logs (e.g., ELB access logs), cannot be directly integrated into cross-account observability.
In such cases, you'll need to forward them to CloudWatch Logs for centralized monitoring.
AI Investigations
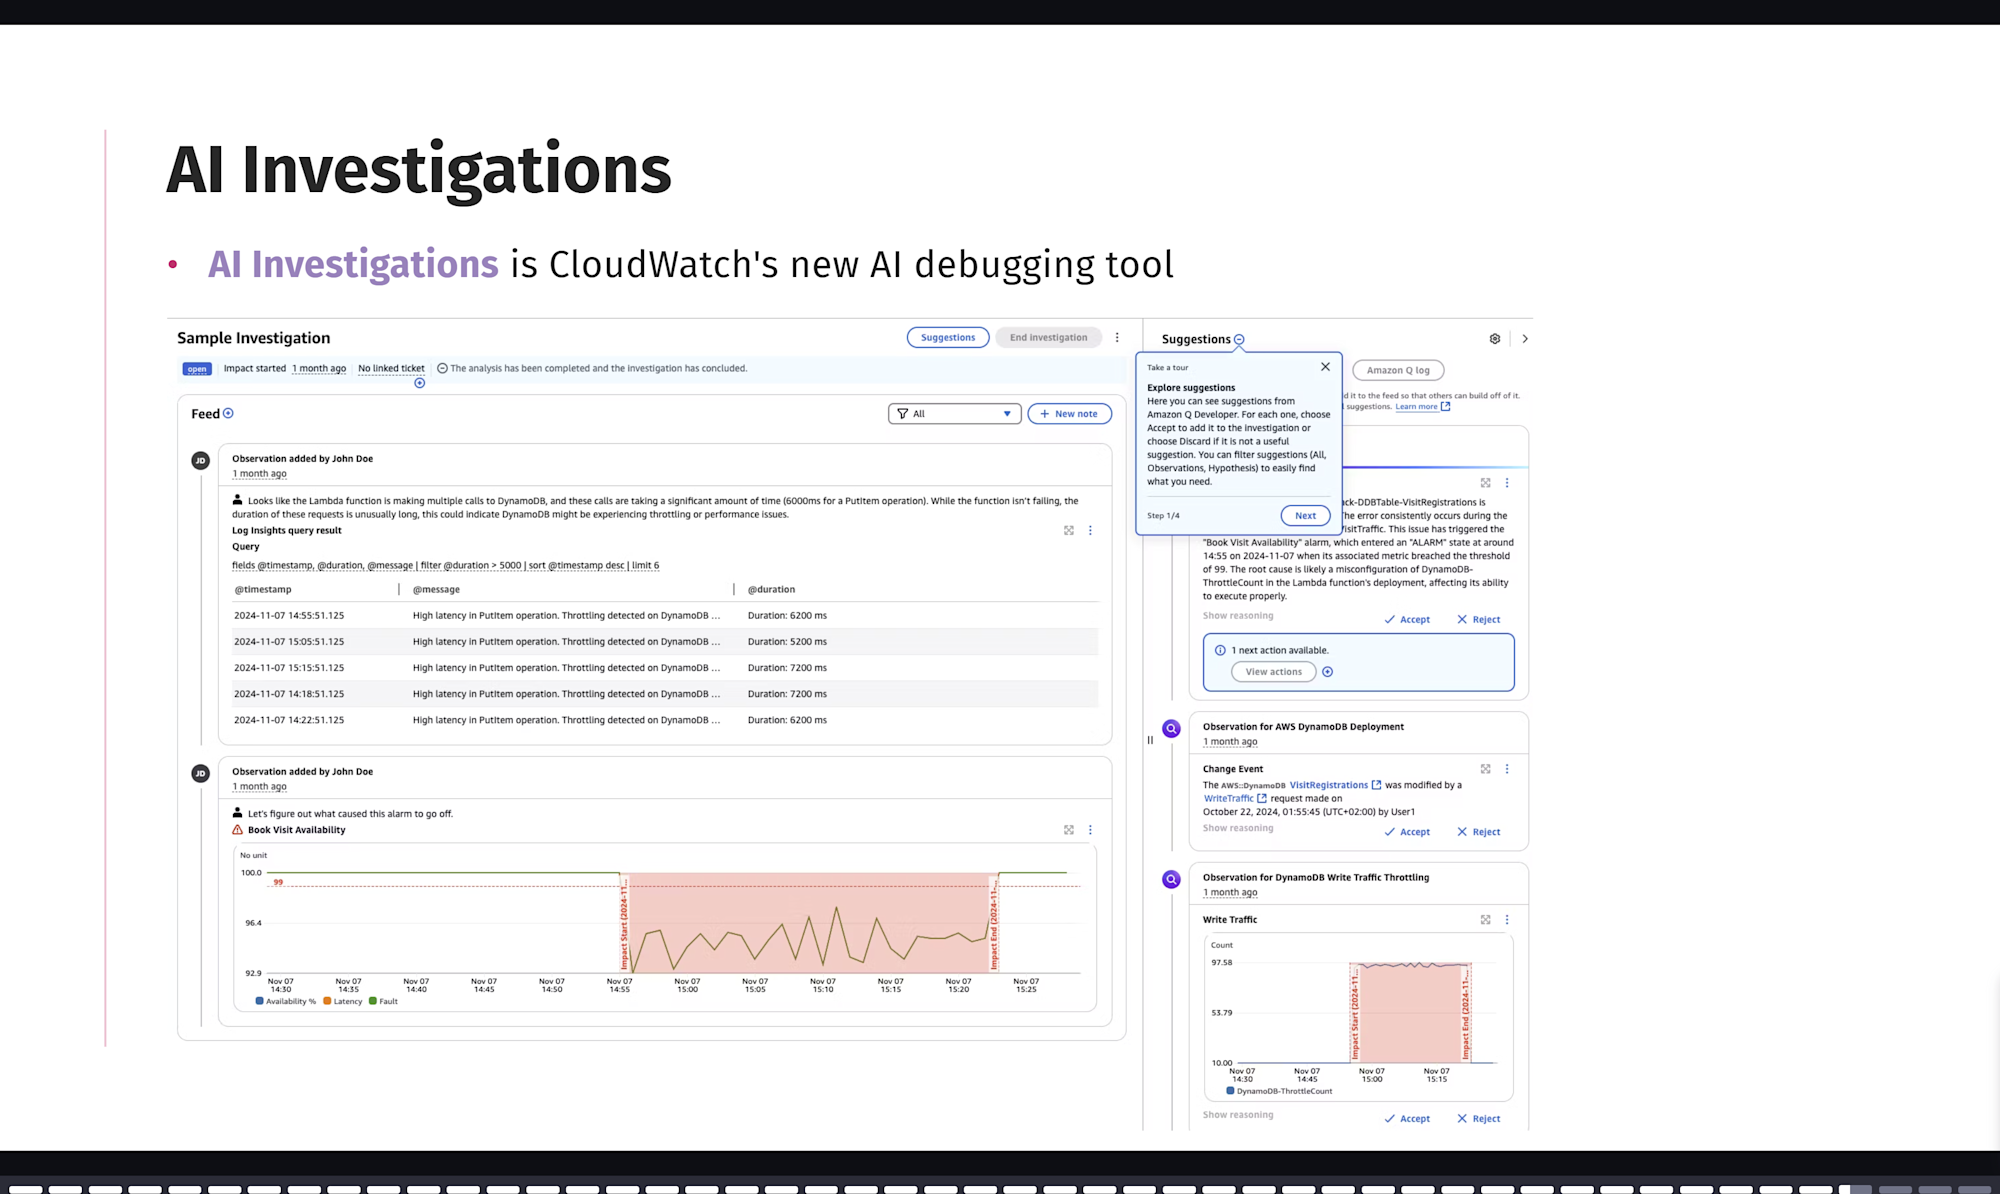
Tobias introduced CloudWatch's AI-powered investigation feature, which caught my attention and lead me to try it out after the session.
This feature investigates issues occurred in AWS based on logs and metrics stored in AWS using AI.
I tested it for a database CPU/Memory usage spike investigation in my current project.
The service automatically analyzed application related logs and metrics and provided possible root causes and hypotheses.
After the investigation, I was able to create a report by genAI and share it with my team members.
This is definitely worth trying if you have issues in your AWS environment.
The AI can investigate from one angle while you simultaneously investigate from another.
You can also provide additional logs or metrics to the ongoing investigation as needed.
Summary
The matrix slide is very helpful to understand the current state of CloudWatch.
When you start a new project, you can consider CloudWatch as a first-class observability tool.
Or, if you are struggling with the cost of third-party tools, this is a good time to rethink your observability strategy with CloudWatch.
Thanks to Tobias for the great session!