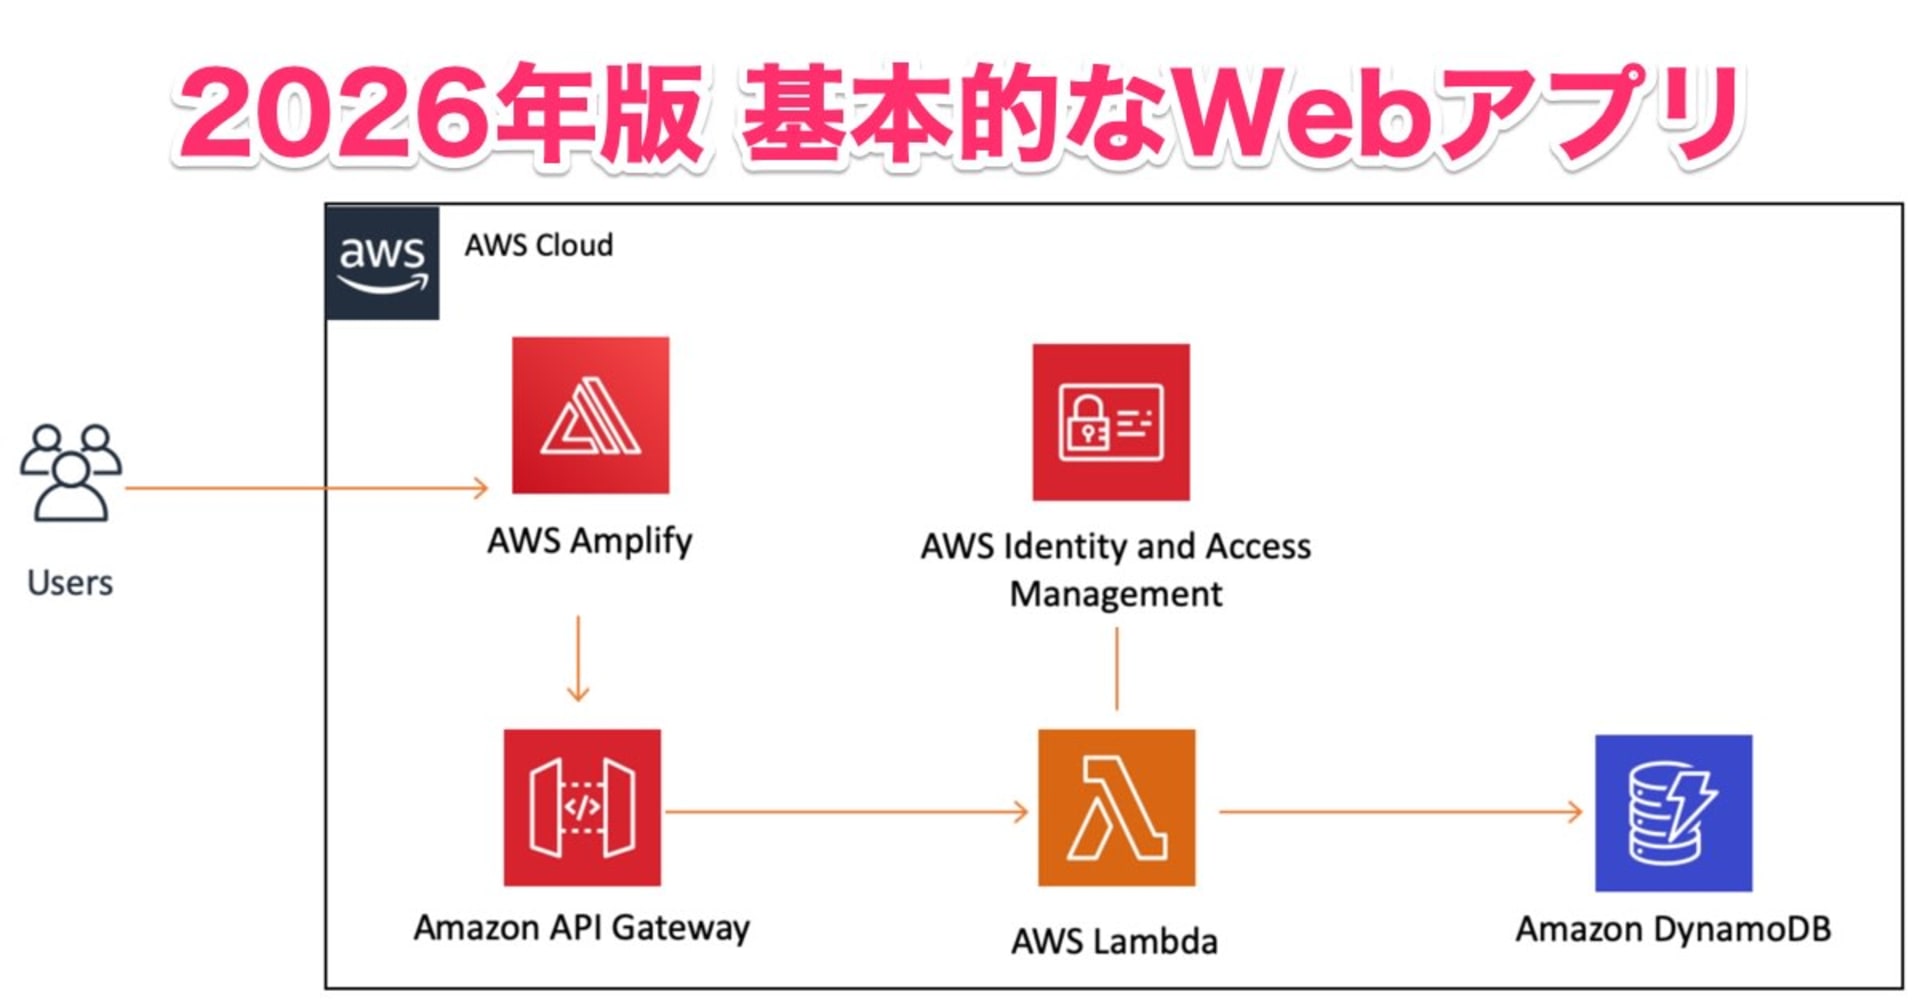
Amazon DynamoDB のデータを API Gateway と Angular( D3.js ) でサーバーレス可視化する
この記事は公開されてから1年以上経過しています。情報が古い可能性がありますので、ご注意ください。
データを溜め込んでいく理由はビジネス要件によって多々ありますが、要件のひとつに「データを可視化したい」というものがあると思います。今回は DynamoDB 上のデータを Angular と D3 を使ってサーバーレスで可視化するサンプルを作ってみます。

やること
- Angular + D3.js でデータ可視化の準備をする
- DynamoDB にデータを用意する
- API Gateway で Angular 向けに変換して DynamoDB のデータを返す
- Angular で ローカルデータを使う代わりにHTTPリクエストする
Angular + D3.js でデータ可視化の準備をする
最初に、仮データを用意してローカルで可視化してしまいましょう。今回用意したデータはこちら。
| 候補者ID | 投票受付日 | 投票ポイント |
|---|---|---|
| MI12341011 | 2017-11-10T12:00:12+09:00 | 345.11 |
| MI12341011 | 2017-11-11T22:00:12+09:00 | 102.34 |
| MI12341011 | 2017-11-12T09:12:45+09:00 | 344.11 |
| SU40120055 | 2017-11-10T12:14:44+09:00 | 345.11 |
とある投票システムを仮想したデータです。特定の投票者IDに関するデータを、日別で見たいとしましょう。
export interface Vote {
  voteDate: string;
  value: number;
}

export const Votes: Vote[] = [
  {voteDate: '2017-11-10T12:00:12+09:00', value: 345.11 },
  {voteDate: '2017-11-11T22:00:12+09:00', value: 102.34 },
  {voteDate: '2017-11-12T09:12:45+09:00', value: 345.11 },
  {voteDate: '2017-11-13T09:12:45+09:00', value: 312.12 },
  {voteDate: '2017-11-14T09:12:45+09:00', value: 267.34 }
];
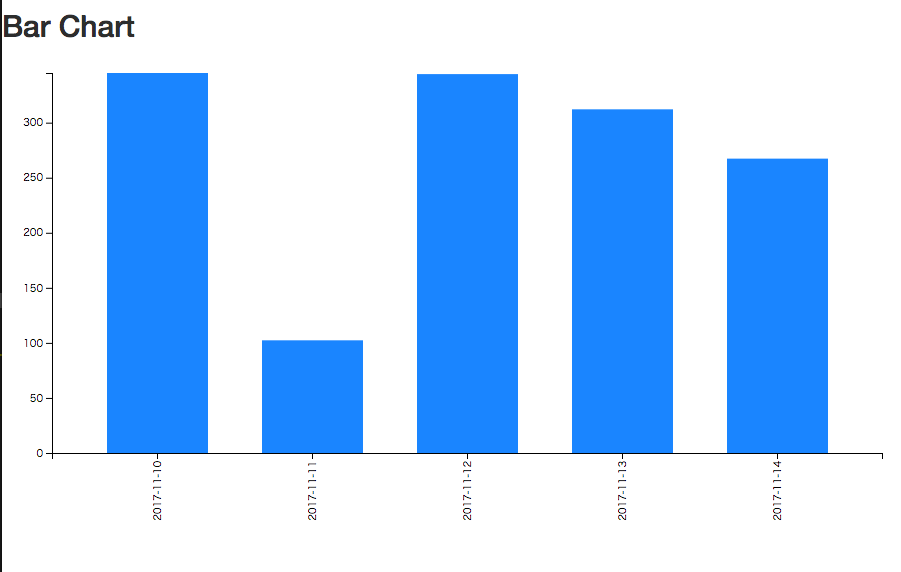
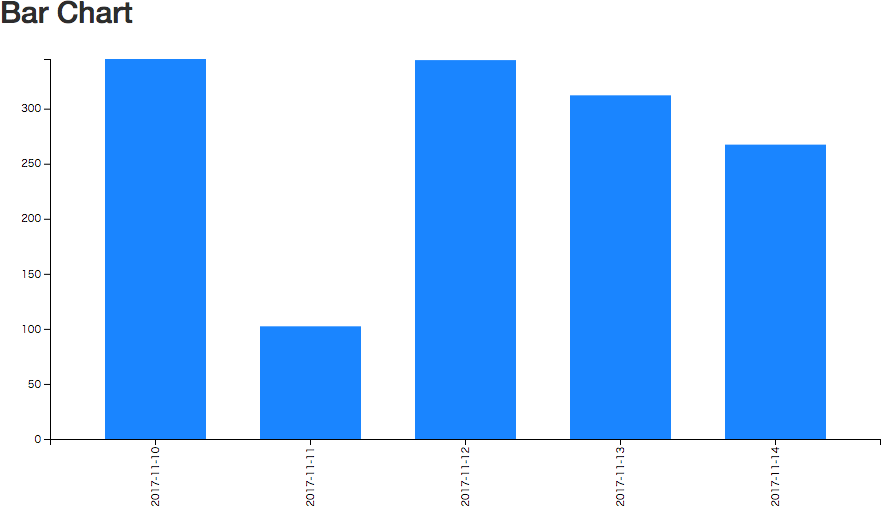
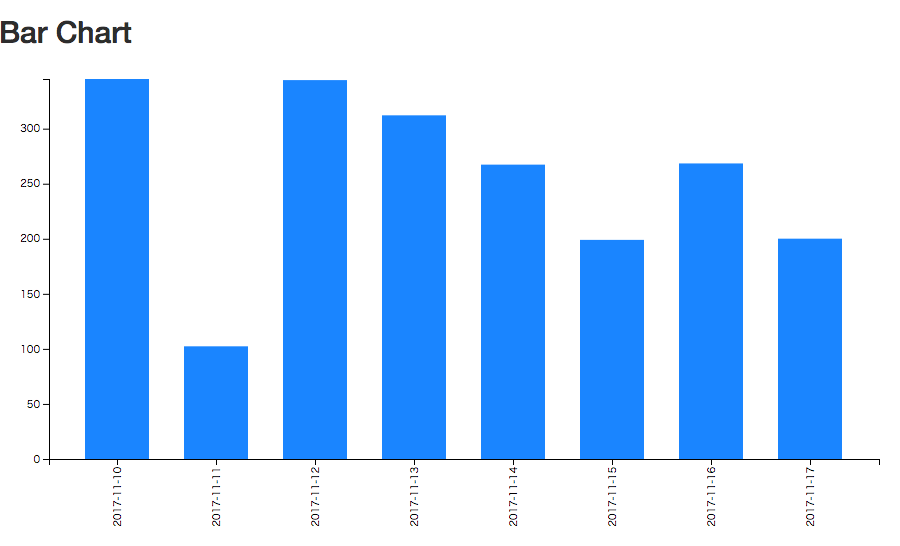
これを D3.js を使って棒グラフにします。
import {Component, OnInit} from '@angular/core';

import * as d3 from 'd3-selection';
import * as d3Scale from 'd3-scale';
import * as d3Array from 'd3-array';
import * as d3Axis from 'd3-axis';
import * as d3TimeFormat from 'd3-time-format';
import {VoteDataService} from './vote-data.service';
import {Votes} from './data';

@Component({
  selector: 'app-vote-bar-chart',
  templateUrl: './vote-bar-chart.component.html',
  styleUrls: ['./vote-bar-chart.component.css']
})
export class VoteBarChartComponent implements OnInit {

  subtitle = 'Bar Chart';
  private margin = {top: 20, right: 20, bottom: 100, left: 50};
  private width: number;
  private height: number;
  private x: any;
  private y: any;
  private svg: any;
  private dateFormat = d3TimeFormat.timeFormat('%Y-%m-%d');

  constructor(private voteDataService: VoteDataService) {
    this.width = 900 - this.margin.left - this.margin.right;
    this.height = 500 - this.margin.top - this.margin.bottom;
  }

  ngOnInit() {
    this.initSvg();
    this.initAxis();
    this.drawAxis();
    this.drawBar();
  }

  private initSvg() {
    this.svg = d3.select('svg')
      .append('g')
      .attr('transform', 'translate(' + this.margin.left + ',' + this.margin.top + ')');
  }

  /**
   * x軸: rangeRoundで対象領域を指定(利用可能領域いっぱい)、要素間の余白を0.35に指定
   * y軸: rangeで対象領域を指定
   * x軸ドメイン: データオブジェクトのvoteDateを使う
   * y軸ドメイン: データオブジェクトのvalueを使う。リニアで指定しているので最小値と最大値さえ渡せば良い。
   ****/
  private initAxis() {
    this.x = d3Scale.scaleBand().rangeRound([0, this.width]).padding(.35);
    this.y = d3Scale.scaleLinear().range([this.height, 0]);
    this.x.domain(this.Votes.map((d) => new Date(d.voteDate)));
    this.y.domain([0, d3Array.max(this.Votes, (d) => d.value)]);
  }

  private drawAxis() {
    /**
     * X軸描画。
     ****/
    this.svg.append('g')
      .attr('class', 'axis axis--x').attr('transform', 'translate(0,' + this.height + ')')
      .call(d3Axis.axisBottom(this.x).tickFormat(this.dateFormat))
      .selectAll('text')
      .style('text-anchor', 'end')
      .attr('dx', '-.8em').attr('dy', '-.55em').attr('transform', 'rotate(-90)');

    /**
     * Y軸描画。
     ****/
    this.svg.append('g')
      .attr('class', 'axis axis--y')
      .call(d3Axis.axisLeft(this.y));
  }

  /**
   * 棒グラフを描画。
   ****/
  private drawBar() {
    this.svg.selectAll('bar')
      .data(this.Votes)
      .enter().append('rect')
      .style('fill', 'DodgerBlue')
      .attr('class', 'bar')
      .attr('x', (d: any) => {
        return this.x(new Date(d.voteDate));
      })
      .attr('y', (d: any) => {
        return this.y(d.value);
      })
      .attr('width', this.x.bandwidth())
      .attr('height', (d: any) => {
        return this.height - this.y(d.value);
      });
  }
}
実行すると以下のような結果が得られます。
さて、これを、DynamoDB のデータを使って表示できるよう、サーバーサイドを準備しましょう。
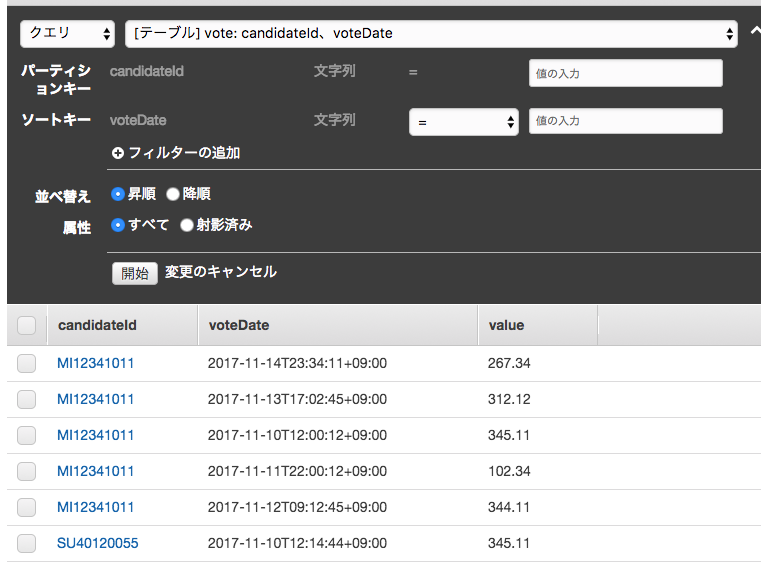
DynamoDB にデータを用意する
すでにデータが保存されている想定で、今回は手で追加してしまいます。 パーティションキーで candidateId を指定し、同一候補者のデータを Query で取得できるようにしておきます。
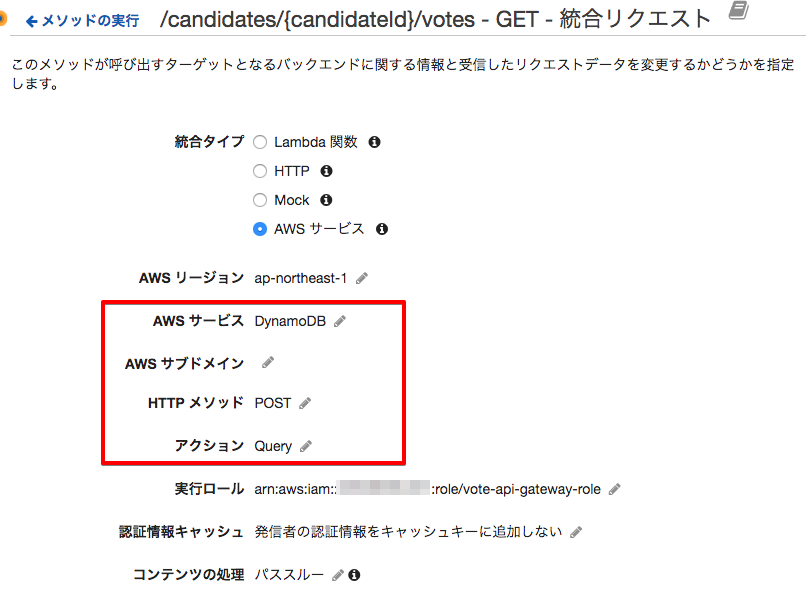
API Gateway で Angular 向けに変換して DynamoDB のデータを返す
DynamoDB のAPIを叩いて得られる結果データは、そのままアプリケーションで利用するには若干パースの手間がかかるため、間に API Gateway を間に置くことにしました。
エンドポイントの作成
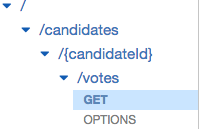
Angular から見て、
- https://xxxxx/candidates/{candidateId}/votes
- 例:https://apigateway.com/candidates/MI12341011/votes
このようなURLで 「特定の立候補者の投票ポイント一覧」 を得られるようにしましょう。{candidateId} を指定することで DynamoDB 上のパーティションキーを指定できるようにします。リソースを下図のように作成してください。
リクエストの定義
リクエストの設定でやることは以下です。
- リクエストパスに含まれる
candidateIdを DynamoDB の Query 操作パラメータにする - DynamoDB への Query および そのリクエストボディを定義する
そして、「本文マッピングテンプレート」へ以下のように設定します。
{
    "TableName": "vote",
    "KeyConditionExpression": "candidateId = :a",
    "ExpressionAttributeValues":{
       ":a": { "S" : "$input.params('candidateId')"}
    }
}
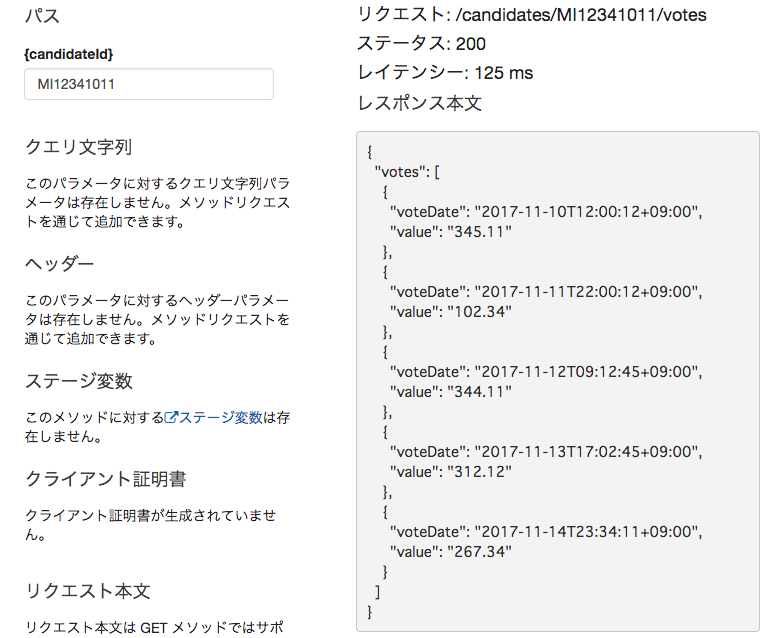
レスポンスの定義
Query 操作の結果を、アプリケーション向けに少し加工します。こちらは、「統合レスポンス>マッピングテンプレート」で設定できます。
#set($inputRoot = $input.path('$'))
{
    "votes": [
        #foreach($elem in $inputRoot.Items) {
            "voteDate": "$elem.voteDate.S",
            "value": "$elem.value.N"
        }#if($foreach.hasNext),#end
	#end
    ]
}
テストを実行して、以下のような結果が得られればOKです。
CORSの有効化
S3上のSPA(CoudFront経由で配信します)からのアクセスになりますので、CORSの設定が必要です。設定詳細については以下の記事を参考に設定してください。
API のデプロイ
ここまでできたら、API をデプロイします。実際にURLを叩いてみて、JSONが取得できるか試してみましょう。
Angular で ローカルデータを使う代わりにHTTPリクエストする
サーバーサイドの準備ができましたのでアプリケーション側に戻ります。現在、プログラム内にハードコードした配列を利用している状況ですので、Angular の Service 機能を使って HTTP 経由で先程のJSONを取得するよう修正します。
Service の作成と投票データ取得先の変更
import {Injectable} from '@angular/core';
import {Http} from '@angular/http';
import {Vote} from './data';

@Injectable()
export class VoteDataService {

  private voteBase = 'https://xxxxxxxxxx.execute-api.ap-northeast-1.amazonaws.com/v1/candidates';
  private headers = new Headers({'Content-Type': 'application/json'});

  constructor(private http: Http) {
  }

  getVotes(candidateId: string): Promise<Vote[]> {
    return this.http.get(this.voteUrl(candidateId), this.headers)
      .toPromise()
      .then(response => response.json().votes as Vote[])
      .catch(this.handleError);
  }

  private voteUrl(candidateId: string): string {
    return `${this.voteBase}/${candidateId}/votes`;
  }

  private handleError(error: any): Promise<any> {
    console.error('An error occurred', error);
    return Promise.reject(error.message || error);
  }
}
Component 側は、Service 経由で取得した Vote を利用するようにします。
ngOnInit() {
  this.initData().then(() => {
    this.initSvg();
    this.initAxis();
    this.drawAxis();
    this.drawBar();
  });
}

private initData(): Promise<Vote[]> {
  return this.voteDataService.getVotes('MI12341011').then(votes => this.Votes = votes);
}
SPA のデプロイ
作成した Angular アプリケーションは、S3 にアップロードし、CloudFront を介してホスティングします。具体的な手順については以下を参考ください。
SPA を使ってみる
CloudFront で配信したアプリケーションにアクセスしてみます。裏側で API Gateway へアクセスし、DynamoDB のデータが取得できているようです。
ここで、DynamoDB にデータを追加してみます。
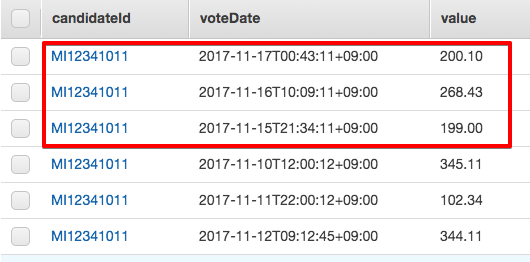
グラフを更新してみると、追加した分だけバーも増えていることがわかります。データの追加に対応することができました。
まとめ
DynamoDB と API Gateway を使って、DynamoDB のデータを取得するAPIを定義することができました。また、このレスポンス値を使って、S3に配備した AngularとD3.js製の SPA によって可視化することができました。
以前は、サーバーレスによるファイルアップロードシステムを作りました。今回はAWS上のデータを利用するパターンです。両者を組み合わせれば、データのアップロードから可視化までサーバーレスでできそうです。また実際に構築してみてまとめてみたいと思います。
ソースコード
バージョン情報
| 利用ツール・ライブラリ | バージョン |
|---|---|
| angular-core | 4.2.4 |
| d3 | 4.11.0 |