Amazon Managed Grafana で v10.4 から v12.4 へのインプレースアップグレードを試してみた

先日 Amazon Managed Grafana が v10.4 から v12.4 へのインプレースアップグレードに対応しました。
移行時の注意点をまとめつつ、インプレースアップグレードによる移行を実際に試してみます。
Grafana v12 について
Grafana v12 で追加された機能や、変更点は下記ドキュメントにまとまっています。
目玉機能としては、Grafana Drilldown を利用したクエリレス探索や、ダッシュボードのレンダリングエンジンの Scenes ライブラリベースへの刷新でしょうか。
下記ブログでは、各機能を実際に試してみた画面も紹介されているのでこちらも是非ご参照下さい。
破壊的変更まとめ
特に重要な破壊的変更としては、下記が挙げられます。
- Legacy alerting の非サポート化
- AngularJS プラグインの非サポート化
- API キーの非サポート化
- Alert rule ごとのクエリ評価結果が 500 件に制限
- ワークスペースごとの注釈(Annotation)数が 300 万件に制限
Legacy alerting の非サポート化
Legacy alerting はアラートがダッシュボードのパネルと密接に結びついていたのに対し、Grafana Alerting では独立した機能になっています。
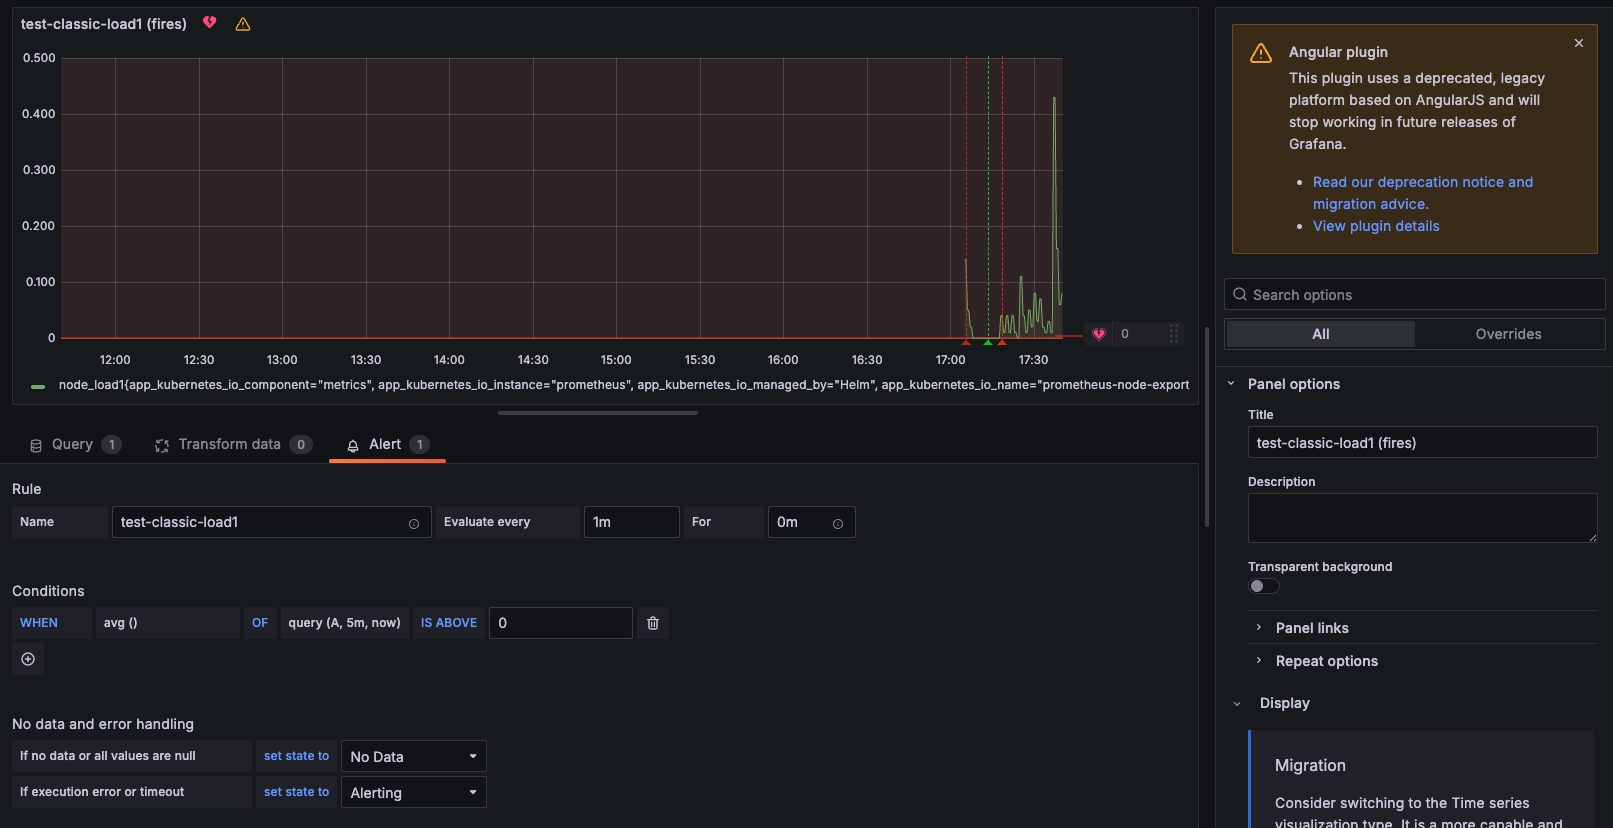
Legacy alerting はパネル内の「Alert」タブから設定可能です。
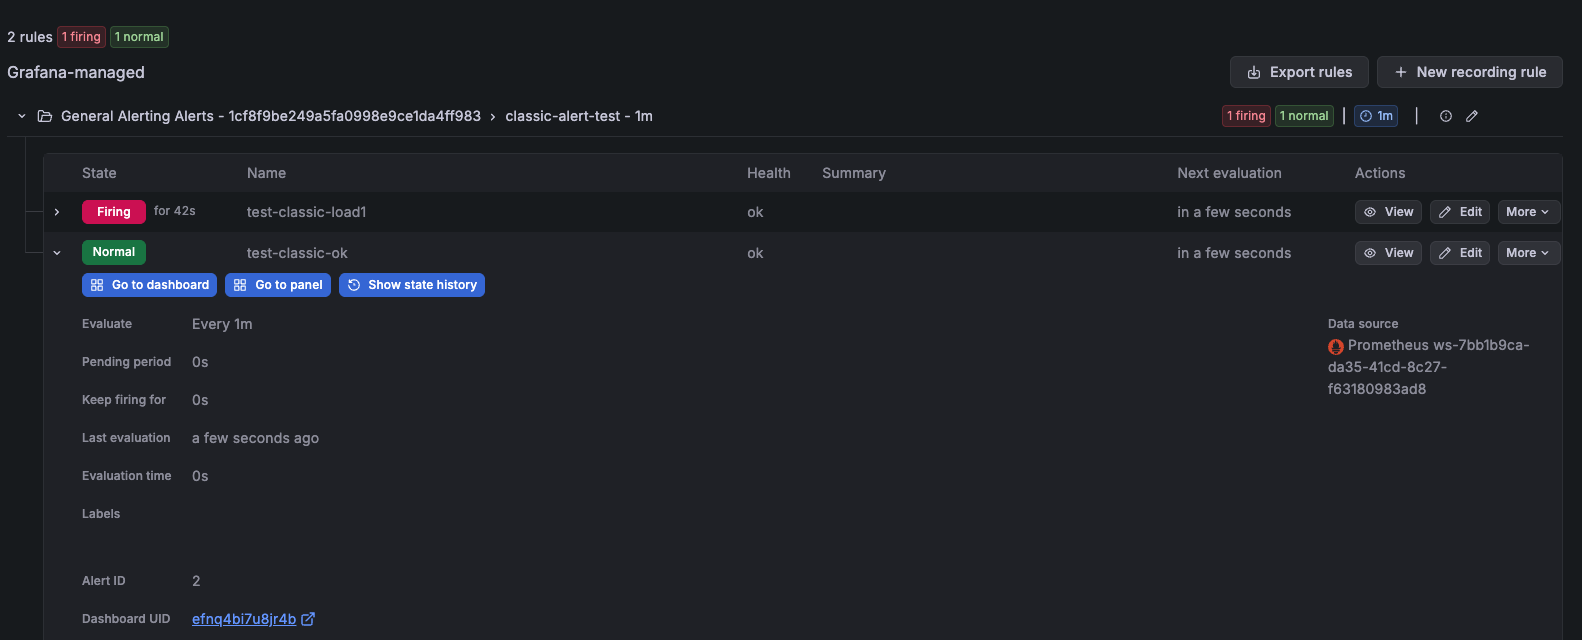
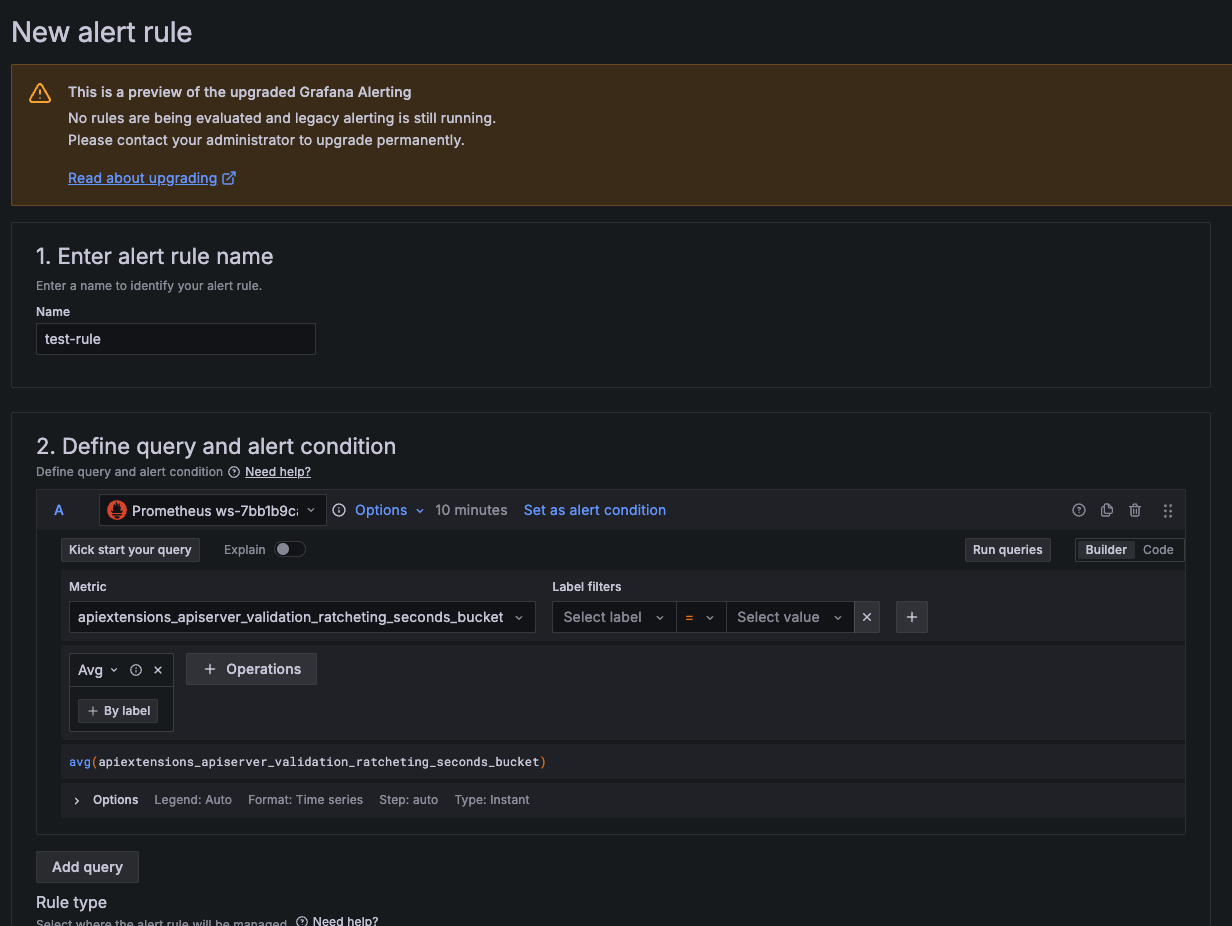
一方で Grafana Alerting では Alerting > Alert rules から直接追加する形になります。
No rules are being evaluated and legacy alerting is still running. と表示されていますが、利用するためには AWS 側の設定を変更する必要があります (後述)。
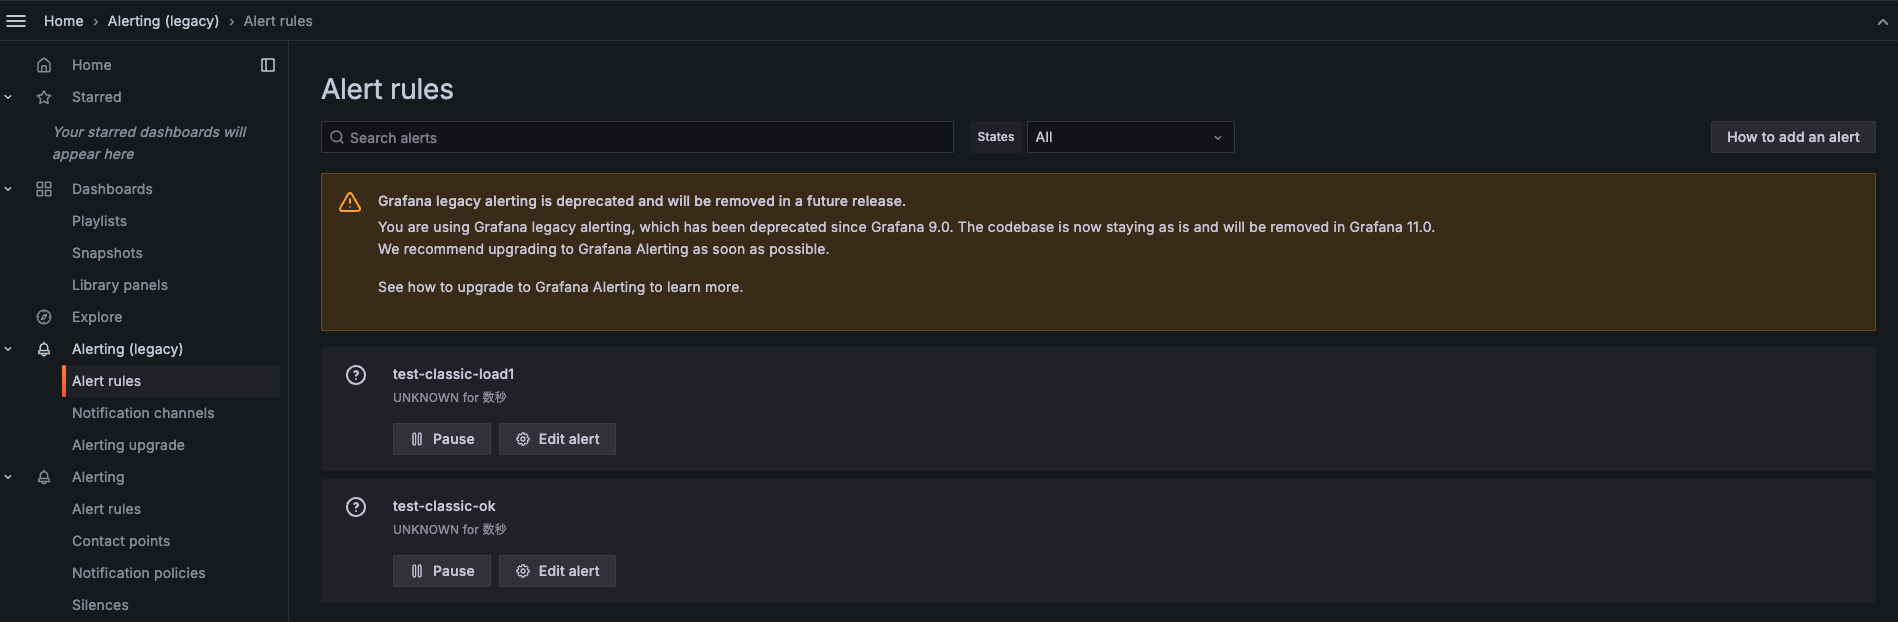
Legacy alerting を利用しているかどうかは Alert (legacy) タブから確認可能です。
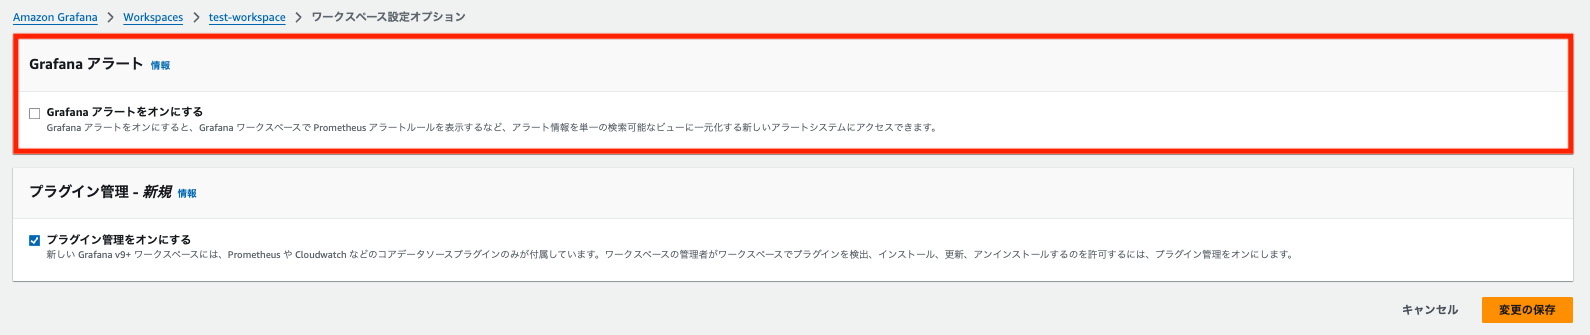
Amazon Managed Grafana v10.4 においては、AWS 側の設定として Grafana Alerting を使うかどうかを選択できます。
デフォルトでは Alert (legacy) を使う状態になっており、v12 へアップグレードする前に明示的に Grafana alerting を有効化しておく必要があります。
AngularJS プラグインの非サポート化
以前 Grafana プラグインは AngularJS を利用して書かれていました。
v5~v7 あたりで React ベースに切り替わり、v9 での非推奨化を経て、v11 で AngularJS サポートがデフォルトで OFF になり、v12 でサポートされなくなりました。
Grafana Labs selected React as the successor to JavaScript based on both its features and popularity among the developer community at the time, which was essential for us to work with the greater open source community to expand the capabilities of Grafana. In Grafana v5 (2018), we began our migration of all Grafana components, and shortly thereafter in Grafana v6 we introduced the React-based platform for plugin development.
In Grafana v9, we formally deprecated support for AngularJS with the intent of removing it in Grafana v10, but that didn’t quite go as planned …
We recognized that it was still too difficult for Grafana users to understand how they might be impacted, so we pushed back the removal by another year, and ramped up our efforts to better surface this dependency, hoping to reduce the chances of users being caught off-guard by the changes. We switched off AngularJS for new Grafana Cloud users, but left AngularJS enabled for existing users and self-managed distributions.
In Grafana 11, which will be generally available in May, we will turn off AngularJS by default in all cloud, open source, and Enterprise instances.
https://grafana.com/blog/removal-of-angularjs-support-in-grafana-what-you-need-to-know/
Amazon Managed Grafana では v10 から v12 になったので、このタイミングでデフォルト OFF 状態を挟まずに AngularJS サポートが無くなった形になります。
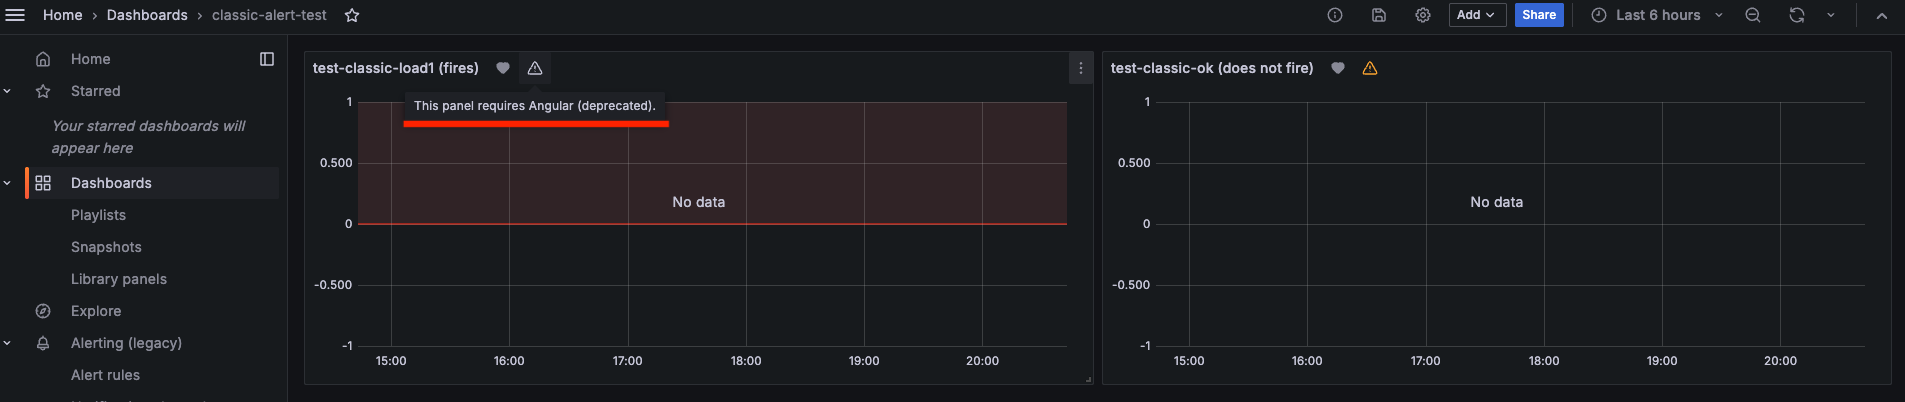
AngularJS を使っている場合、ダッシュボード上で警告が表示されます。
detect-angular-dashboards と呼ばれる確認用の公式ツールもありますが、Amazon Managed Grafana では使えないようでした。
frontend/settings など一部の API が公開されていないので、ERROR: 2026/08/01 23:39:58 run detector: get frontend settings: bad status code: 404 と表示されエラーになってしまいます。
下記のように記載されていますし、Amazon Managed Grafana はサポート外なのでしょう。
Compatible with Grafana OSS, Grafana Enterprise, On-Prem and Grafana Cloud.
https://github.com/grafana/detect-angular-dashboards
API キーの非サポート化
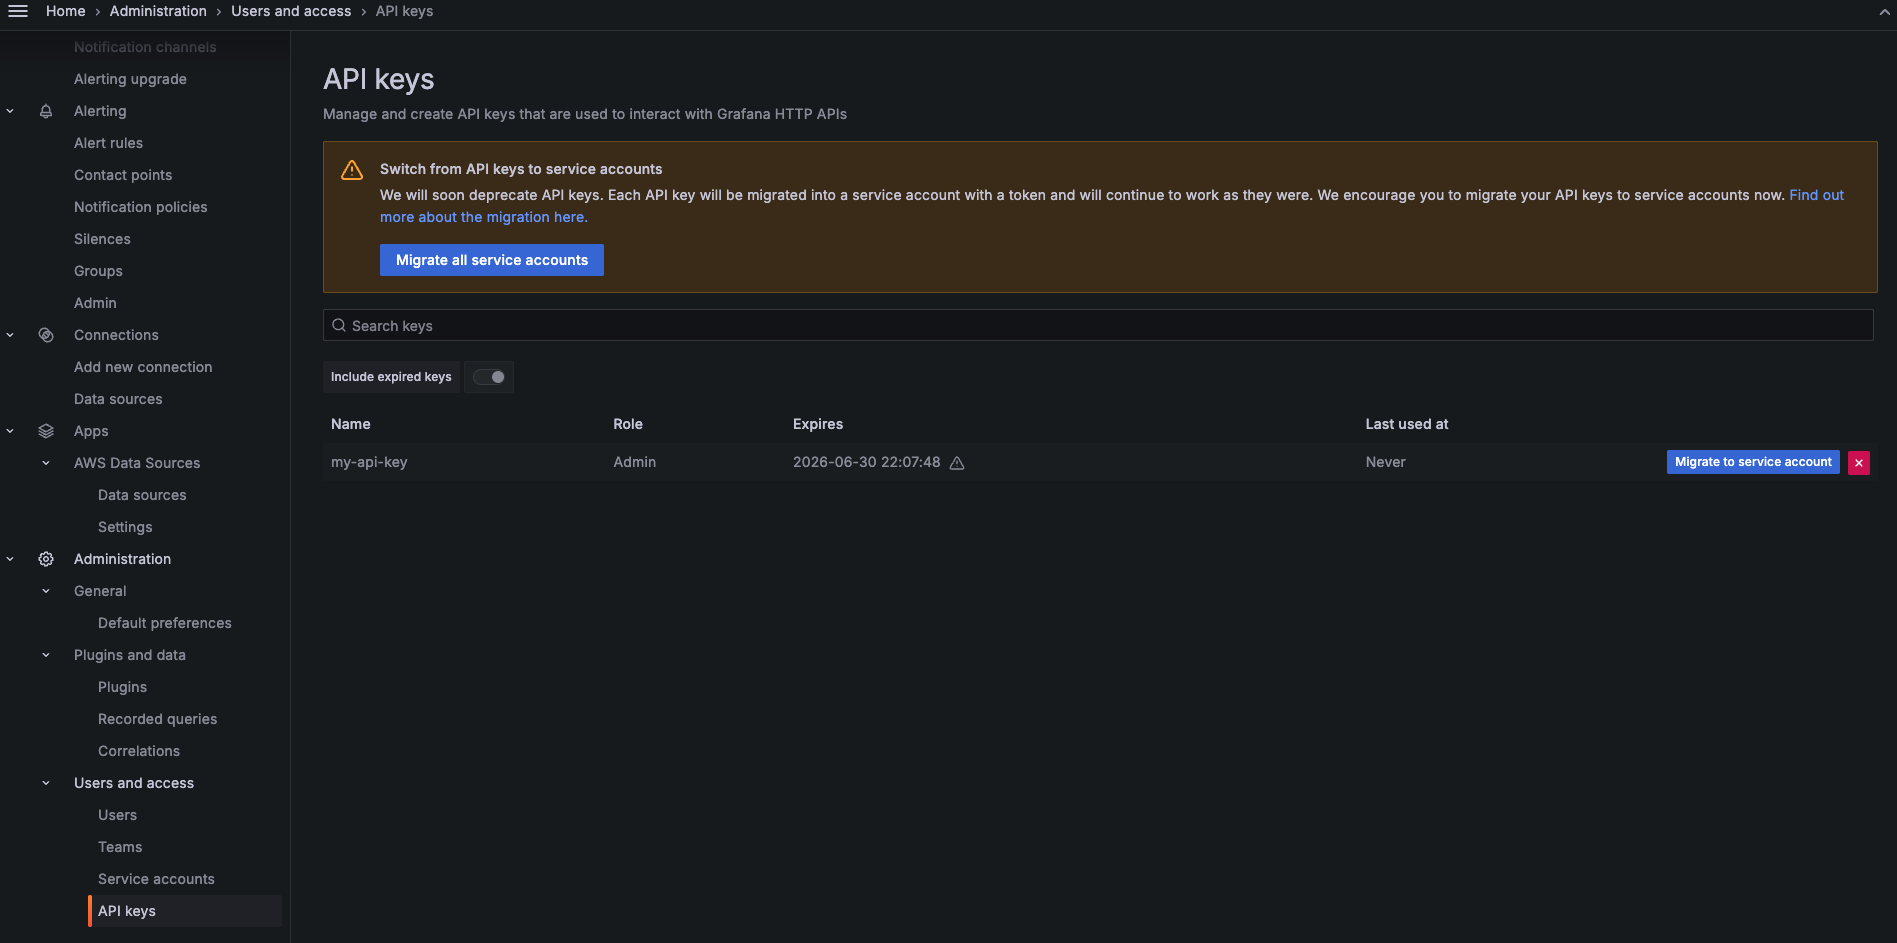
API キーは Service Account へ移行する必要があります。
User and access > API keys から利用している API 一覧を確認して、必要に応じて移行する形になります。
Alert rule ごとのクエリ評価結果が 500 件に制限
アラートを定義する際、あまりに多くのクエリ評価結果が返ってくる場合はエラーになります。
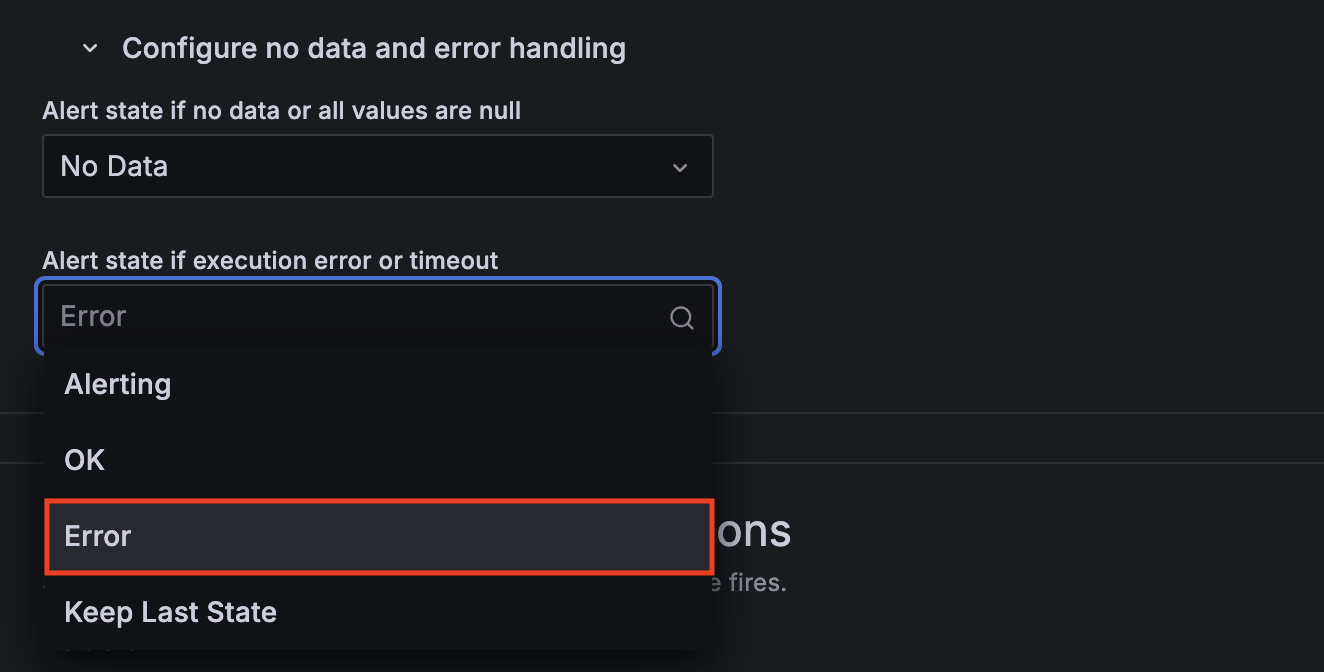
アラートルールあたりのクエリ評価結果の数は 500 に制限されるようになりました。アラートルールの条件クエリがこの制限よりも多くの結果を生成する場合、評価の結果はエラーになります。このエラーが発生したときにアラートを受信するには、アラートルールの設定Errorで Alert state if execution error or timeoutを に設定します。「アラートルールの状態と正常性」を参照してください。
https://docs.aws.amazon.com/ja_jp/grafana/latest/userguide/version-differences.html#version-diff-v12
Alert Rule の Alert state if execution error or timeout が Error (デフォルト) であれば、評価エラー時に DatasourceError という専用のアラートインスタンスが生成されるため気付けるでしょう。
ただし、このインスタンスには alertname = DatasourceError と datasource_uid が追加ラベルとして付与される、つまり alertname が元のルール名から上書きされる点に注意が必要です。
あわせて、クエリ結果由来のラベルも失われるため、それらを参照するテンプレートラベルは正常に動作しなくなります。
alertname やクエリ結果のラベルを条件に通知先を振り分ける Notification policy を組んでいる場合、DatasourceError は意図したルートにマッチせず、デフォルトのルートにフォールバックしてしまう恐れがあります。
ルールに静的に設定した team や severity などのラベルは保持されるので、それらでマッチさせるか、alertname = DatasourceError にマッチする専用のルーティングルールを別途用意しておくと安全です。
ワークスペースごとの注釈 (Annotation) 数が 300 万件に制限
注釈(Annotation)は、ダッシュボードのグラフ上にイベントを示すマーカーを表示する機能です。
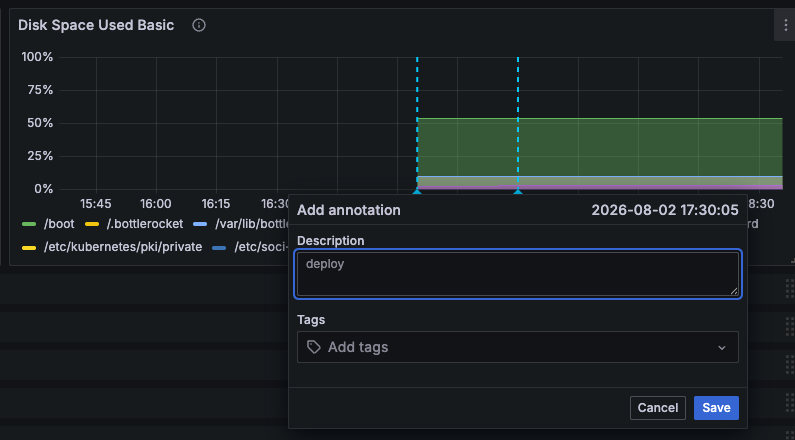
手動でのコメント追加のほか、Alert rule の状態遷移でも自動的に作成される可能性があるため、アラートを多数運用している環境だと知らないうちに件数が積み上がっているかもしれません。
v12 では、この注釈数がワークスペースごとに 300 万件に制限され、上限を超えた場合は古い注釈から自動的に削除されます。
If more than 3 million annotations are created, the oldest annotations will be deleted first.
https://docs.aws.amazon.com/grafana/latest/userguide/version-differences.html
やってみる
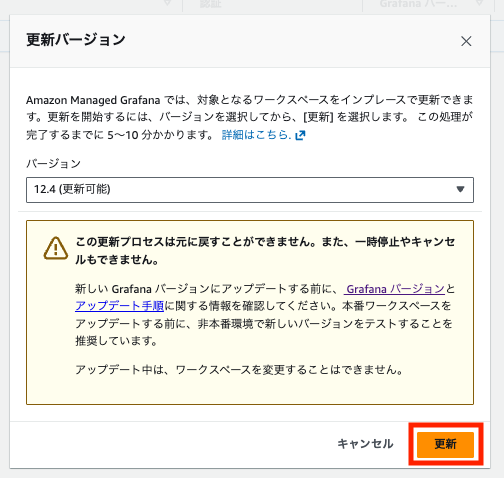
事前に v10.4 の Amazon Managed Grafana ワークスペースを用意して、マネジメントコンソールから更新します。

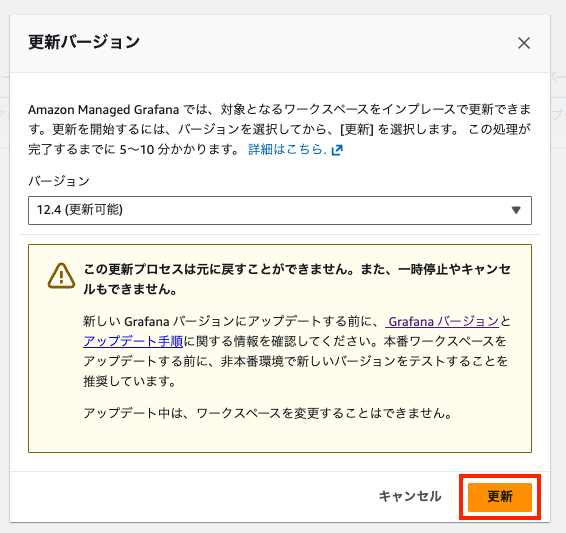
前述の Grafana Alert が有効になっていることを事前に確認する必要があります。
有効になっていない場合、「Grafana alerting must be enabled before upgrading to v12.」というエラーが出て更新が失敗します。

その場合は ワークスペース設定オプション > Grafana アラート から設定を変更します。
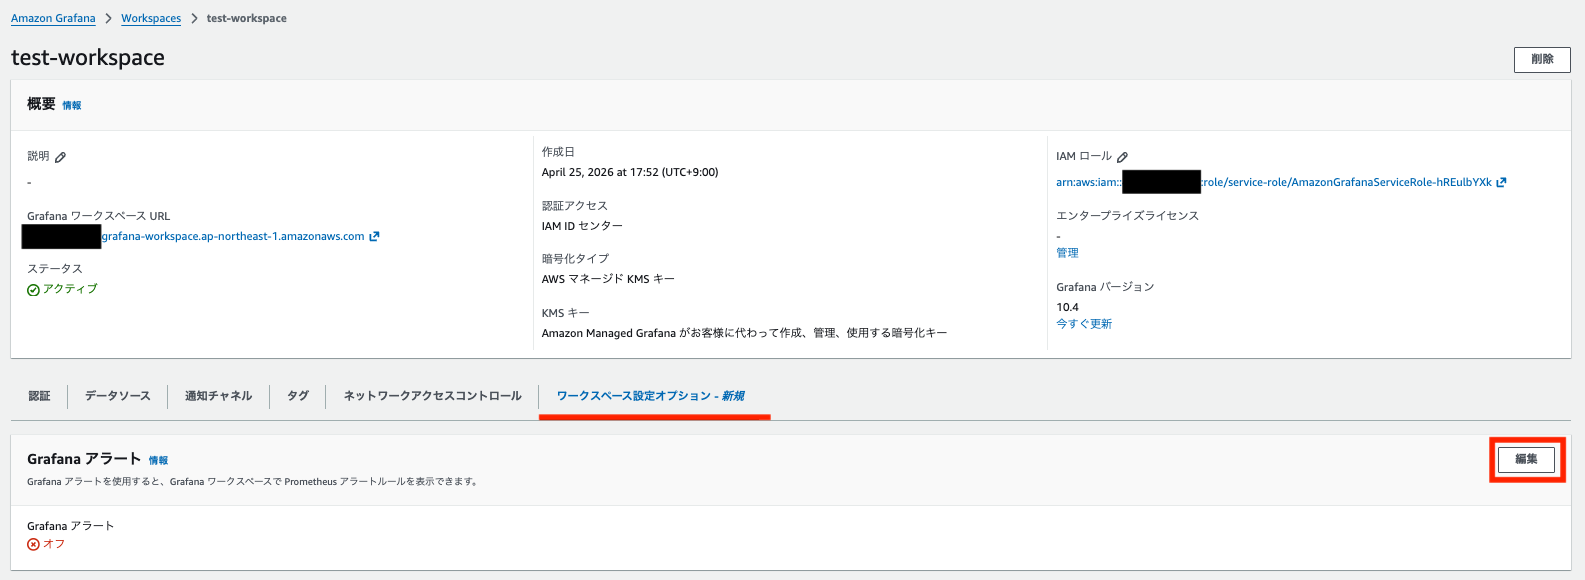
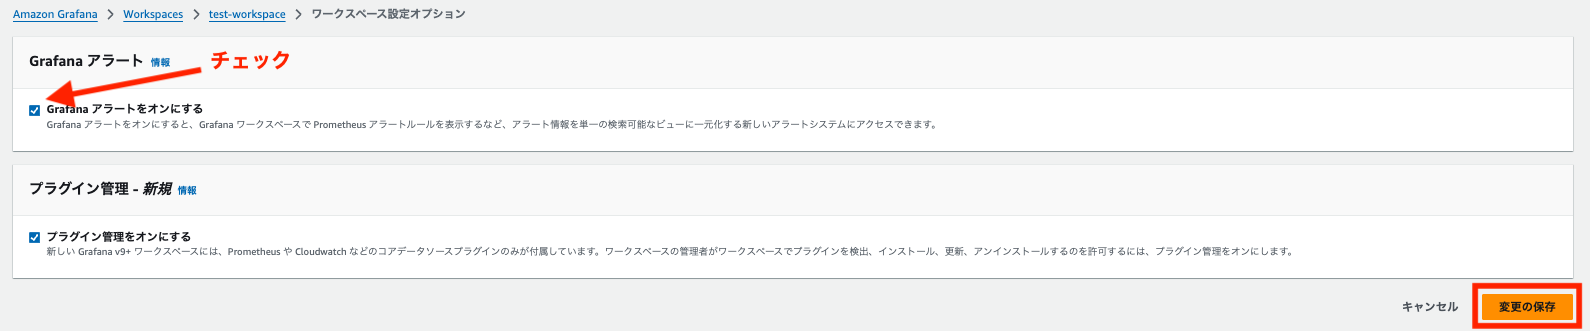
更新後に再度更新を行うと、10 分くらいで更新に成功しました。

また、こちらはインプレースアップデートというより Grafana Alert 有効化に関連する話ですが、Legacy alerting は自動で Grafana Alerting に移行されていました。