CloudWatch が PromQL 対応したので、Amazon Managed Grafana から接続してみた

概要
2026 年 4 月に CloudWatch が OpenTelemetry メトリクスのネイティブサポートと、PromQL によるクエリに対応しました (GA は 6 月)。
従来 Grafana で CloudWatch データソースを使う場合は Metrics Insights など CloudWatch 独自のクエリ構文が必要でしたが、今後は PromQL でメトリクスを扱えるようになります。
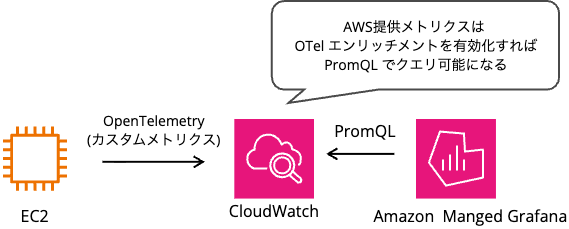
PromQL は AWS 外でも汎用的に利用可能なクエリ言語であるため、後から AWS 外のデータソースを追加した際も同じ構文を利用できるメリットがあります。
また、ラベル付きの時系列データに対して柔軟な集計がしやすい特徴があるため、Metrics Insights よりクエリを書きやすいと感じる可能性が高いです。
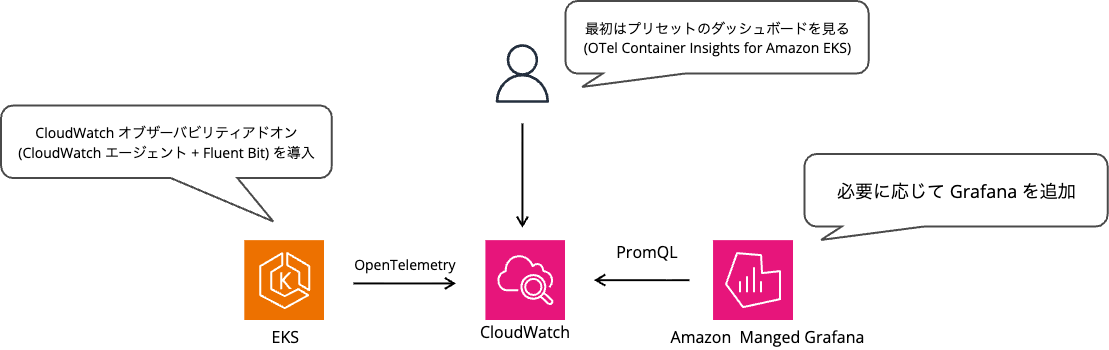
特に EKS では、最初は CloudWatch Container Insights の組み込みダッシュボードを使い、必要に応じて後から Grafana に移行する方針を採用することができるため、メリットが大きいです。
利用する Grafana データソースと制約条件について
CloudWatch で PromQL を利用する場合、https://monitoring.{REGION_NAME}.amazonaws.com に対して Sigv4 認証を使ってクエリを投げれば良いです。
この条件を満たしていれば Amazon Managed Grafana 以外 (セルフホスト、Grafana Cloud) も利用可能です。
また、Grafana データソースとしても CloudWatch データソースと、Amazon Managed Service for Prometheus データソース (AMP データソース) の両方を使うことができます。
Amazon Managed Service for Prometheus を利用しているわけでは無いのに AMP データソースを使うのは若干ややこしいですが、Sigv4 認証が通れば良いということでしょう。
ただし、対応している Grafana バージョンを利用している場合は CloudWatch データソースを使うことが推奨されます。
We recommend that you use the PromQL query type in the Amazon CloudWatch data source plugin.
https://docs.aws.amazon.com/AmazonCloudWatch/latest/monitoring/CloudWatch-PromQL-Grafana.html
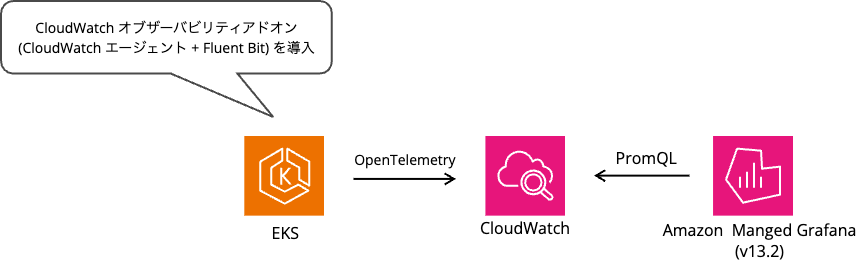
フローにすると下記のようになります。
基本的には CloudWatch データソースを選べば良いものの、2026 年 11 月時点では利用ユーザーが多そうな Amazon Managed Grafana v12.4 を利用している場合は AMP データソースが必要なので注意が必要です。
やってみた
セットアップ
今回は Amazon Managed Grafana (AMG) v13.2 を利用します。
EKS v1.37 に CloudWatch オブザーバビリティアドオンをインストールし、CloudWatch に OpenTelemetry メトリクスを発行します。
下記のように Counter を定義して、リクエストごとにカスタムメトリクスをカウントします。
_meter = _meter_provider.get_meter("demo-app")
REQUESTS = _meter.create_counter(
    "demo_http_requests_total",
    description="HTTP requests",
    unit="{request}",
)
カスタムメトリクスは CloudWatch エージェントに OTLP で転送し、CloudWatch の OTLP メトリクスエンドポイントに送信します。
_OTLP_METRICS_ENDPOINT = os.environ.get(
    "OTEL_EXPORTER_OTLP_METRICS_ENDPOINT",
    "http://cloudwatch-agent.amazon-cloudwatch:4318/v1/metrics",
)
利用した Python アプリケーション
"""Demo app for CloudWatch OTel metrics, logs, and traces.

Metrics: OpenTelemetry SDK → CloudWatch agent OTLP (4318) → CloudWatch OTel Metrics.
Traces: Application Signals auto-instrumentation
(instrumentation.opentelemetry.io/inject-python). A local MeterProvider is used so
ADOT inject cannot replace app metrics.
Logs include the current trace_id when the injected OpenTelemetry SDK is present.
"""

from __future__ import annotations

import asyncio
import json
import logging
import os
import random
import time

from fastapi import FastAPI, Request
from fastapi.responses import JSONResponse, PlainTextResponse
from opentelemetry.exporter.otlp.proto.http.metric_exporter import OTLPMetricExporter
from opentelemetry.sdk.metrics import MeterProvider
from opentelemetry.sdk.metrics.export import PeriodicExportingMetricReader
from opentelemetry.sdk.resources import Resource

_OTLP_METRICS_ENDPOINT = os.environ.get(
    "OTEL_EXPORTER_OTLP_METRICS_ENDPOINT",
    "http://cloudwatch-agent.amazon-cloudwatch:4318/v1/metrics",
)
_EXPORT_INTERVAL_MS = int(os.environ.get("OTEL_METRIC_EXPORT_INTERVAL", "15000"))

# Keep the provider at module scope so the periodic reader is not garbage-collected.
# Do not call metrics.set_meter_provider(): ADOT inject may already own the global.
_meter_provider = MeterProvider(
    resource=Resource.create(
        {
            "service.name": os.environ.get("OTEL_SERVICE_NAME", "demo-app"),
            "service.namespace": "demo-app",
        }
    ),
    metric_readers=[
        PeriodicExportingMetricReader(
            OTLPMetricExporter(endpoint=_OTLP_METRICS_ENDPOINT),
            export_interval_millis=_EXPORT_INTERVAL_MS,
        )
    ],
)
_meter = _meter_provider.get_meter("demo-app")
REQUESTS = _meter.create_counter(
    "demo_http_requests_total",
    description="HTTP requests",
    unit="{request}",
)
LATENCY = _meter.create_histogram(
    "demo_http_request_duration_seconds",
    description="HTTP request duration in seconds",
    unit="s",
)

def _trace_fields() -> dict[str, str]:
    try:
        from opentelemetry import trace

        ctx = trace.get_current_span().get_span_context()
        if ctx is None or not ctx.is_valid:
            return {}
        return {
            "trace_id": format(ctx.trace_id, "032x"),
            "span_id": format(ctx.span_id, "016x"),
        }
    except Exception:
        return {}

class JsonFormatter(logging.Formatter):
    def format(self, record: logging.LogRecord) -> str:
        payload = {
            "level": record.levelname,
            "logger": record.name,
            "message": record.getMessage(),
            **_trace_fields(),
        }
        if record.exc_info:
            payload["exception"] = self.formatException(record.exc_info)
        return json.dumps(payload, ensure_ascii=False)

def configure_logging() -> None:
    handler = logging.StreamHandler()
    handler.setFormatter(JsonFormatter())
    root = logging.getLogger()
    root.handlers.clear()
    root.addHandler(handler)
    root.setLevel(logging.INFO)
    logging.getLogger("uvicorn.access").handlers.clear()

configure_logging()
log = logging.getLogger("demo-app")

app = FastAPI(title="demo-app", docs_url=None, redoc_url=None)

@app.middleware("http")
async def record_metrics(request: Request, call_next):
    started = time.perf_counter()
    response = await call_next(request)
    path = request.url.path
    method = request.method
    status = str(response.status_code)
    REQUESTS.add(1, {"method": method, "path": path, "status": status})
    LATENCY.record(time.perf_counter() - started, {"method": method, "path": path})
    return response

@app.get("/healthz", response_class=PlainTextResponse)
async def healthz() -> str:
    return "ok\n"

@app.get("/")
async def root() -> dict[str, str]:
    log.info("handled GET /")
    return {"service": "demo-app", "status": "ok"}

@app.get("/work")
async def work() -> dict[str, object]:
    delay = random.uniform(0.05, 0.25)
    try:
        from opentelemetry import trace

        tracer = trace.get_tracer("demo-app")
        with tracer.start_as_current_span("do-work") as span:
            span.set_attribute("work.delay_seconds", delay)
            await asyncio.sleep(delay)
    except ImportError:
        await asyncio.sleep(delay)
    log.info("completed work delay=%.3f", delay)
    return {"ok": True, "delay": round(delay, 3)}

@app.get("/error")
async def error() -> JSONResponse:
    log.error("simulated error")
    return JSONResponse({"error": "boom"}, status_code=500)
アクセス許可タイプは「サービスマネージド」を選択し、権限付与は AMG に任せます。
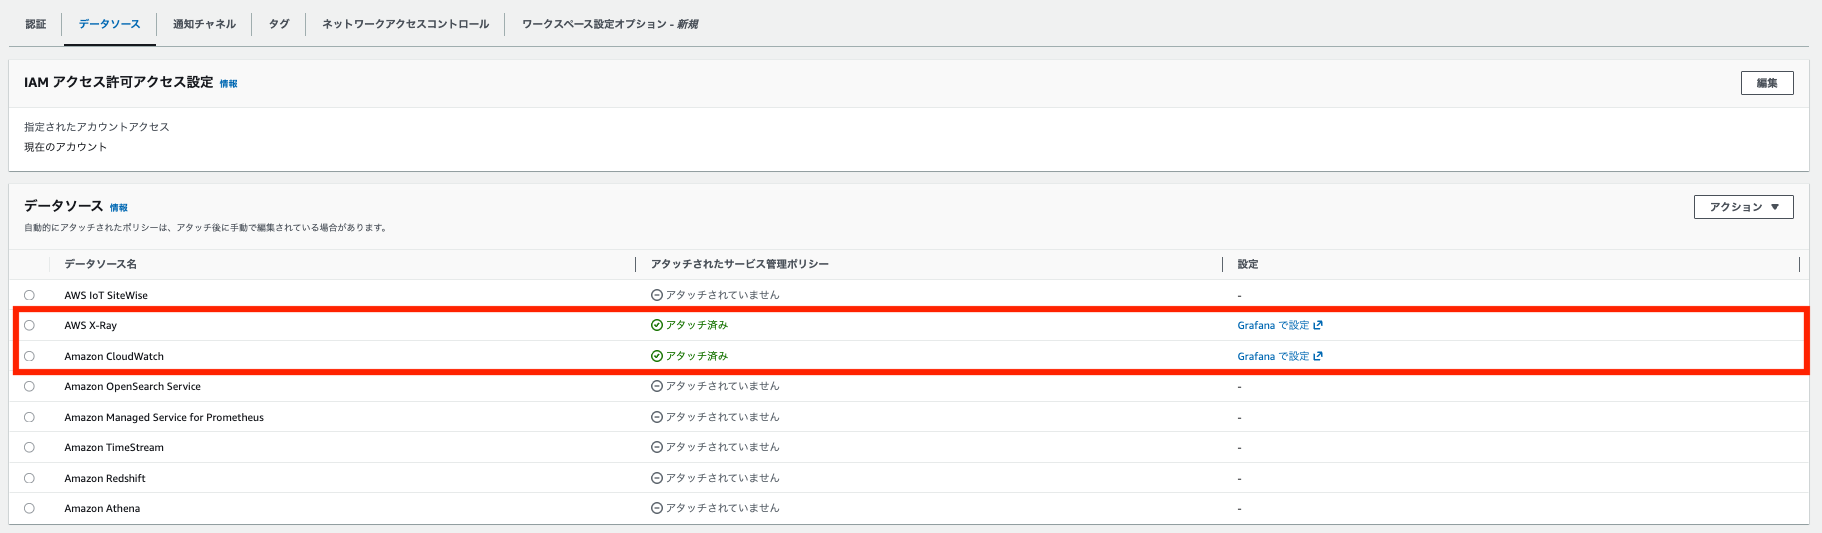
PromQL でメトリクスをクエリするだけなら AWS X-Ray は不要ですが、今回はついでにトレースも見たいので付与しておきます。
セルフホスト版などで CloudWatch データソースを利用する場合、権限としては cloudwatch:GetMetricData と cloudwatch:ListMetrics が必要になります。
IAM prerequisites — the IAM principal that the CloudWatch data source uses, such as the Amazon Managed Grafana workspace IAM role, must have both cloudwatch:GetMetricData (required for instant and range queries) and cloudwatch:ListMetrics (required for metric, label key, and label value autocomplete). For details, see IAM permissions for PromQL.
https://docs.aws.amazon.com/AmazonCloudWatch/latest/monitoring/CloudWatch-PromQL-Grafana.html#CloudWatch-PromQL-Querying-CloudWatch-datasource
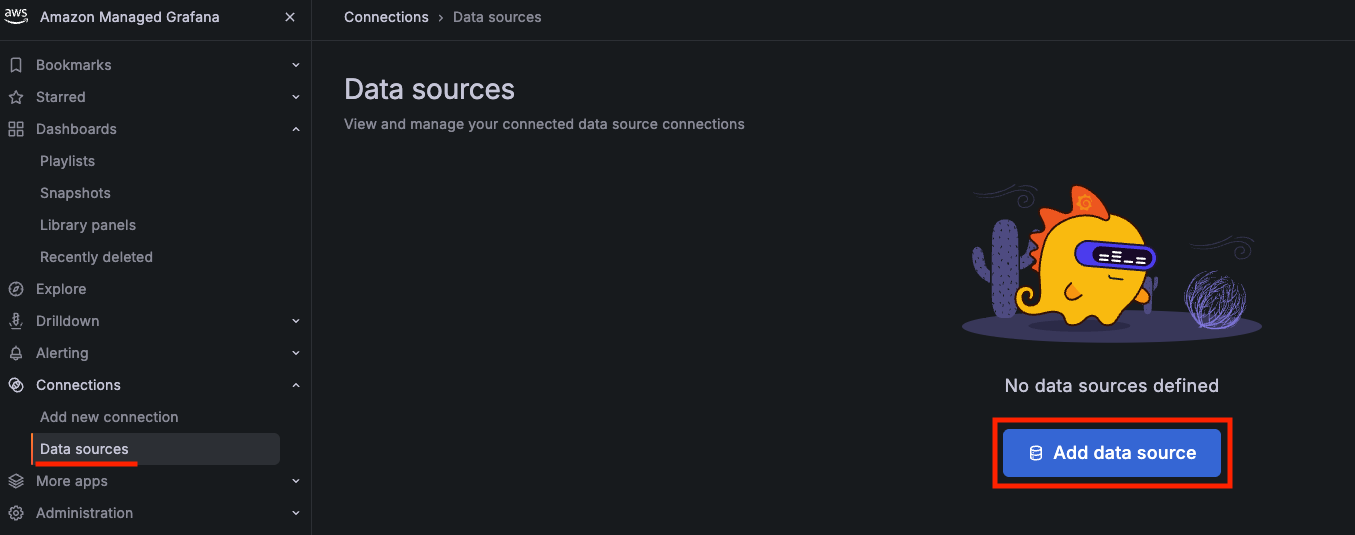
Grafana のコンソールにログインして、data source を追加します。
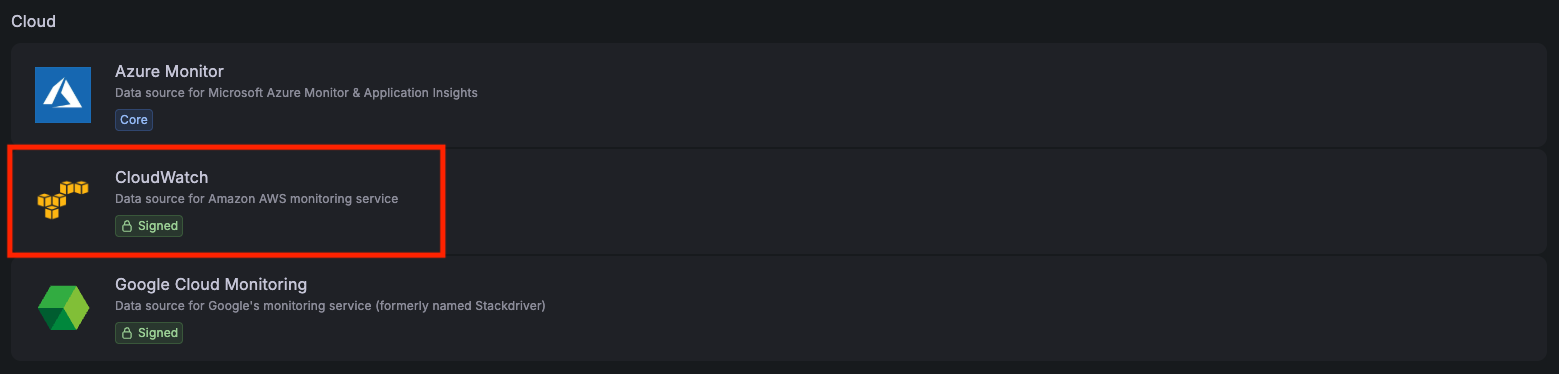
CloudWatch をクリックします。
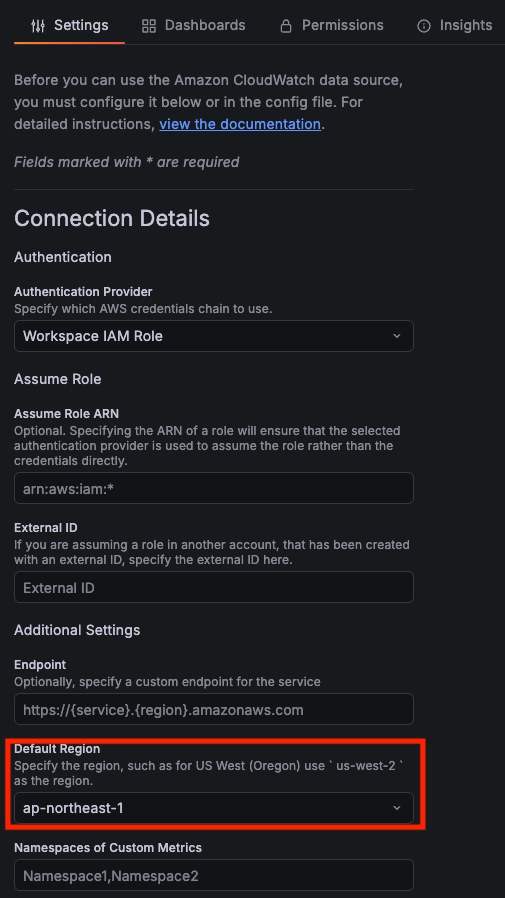
AMG なので、Authentication は Workspace IAM Role のままで問題ありません。
Additional Settings > Endpoint は何も入力せずにデフォルトの https://{service}.{region}.amazonaws.com とします。
Default Region は ap-northeast-1 (メトリクスが溜まっているリージョン) を指定します。
「Save & Test」をクリックします。
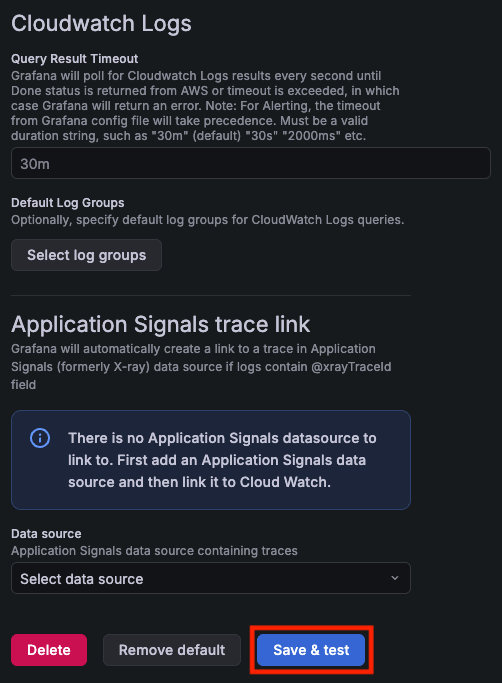
最初 Additional Settings > Endpoint に https://monitoring.{REGION_NAME}.amazonaws.com を入力する必要があるのかと思ったのですが、指定すると CloudWatch logs query 側で CloudWatch logs query failed: operation error CloudWatch Logs: DescribeLogGroups, https response error StatusCode: 404 というエラーがでました。

デフォルトのままにしておけば、ログとメトリクスのそれぞれのエンドポイントに良い感じに振り分けてくれるようです。

ダッシュボード追加
ダッシュボードを追加していきます。
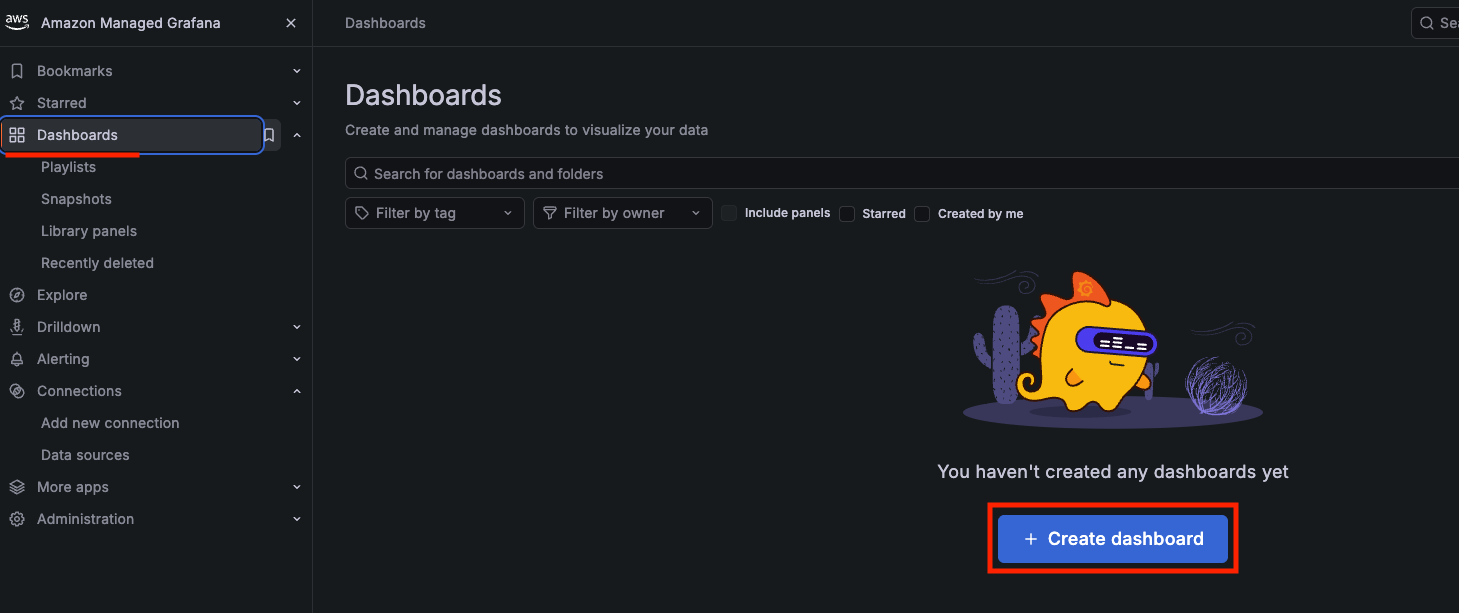
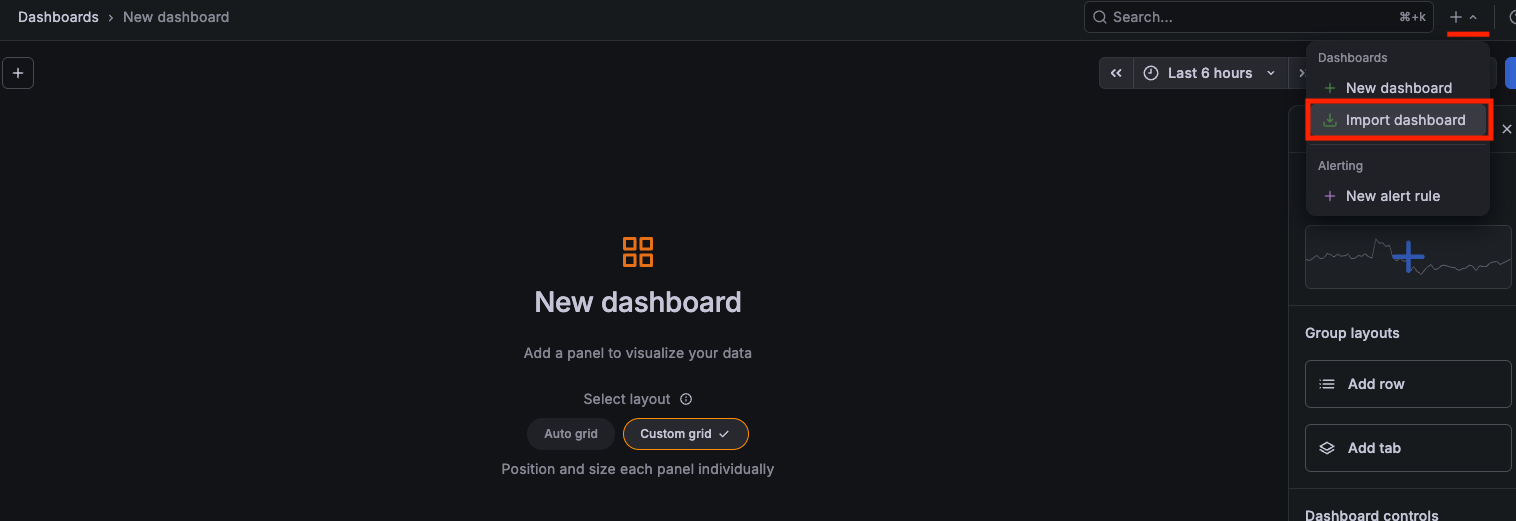
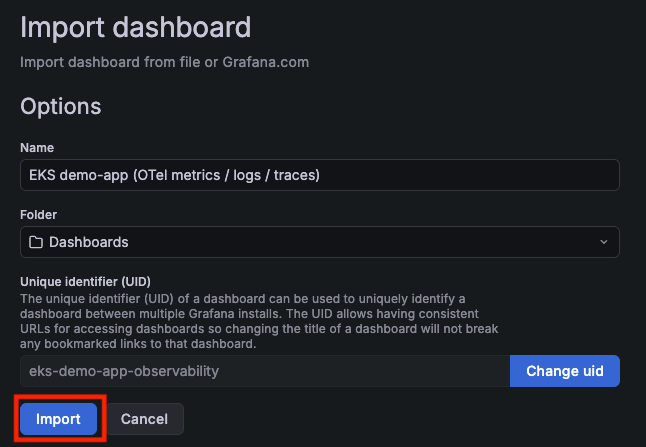
今回はあらかじめ JSON を用意しおいたのでインポートを行います。
一部を抜粋すると下記のようになります。
cloudwatch datasource に対して、promqlExpression を指定してクエリします。
    {
      "datasource": {
        "type": "cloudwatch",
        "uid": "${datasource}"
      },
      "fieldConfig": {
        "defaults": {
          "unit": "reqps"
        },
        "overrides": []
      },
      "gridPos": {
        "h": 8,
        "w": 12,
        "x": 0,
        "y": 0
      },
      "id": 1,
      "title": "HTTP requests / sec (CloudWatch PromQL)",
      "type": "timeseries",
      "targets": [
        {
          "datasource": {
            "type": "cloudwatch",
            "uid": "${datasource}"
          },
          "queryMode": "Metrics",
          "metricQueryType": 2,
          "metricEditorMode": 1,
          "promqlExpression": "sum(rate(demo_http_requests_total[5m]))",
          "range": true,
          "instant": false,
          "legendFormat": "requests",
          "region": "default",
          "refId": "A"
        }
      ]
    },
ログはこれまで通り、Logs Insights を利用します。
    {
      "datasource": {
        "type": "cloudwatch",
        "uid": "${datasource}"
      },
      "gridPos": {
        "h": 12,
        "w": 24,
        "x": 0,
        "y": 16
      },
      "id": 5,
      "title": "Application logs (filter by trace_id in Explore if needed)",
      "type": "logs",
      "targets": [
        {
          "datasource": {
            "type": "cloudwatch",
            "uid": "${datasource}"
          },
          "queryMode": "Logs",
          "expression": "fields @timestamp, @message | filter kubernetes.namespace_name = \"demo-app\" or @logStream like /demo-app/ | sort @timestamp desc | limit 50",
          "logGroupNames": ["/aws/containerinsights/$cluster/application"],
          "refId": "A",
          "region": "default"
        }
      ]
    }
  ],
利用したダッシュボード
{
  "annotations": {
    "list": [
      {
        "builtIn": 1,
        "datasource": {
          "type": "grafana",
          "uid": "-- Grafana --"
        },
        "enable": true,
        "hide": true,
        "iconColor": "rgba(0, 211, 255, 1)",
        "name": "Annotations & Alerts",
        "type": "dashboard"
      }
    ]
  },
  "editable": true,
  "fiscalYearStartMonth": 0,
  "graphTooltip": 1,
  "id": null,
  "links": [],
  "liveNow": false,
  "panels": [
    {
      "datasource": {
        "type": "cloudwatch",
        "uid": "${datasource}"
      },
      "fieldConfig": {
        "defaults": {
          "unit": "reqps"
        },
        "overrides": []
      },
      "gridPos": {
        "h": 8,
        "w": 12,
        "x": 0,
        "y": 0
      },
      "id": 1,
      "title": "HTTP requests / sec (CloudWatch PromQL)",
      "type": "timeseries",
      "targets": [
        {
          "datasource": {
            "type": "cloudwatch",
            "uid": "${datasource}"
          },
          "queryMode": "Metrics",
          "metricQueryType": 2,
          "metricEditorMode": 1,
          "promqlExpression": "sum(rate(demo_http_requests_total[5m]))",
          "range": true,
          "instant": false,
          "legendFormat": "requests",
          "region": "default",
          "refId": "A"
        }
      ]
    },
    {
      "datasource": {
        "type": "cloudwatch",
        "uid": "${datasource}"
      },
      "fieldConfig": {
        "defaults": {
          "unit": "s"
        },
        "overrides": []
      },
      "gridPos": {
        "h": 8,
        "w": 12,
        "x": 12,
        "y": 0
      },
      "id": 2,
      "title": "Request latency (CloudWatch PromQL)",
      "type": "timeseries",
      "targets": [
        {
          "datasource": {
            "type": "cloudwatch",
            "uid": "${datasource}"
          },
          "queryMode": "Metrics",
          "metricQueryType": 2,
          "metricEditorMode": 1,
          "promqlExpression": "histogram_quantile(0.95, {\"demo_http_request_duration_seconds\", \"@resource.service.name\"=\"demo-app\"})",
          "range": true,
          "instant": false,
          "legendFormat": "p95",
          "region": "default",
          "refId": "A"
        },
        {
          "datasource": {
            "type": "cloudwatch",
            "uid": "${datasource}"
          },
          "queryMode": "Metrics",
          "metricQueryType": 2,
          "metricEditorMode": 1,
          "promqlExpression": "histogram_avg({\"demo_http_request_duration_seconds\", \"@resource.service.name\"=\"demo-app\"})",
          "range": true,
          "instant": false,
          "legendFormat": "mean",
          "region": "default",
          "refId": "B"
        }
      ]
    },
    {
      "datasource": {
        "type": "cloudwatch",
        "uid": "${datasource}"
      },
      "fieldConfig": {
        "defaults": {
          "unit": "short"
        },
        "overrides": []
      },
      "gridPos": {
        "h": 8,
        "w": 12,
        "x": 0,
        "y": 8
      },
      "id": 3,
      "title": "Container CPU (OTel Container Insights)",
      "type": "timeseries",
      "targets": [
        {
          "datasource": {
            "type": "cloudwatch",
            "uid": "${datasource}"
          },
          "queryMode": "Metrics",
          "metricQueryType": 2,
          "metricEditorMode": 1,
          "promqlExpression": "sum(rate(container_cpu_usage_seconds_total[5m]))",
          "range": true,
          "instant": false,
          "legendFormat": "cpu",
          "region": "default",
          "refId": "A"
        }
      ]
    },
    {
      "datasource": {
        "type": "grafana-x-ray-datasource",
        "uid": "${xray}"
      },
      "gridPos": {
        "h": 8,
        "w": 12,
        "x": 12,
        "y": 8
      },
      "id": 4,
      "title": "X-Ray traces (demo-app)",
      "type": "table",
      "targets": [
        {
          "datasource": {
            "type": "grafana-x-ray-datasource",
            "uid": "${xray}"
          },
          "queryType": "getTraceSummaries",
          "query": "service(\"demo-app\")",
          "region": "default",
          "refId": "A"
        }
      ]
    },
    {
      "datasource": {
        "type": "cloudwatch",
        "uid": "${datasource}"
      },
      "gridPos": {
        "h": 12,
        "w": 24,
        "x": 0,
        "y": 16
      },
      "id": 5,
      "title": "Application logs (filter by trace_id in Explore if needed)",
      "type": "logs",
      "targets": [
        {
          "datasource": {
            "type": "cloudwatch",
            "uid": "${datasource}"
          },
          "queryMode": "Logs",
          "expression": "fields @timestamp, @message | filter kubernetes.namespace_name = \"demo-app\" or @logStream like /demo-app/ | sort @timestamp desc | limit 50",
          "logGroupNames": ["/aws/containerinsights/$cluster/application"],
          "refId": "A",
          "region": "default"
        }
      ]
    }
  ],
  "refresh": "30s",
  "schemaVersion": 41,
  "tags": ["eks", "demo-app", "cloudwatch", "otel", "promql", "xray"],
  "templating": {
    "list": [
      {
        "hide": 0,
        "includeAll": false,
        "label": "CloudWatch (PromQL / logs)",
        "name": "datasource",
        "options": [],
        "query": "cloudwatch",
        "refresh": 1,
        "regex": "",
        "type": "datasource"
      },
      {
        "hide": 0,
        "includeAll": false,
        "label": "X-Ray",
        "name": "xray",
        "options": [],
        "query": "grafana-x-ray-datasource",
        "refresh": 1,
        "regex": "",
        "type": "datasource"
      },
      {
        "current": {
          "text": "eks-obs-demo",
          "value": "eks-obs-demo"
        },
        "hide": 0,
        "label": "Cluster",
        "name": "cluster",
        "query": "eks-obs-demo",
        "type": "textbox"
      }
    ]
  },
  "time": {
    "from": "now-1h",
    "to": "now"
  },
  "timepicker": {},
  "timezone": "browser",
  "title": "EKS demo-app (OTel metrics / logs / traces)",
  "uid": "eks-demo-app-observability",
  "version": 3,
  "weekStart": ""
}
インポートします。
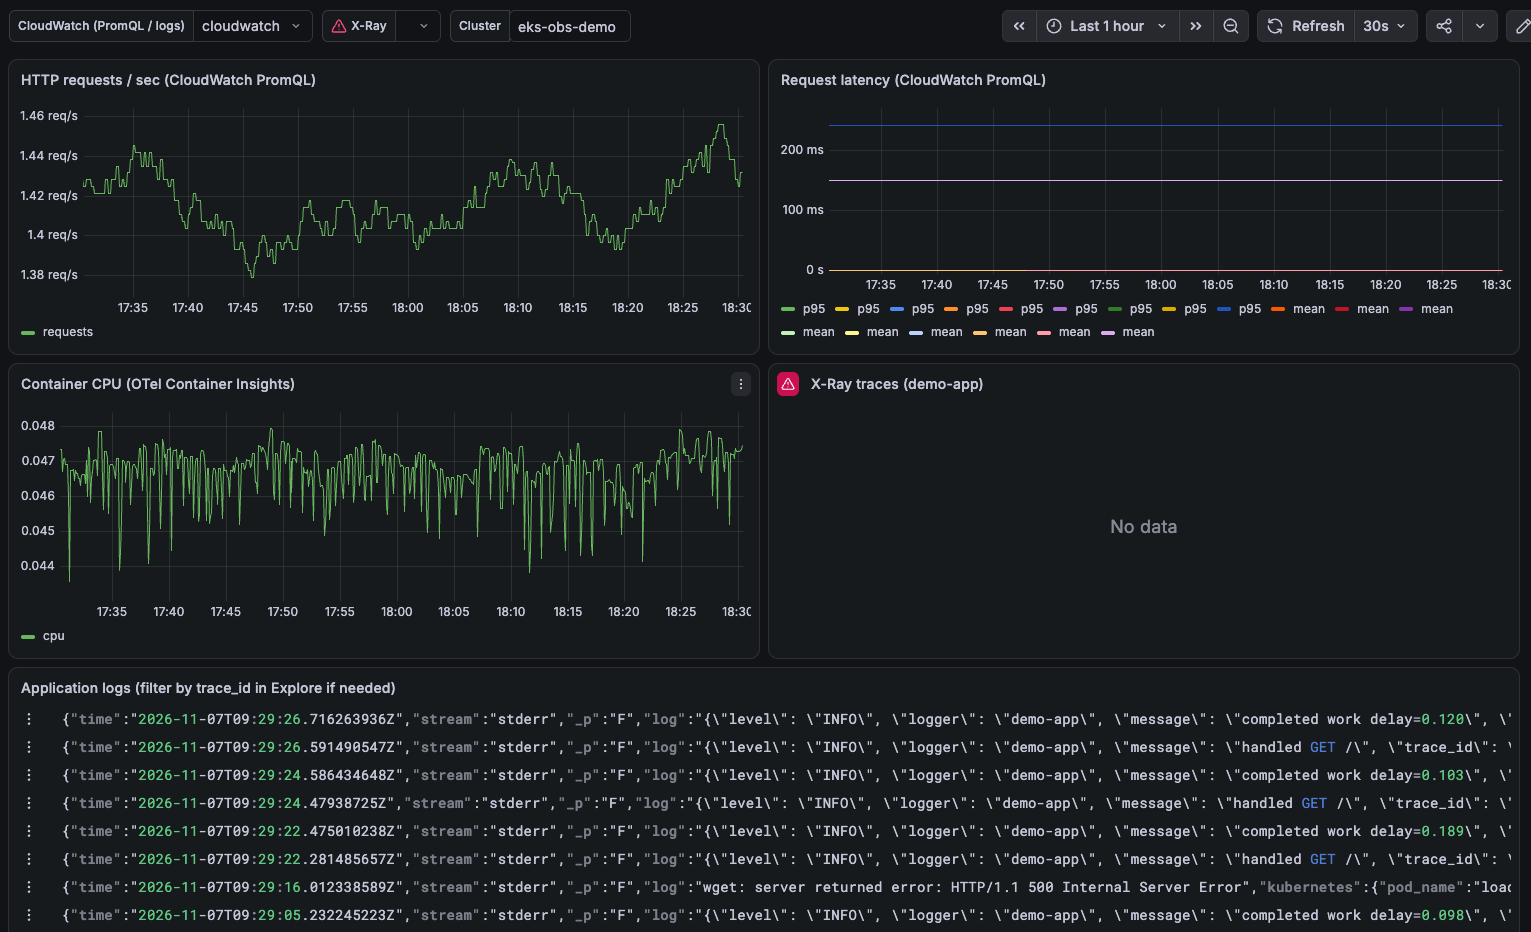
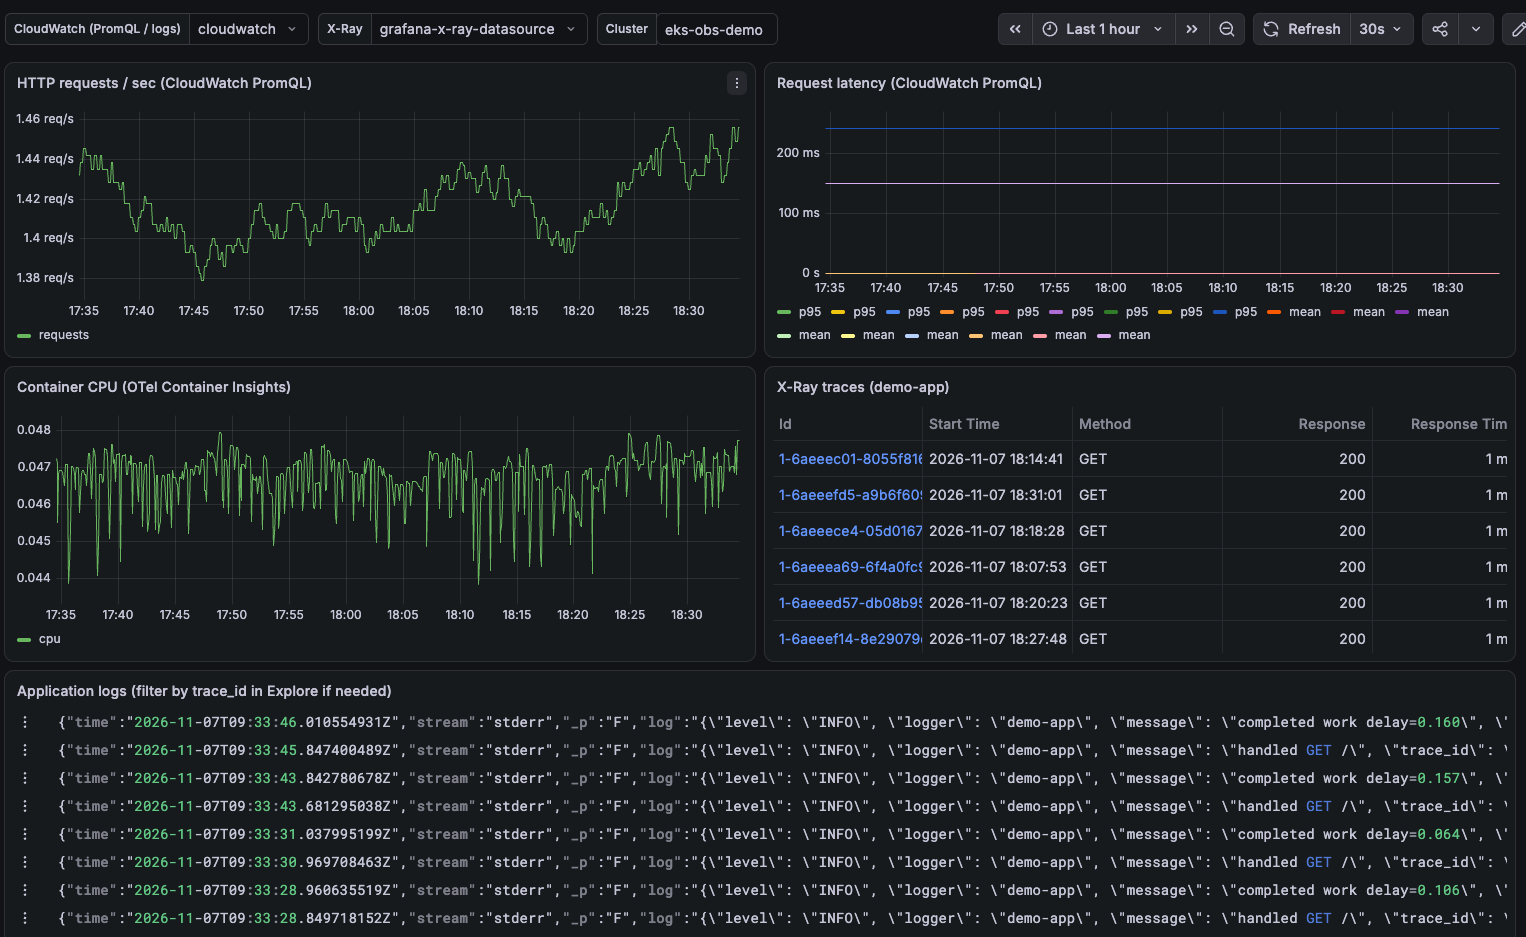
良い感じにダッシュボードが表示されました。
トレースは Application Signals データソースをインストールしていないので表示されておらず、後ほど設定します。
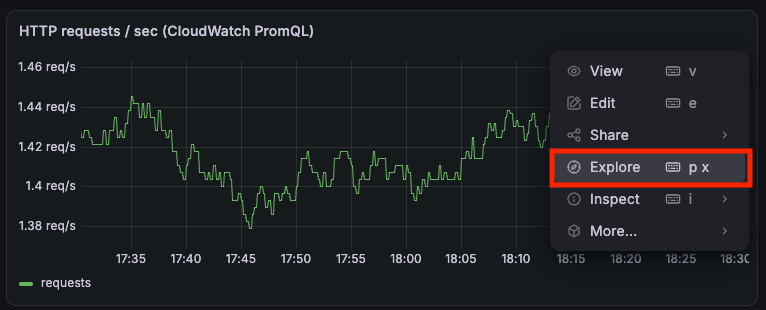
先に各パネルの見え方をもう少し深ぼってみます。
PromQL で定義できていますね。
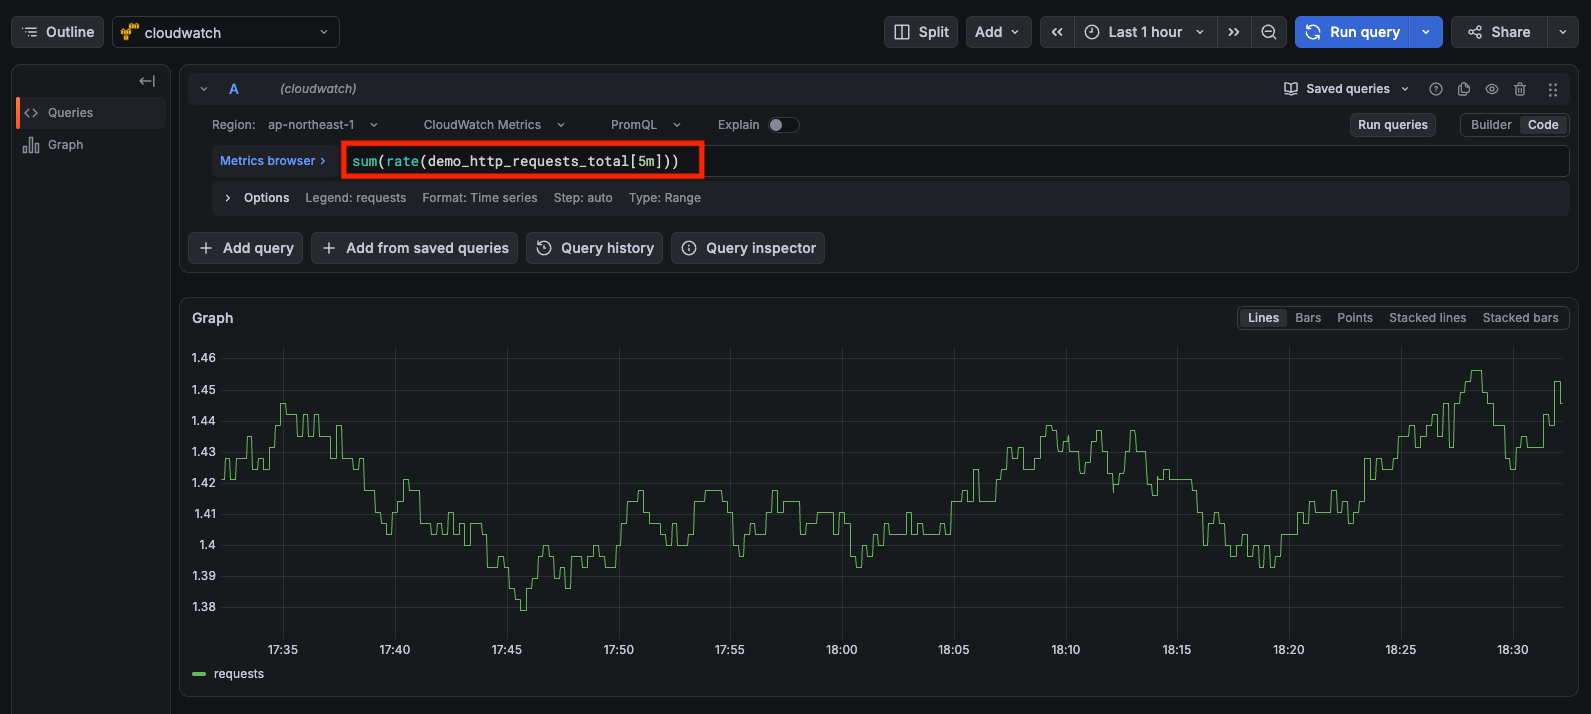
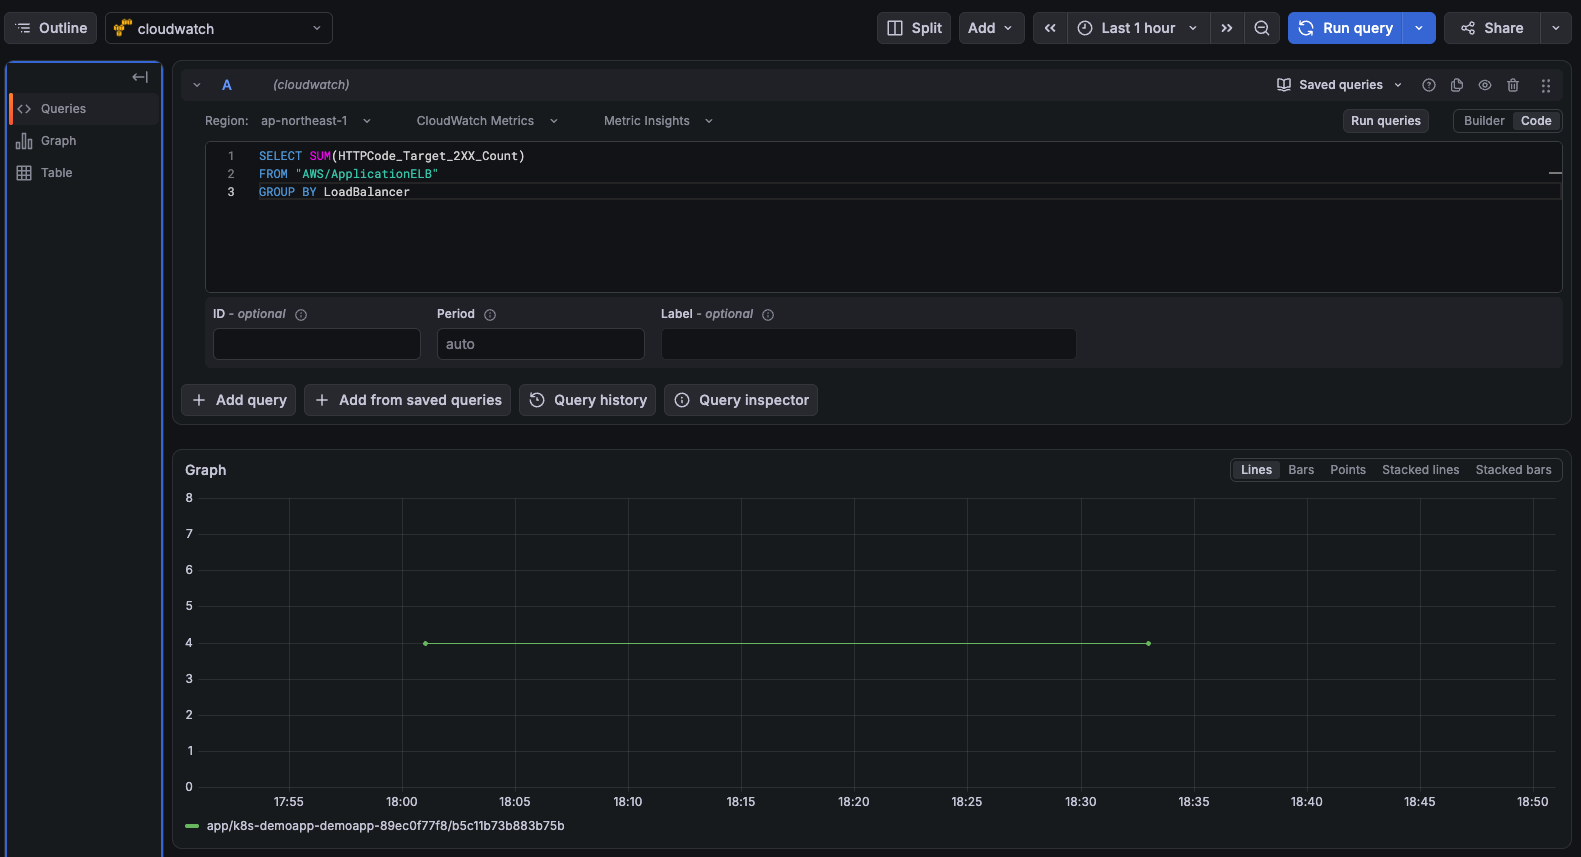
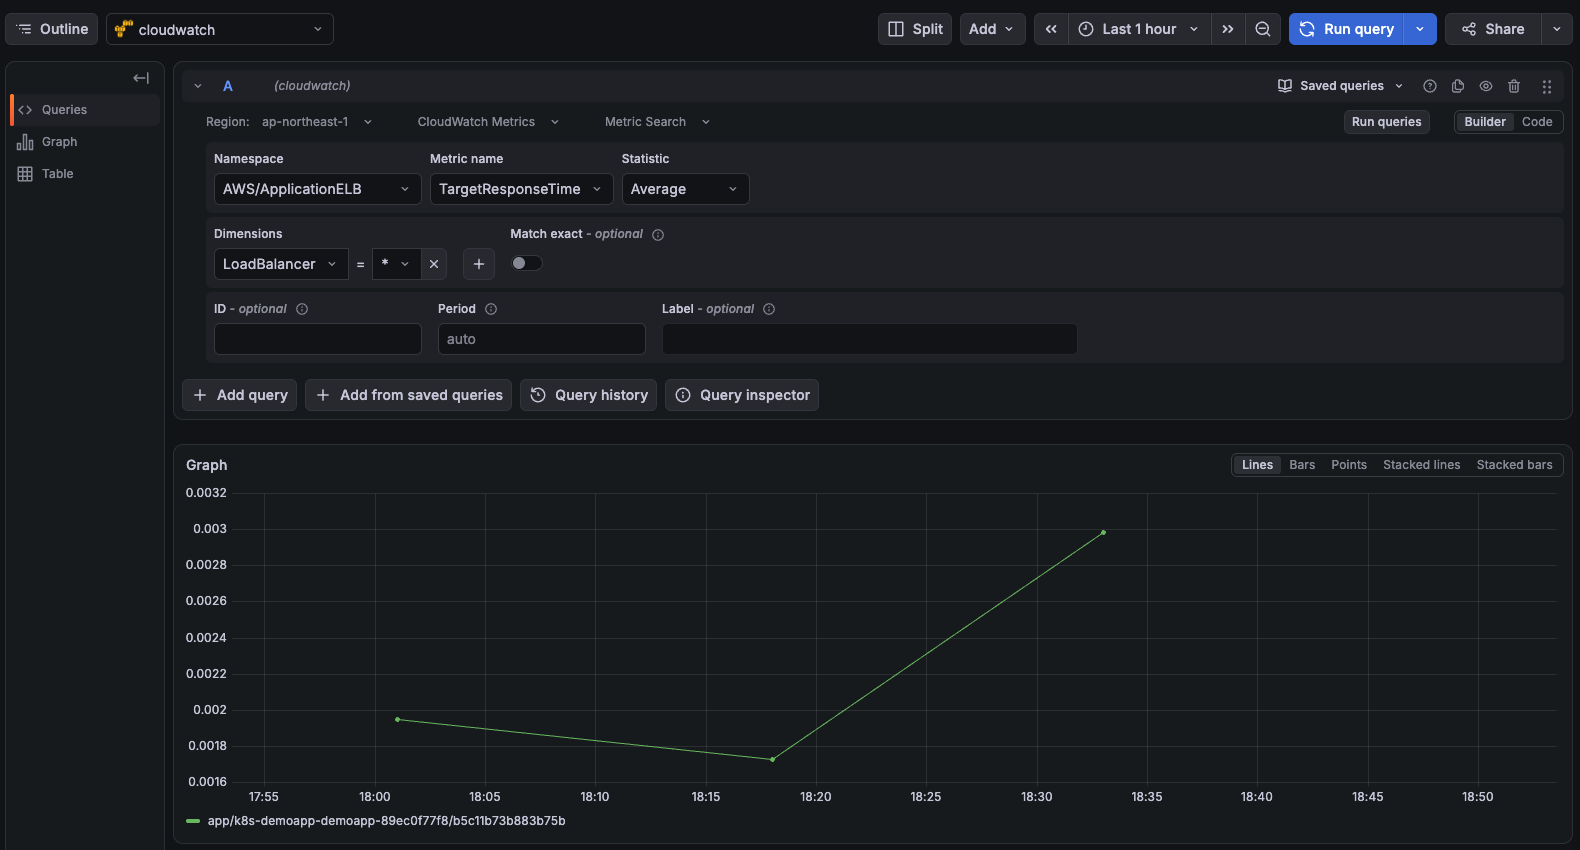
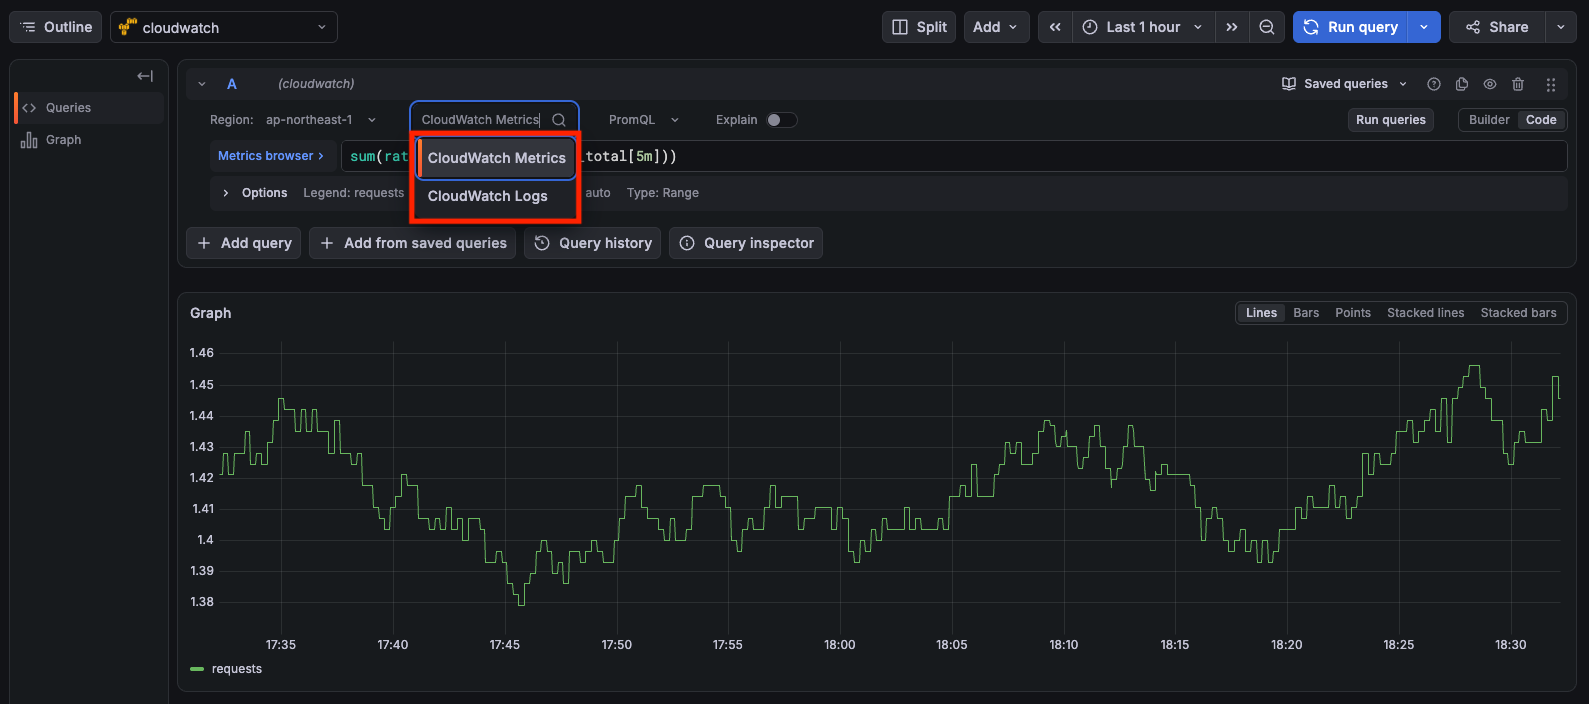
CloudWatch データソースは PromQL 前提になったわけでは無く、旧来の Metrics Search/Metrics Insights を利用することも可能な上で PromQL を追加で選択できるようになった形です。
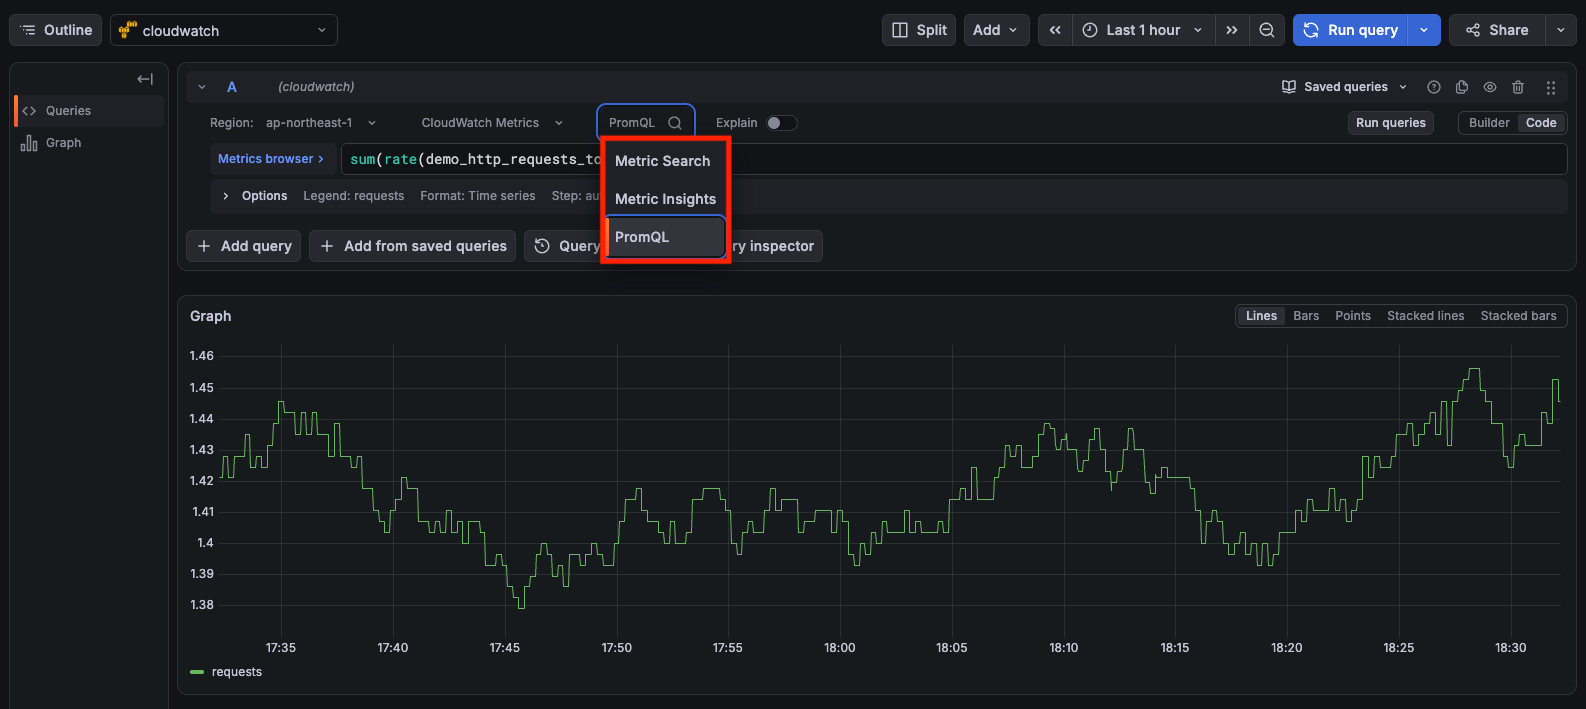
Metrics Insights を選べば従来通りの SQL のサブセットを利用できます。
Metrics Search を使えば、CloudWatch のコンソールと大分近い使い勝手になります。
ただし、OTLP エンドポイントから取り込んだメトリクスに対しては PromQL でクエリする必要があることと、AWS 提供メトリクスに PromQL でクエリするには OTel エンリッチメントが必要な点は注意が必要です。

Application Signals データソースの追加
正直な所あまり PromQL とは関係無いのですが、せっかくなので CloudWatch に溜まったトレースも可視化しておきます。
CloudWatch データソースを使えばメトリクスとログはクエリできるので、トレースだけ個別設定が必要になります。
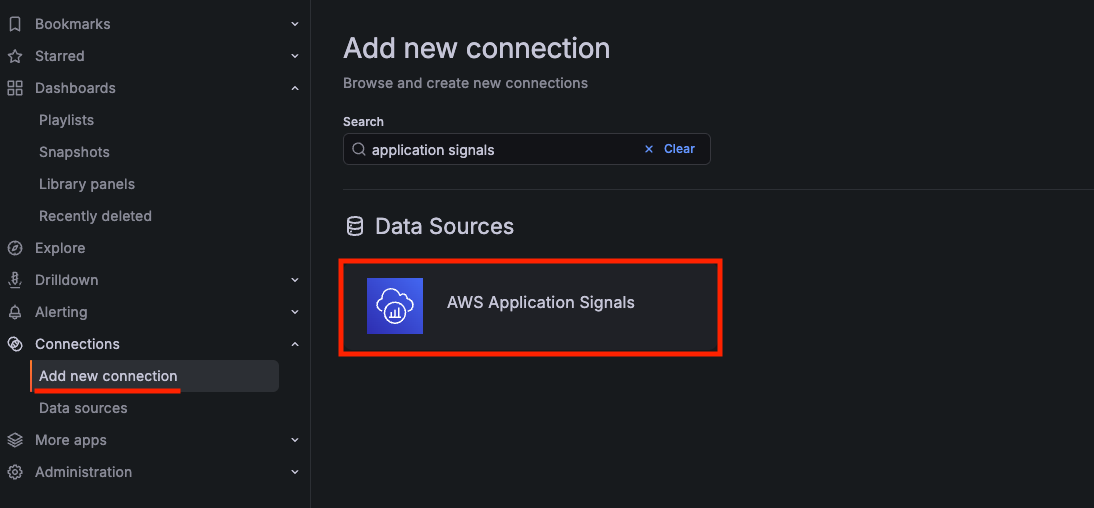
Application Signals データソースはコアデータプラグイン扱いでは無いので、プラグイン管理を「オン」に設定して、データソースのインストールが必要になります。

Connection > Add new connection から AWS Application Signals を追加します。
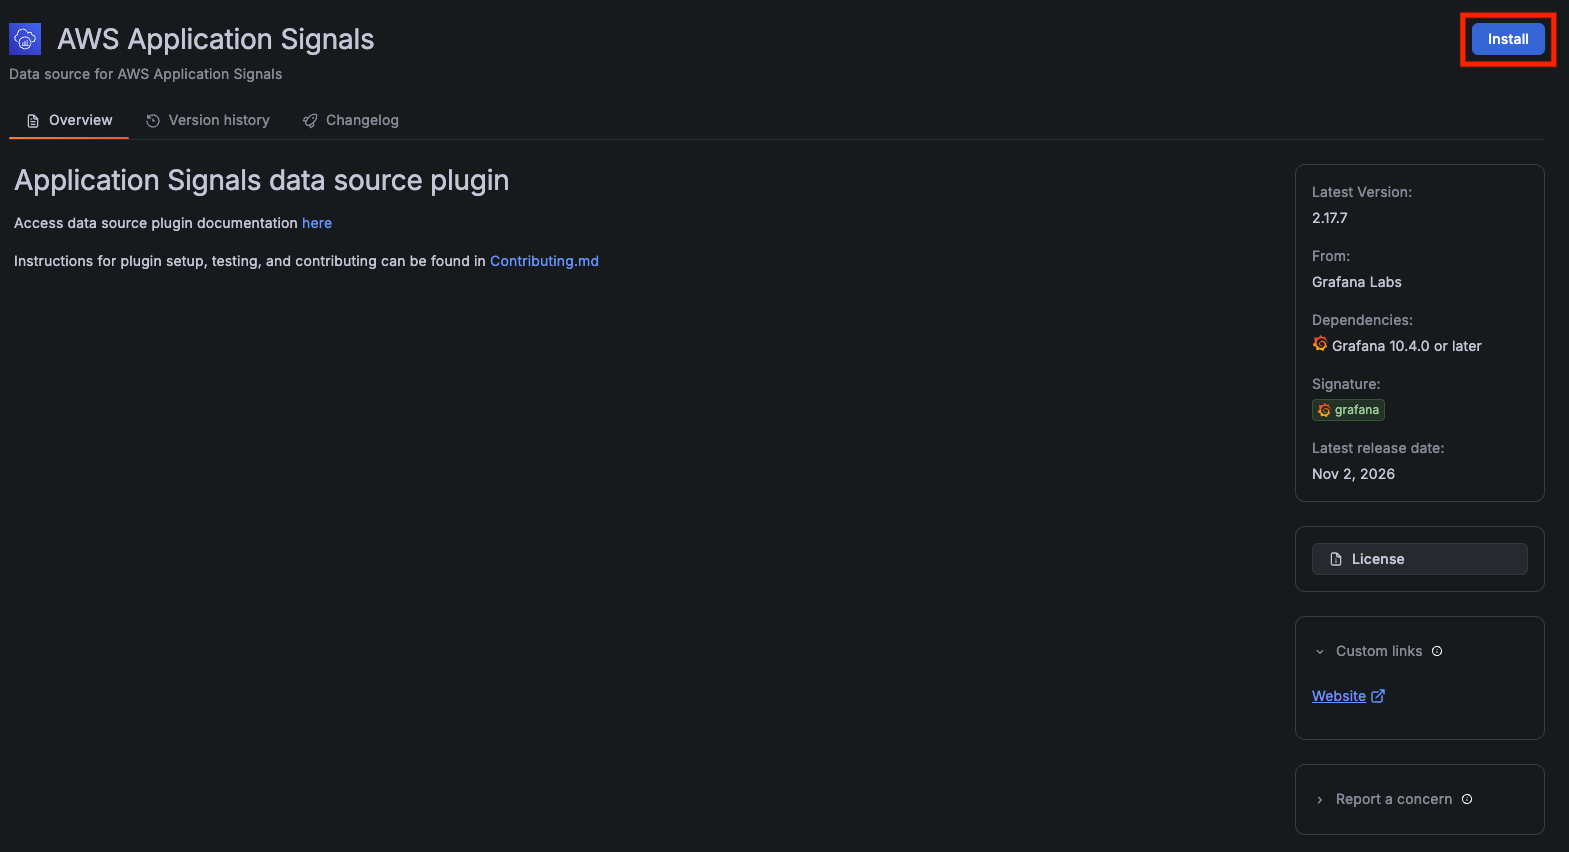
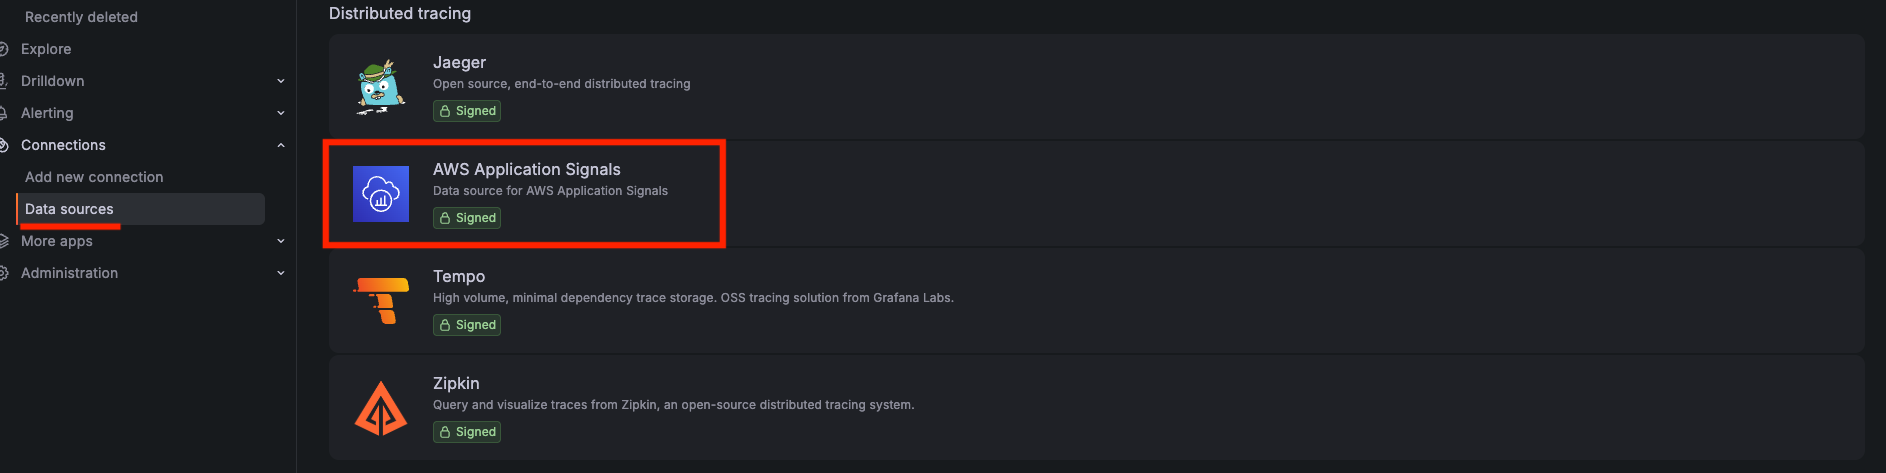
インストールできたら、Datasource からクリックして追加します。
データソース設定を行い、Save & test をクリックします。
CloudWatch データソース同様、権限は Workspace IAM Role で良く、Default Region だけ設定しておきます。
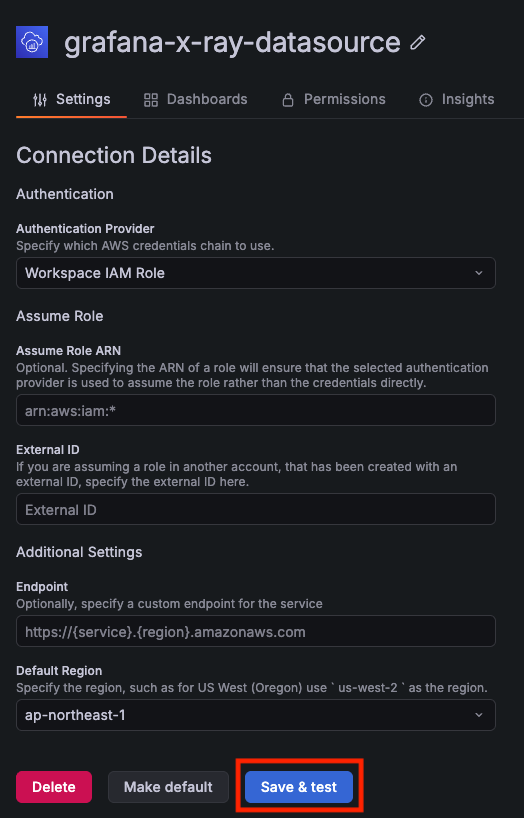
Data source is working と表示されたら成功です。

改めてダッシュボードを見にいくと、ログ/トレース/メトリクスの全てを CloudWatch から確認できるようになりました。
Amazon Managed Prometheus と CloudWatch の使い分けについて
さて、こうなってくると Amazon Managed Prometheus (AMP) との使い分けが非常に難しいですね。
個人的に最も制約になりそうになのはクエリの最大レンジが 7 日であることです。
例えば offset などを利用して、週や月単位で傾向の差分を見ようとするとすぐレンジ制限に抵触します。
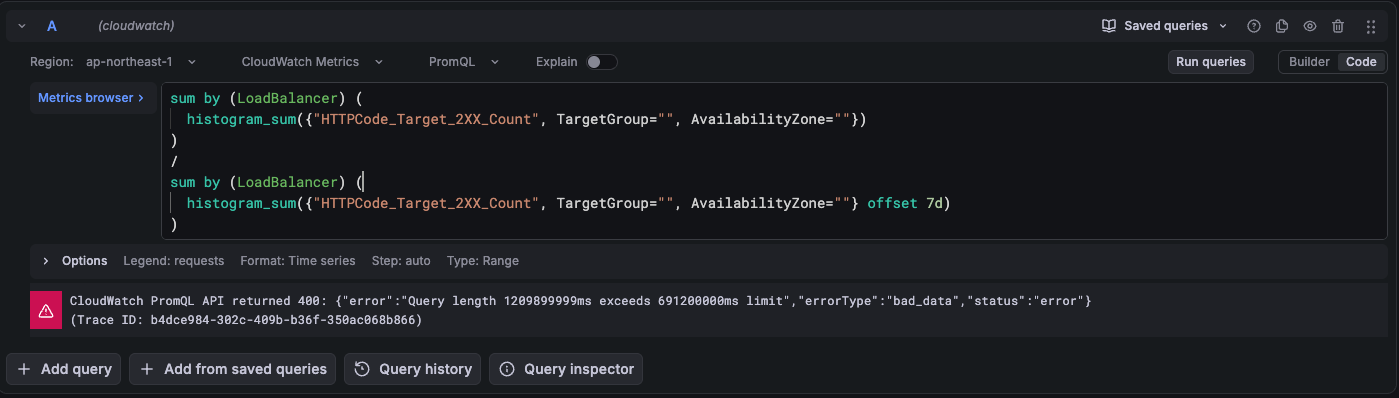
AMP が 95 日間のクエリ期間をサポートしていることを考えると、長期的な傾向を分析する場合はかなり使い勝手に差がでます。
とはいえ、週ごとの傾向を比較をしたいのであれば、Time shift でずらしてパネルを並べたりもできますし、長期の分析用に S3 + Athena などを併用しても良いので、新規構築だとクリティカルにはならない気もします。
メトリクス最大保持期間も CloudWatch が 15 ヶ月、AMP は 3 年と差がありますが、これもクリティカルになるかと言えば微妙な気はします。
また、AMP は Alert Manager を利用することでアラートのグルーピングや、ラベルを利用したルーティング、通知の一時停止などが可能であり、この点は CloudWatch より柔軟な設定が可能です。
一方で、CloudWatch が直近 1 年で大きく改善した部分でもあるので、この部分の差はすぐ縮まるかもしれません。
細かい制約は下記公式ドキュメントにまとまっており、CloudWatch と AMP から選択する際は一読をおすすめします。
CloudWatch 側は、OTel エンリッチメントを有効化すれば AWS 提供メトリクスとカスタムメトリクスを全く同じように扱えるメリットが大きいです。
Grafana 側で突合すれば良いため、AMP と OTel エンリッチメントを併用することも可能ですが、アーキテクチャがシンプルになるメリットは大きいです。
ここは何とも言い辛い部分ですが、直近は CloudWatch 側のアップデートの方が目立つという話もあります。
AWS 側のモチベーションとして、AMP と CloudWatch という Prometheus 互換のデータストアを並列で展開するメリットはあまり大きく無いように感じます。
そうなった場合、どちらかに開発の重心が寄り、クエリの最大レンジや保持期間といった性能に関する部分の比較は意味が無くなる可能性はあります (積極的に投資されている方の性能が高くなる可能性)。
とはいえ、現時点で完璧な選択をすることは難しい部分もあるため、アプリケーションからカスタムメトリクスを OTel Collector 相当のコンポーネントに転送する部分だけでも OTLP を採用しておけば最低限 OK という考え方もできます。
コスト面はかなり価格体系が違うのでケースバイケースとなります。
1 データポイントあたりのラベル数が多い場合は AMP の方が有利になりやすいです。
また、クエリ料金も AMP が有利になりやすいですが、CloudWatch コンソールからクエリする分は無料な点が特徴的です。
EKS 基盤のメトリクスを取り込む際は EKS Container Insights(OTel)だと単価が変わる点も注意が必要ですね。
| 項目 | CloudWatch(OTel) | AMP |
|---|---|---|
| 取り込み | $0.50 / GB | $0.90 / 1,000万サンプル(最初の20億サンプル、以降は段階的に割引) |
| 保存 | 15か月分込み | $0.03 / GB・月 |
| クエリ(API 経由) | $0.01 / 100万サンプル | $0.10 / 10億サンプル |
| クエリ(コンソール) | 無料 | ー |
| 備考 | EKS Container Insights(OTel)は $0.08 / GB | マネージドコレクター利用時は別途課金 |
最後に
CloudWatch が PromQL 対応したので、Amazon Managed Grafana から接続してみました。
CloudWatch と AMP の比較は難しいですが、まずは CloudWatch を検討して、気になる制約があれば AMP といった選び方が良いように感じました。
特に EKS では悩ましいですが、EKS Container Insights(OTel)の取り込み料金の安さやセットアップの楽さは中々に魅力的です。
既存の AMP を CloudWatch に移行するメリットはあまり無いが、新規構築だと CloudWatch を優先して良さそう、ただし、AWS がどちらに注力しているかはちゃんと見ておく必要がある、みたいな感じでしょうか (難しい立ち回り...!)。
Google Cloud のように CloudWatch に Grafana ダッシュボードをインポートできたりするとさらに面白くなると思うので、今後の開発にも期待したいと思います!