Cloud Runのスケーリング制御(Scaling Controls)を使ってみた
はじめに
こんにちは。
クラウド事業本部コンサルティング部の渡邉です。
2026年4月16日に Cloud Run にスケーリング制御(Scaling Controls)がPreviewとしてリリースされました。
これまで Cloud Run のオートスケーリングは CPU 利用率・同時実行数ともにターゲット値が 60% 固定でした。スケーリング制御を使うと、これらのターゲット値を 10〜95% の範囲でカスタム設定できるようになります。
今回は、スケーリング制御の概要と設定方法、そして実際に gcloud CLI で試すハンズオンを紹介します。
Cloud Run のオートスケーリングの仕組み
Cloud Run は CPU 利用率・同時実行数をもとにインスタンス数を自動調整します。スケーリング制御の理解のために、まず現在のデフォルト動作を整理します。
| スケーリング指標 | デフォルトのターゲット | 意味 |
|---|---|---|
| CPU 利用率 | 60% | インスタンス全体の平均 CPU が 60% を超えるとスケールアウト |
| 同時実行数利用率 | 60% | 最大同時実行数の 60% を超えるとスケールアウト |
この 60% は固定値であり、これまではアプリケーションの特性に応じた調整ができませんでした。
スケーリング制御でできること
スケーリング制御(Scaling Controls) を使うと、CPU ターゲットと同時実行数ターゲットをそれぞれ個別に設定できます。
設定可能な値
| パラメータ | 設定範囲 | デフォルト |
|---|---|---|
CPU ターゲット(--scaling-cpu-target) |
10〜95% | 60% |
同時実行数ターゲット(--scaling-concurrency-target) |
10〜95% | 60% |
また、どちらか一方を disabled に設定することで、その指標によるスケーリングを無効化することもできます。
ユースケース別の設定例
| ユースケース | 推奨設定 | 理由 |
|---|---|---|
| 低レイテンシ優先 | CPU ターゲットを低く設定(例: 30%) | 余裕を持たせてスケールアウトを早める |
| コスト最適化 | CPU ターゲットを高く設定(例: 80%) | インスタンス数を減らして費用を抑える |
| I/O バウンドなアプリ | 同時実行数ターゲットのみ有効化 | CPU が低くても同時実行数でスケール |
| CPU バウンドなアプリ | 同時実行数ターゲットを disabled、CPU ターゲットを設定 |
CPU 利用率のみを基準に適切にスケール |
試してみた
実際に Cloud Run サービスにスケーリング制御を設定してみます。
前提条件
- Google Cloud プロジェクトが作成済みであること
gcloudCLI がインストール・認証済みであること- Cloud Run API(
run.googleapis.com)が有効化されていること - デプロイ済みの Cloud Run サービスが存在すること
環境変数の設定
export PROJECT_ID="your-project-id"
export SERVICE_NAME="hello"
export REGION="asia-northeast1"

gcloud config set project $PROJECT_ID
Step 1: 既存サービスのスケーリング設定を確認する
現在の設定を確認します。
gcloud run services describe $SERVICE_NAME \
  --region=$REGION
現在の設定が出力されました。
✔ Service hello in region asia-northeast1

URL:     https://hello-123456789012.asia-northeast1.run.app
Ingress: all
Traffic:
  100% LATEST (currently hello-00001-4b8)

Scaling: Auto (Min: 1, Max: 100)

Last updated on 2026-04-26T22:49:05.533657Z by user@example.com:
  Revision hello-00001-4b8
  Container hello-1
    Image:           us-docker.pkg.dev/cloudrun/container/hello
    Port:            8080
    Memory:          512Mi
    CPU:             1000m
    Startup Probe:
      TCP every 240s
      Port:          8080
      Initial delay: 0s
      Timeout:       240s
      Failure threshold: 1
      Type:          Default
  Service account:   123456789012-compute@developer.gserviceaccount.com
  Concurrency:       80
  Timeout:           300s
デフォルトでは scaling-cpu-target と scaling-concurrency-target は設定されていません(60% がデフォルト適用)。
Step 2: スケーリング制御にオプトインする
スケーリング制御はターゲット値をデフォルトの 60% のままにした場合でも、オプトインするだけでより高精度なオートスケーラーが有効になります。インスタンス数が少ない状況でも設定ターゲットに敏感に反応するようになり、スケーリングの予測可能性が向上します。
カスタム値を設定する前に、まずデフォルト値(60%)でオプトインしてみます。
gcloud beta run services update $SERVICE_NAME \
  --region=$REGION \
  --scaling-cpu-target=0.6 \
  --scaling-concurrency-target=0.6
デプロイが完了しました。
Deploying...
  Creating Revision...done
  Routing traffic...done
Done.
Service [hello] revision [hello-00003-66x] has been deployed and is serving 100 percent of traffic.
Service URL: https://hello-123456789012.asia-northeast1.run.app
Proxy locally with: gcloud run services proxy hello --region asia-northeast1 --project your-project-id
なお、スケーリング制御の設定を変更するたびに新しいリビジョンが作成されます。以降のリビジョンは設定を引き継ぎます。
Step 3: CPU ターゲットをカスタム設定する
CPU 利用率のスケーリングターゲットを 40%(0.4)に設定してみます。これにより、CPU 利用率が 40% を超えた時点でスケールアウトが始まり、レイテンシの上昇を早めに抑制できます。
--scaling-cpu-target の値は 0.1〜0.95 の小数で指定します(小数点以下 2 桁まで)。
gcloud beta run services update $SERVICE_NAME \
  --region=$REGION \
  --scaling-cpu-target=0.4
デプロイが完了しました。
Deploying...
  Creating Revision...done
  Routing traffic...done
Done.
Service [hello] revision [hello-00004-59x] has been deployed and is serving 100 percent of traffic.
Service URL: https://hello-123456789012.asia-northeast1.run.app
Proxy locally with: gcloud run services proxy hello --region asia-northeast1 --project your-project-id
Step 4: CPU・同時実行数ターゲットを組み合わせて設定する
CPU ターゲットと同時実行数ターゲットを組み合わせて設定してみます。
gcloud beta run services update $SERVICE_NAME \
  --region=$REGION \
  --scaling-cpu-target=0.4 \
  --scaling-concurrency-target=0.7
デプロイが完了しました。
Deploying...
  Creating Revision...done
  Routing traffic...done
Done.
Service [hello] revision [hello-00005-6pg] has been deployed and is serving 100 percent of traffic.
Service URL: https://hello-123456789012.asia-northeast1.run.app
Proxy locally with: gcloud run services proxy hello --region asia-northeast1 --project your-project-id
Step 5: 負荷をかけてスケーリングを確認する
Step 4 でターゲットを CPU 40%・同時実行数 70% に設定した状態で、実際に負荷をかけてスケーリングの動作を確認します。
まずは、以下のコマンドを実行してサービス URL を取得します。
SERVICE_URL=$(gcloud run services describe $SERVICE_NAME \
  --region=$REGION \
  --format="value(status.url)")
HTTP 負荷テストツール hey を使って並列リクエストを送信してみます。
# hey のインストール(未インストールの場合)
go install github.com/rakyll/hey@latest

# 60 秒間、50 並列でリクエストを送信
hey -z 60s -c 50 $SERVICE_URL

Summary:
  Total:        60.0399 secs
  Slowest:      1.0963 secs
  Fastest:      0.0376 secs
  Average:      0.0769 secs
  Requests/sec: 649.8841

Response time histogram:
  0.038 [1]     |
  0.143 [37579] |■■■■■■■■■■■■■■■■■■■■■■■■■■■■■■■■■■■■■■■■
  0.249 [39]    |
  0.355 [50]    |
  0.461 [0]     |
  0.567 [0]     |
  0.673 [0]     |
  0.779 [0]     |
  0.885 [0]     |
  0.990 [0]     |
  1.096 [1350]  |■

Latency distribution:
  10%% in 0.0388 secs
  25%% in 0.0393 secs
  50%% in 0.0407 secs
  75%% in 0.0421 secs
  90%% in 0.0438 secs
  95%% in 0.0501 secs
  99%% in 1.0687 secs

Details (average, fastest, slowest):
  DNS+dialup:   0.0000 secs, 0.0000 secs, 0.0235 secs
  DNS-lookup:   0.0000 secs, 0.0000 secs, 0.0072 secs
  req write:    0.0000 secs, 0.0000 secs, 0.0039 secs
  resp wait:    0.0759 secs, 0.0366 secs, 1.0953 secs
  resp read:    0.0009 secs, 0.0000 secs, 0.0800 secs

Status code distribution:
  [200] 39019 responses
負荷をかけている間に Cloud Console でインスタンス数の増加を確認します。
- Cloud Console で Cloud Run のサービス詳細ページを開く
- 「メトリクス」 タブを開く
- 「Container instance count」 グラフでインスタンス数の推移を確認する
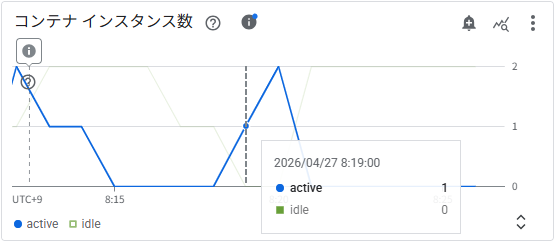
コンテナインスタンス数
負荷開始後、active インスタンスが最大 2 まで増加しています。
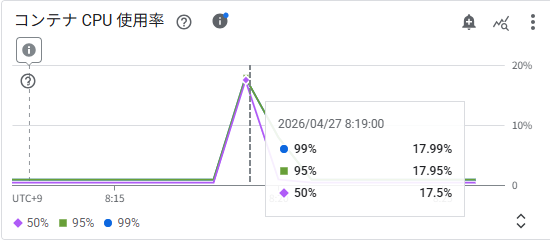
コンテナ CPU 使用率
スケールアウトのタイミング(8:19 頃)で CPU 使用率が急上昇していますが、ピーク時でも p50/p95/p99 ともに約 17〜18% にとどまっています。設定したターゲット(40%)を大きく下回っており、CPU ではなく同時実行数がスケーリングをトリガーしたと読み取れます。
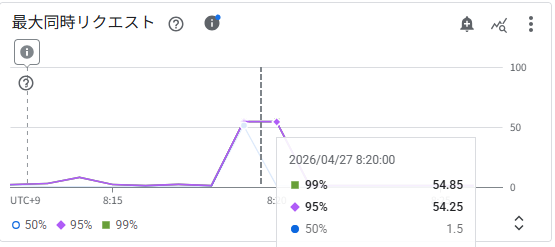
最大同時リクエスト
8:20 頃に p95/p99 で同時リクエスト数が約 54〜55 に達しています。最大同時実行数 80 の約 68% に相当し、設定した同時実行数ターゲット(70%、0.7)に迫る値です。CPU 使用率がターゲットに達するより先に同時実行数がトリガー条件に近づいたため、今回のスケールアウトは同時実行数ドライバーが主導していたと考えられます。
スケーリングイベントは Cloud Logging でも確認できます。
{
  "textPayload": "Starting new instance. Reason: AUTOSCALING - Instance started due to configured scaling factors (e.g. CPU utilization, request throughput, etc.) or no existing capacity for current traffic.",
  "insertId": "<INSERT_ID>",
  "resource": {
    "type": "cloud_run_revision",
    "labels": {
      "location": "asia-northeast1",
      "configuration_name": "hello",
      "revision_name": "hello-00005-6pg",
      "project_id": "your-project-id",
      "service_name": "hello"
    }
  },
  "timestamp": "2026-04-26T23:19:01.862079Z",
  "severity": "INFO",
  "labels": {
    "instanceId": "<INSTANCE_ID>",
    "scaling_reason": "AUTOSCALING"
  },
  "logName": "projects/your-project-id/logs/run.googleapis.com%2Fvarlog%2Fsystem",
  "receiveTimestamp": "2026-04-26T23:19:01.865766426Z"
}
scaling_reason: "AUTOSCALING" と記録されており、タイムスタンプ(UTC 23:19 = JST 8:19)はインスタンス数グラフのスケールアウト時刻と一致しています。
Step 6: 特定指標のスケーリングを無効化する
同時実行数ターゲットを無効化し、CPU のみでスケーリングさせます。CPU バウンドな処理が多く、同時実行数よりも CPU 利用率の方がスケーリングの指標として適しているアプリに有効です。今回は--scaling-cpu-targetを0.2の低めに設定してスケーリングしやすい方法で試してみます。
gcloud beta run services update $SERVICE_NAME \
  --region=$REGION \
  --scaling-cpu-target=0.2 \
  --scaling-concurrency-target=disabled
再度、負荷をかけてインスタンス数の増加を確認します。
hey -z 120s -c 60 $SERVICE_URL

Summary:
  Total:        120.0412 secs
  Slowest:      1.1040 secs
  Fastest:      0.0374 secs
  Average:      0.0434 secs
  Requests/sec: 1382.4498

Response time histogram:
  0.037 [1]     |
  0.144 [165481]        |■■■■■■■■■■■■■■■■■■■■■■■■■■■■■■■■■■■■■■■■
  0.251 [53]    |
  0.357 [101]   |
  0.464 [13]    |
  0.571 [1]     |
  0.677 [1]     |
  0.784 [0]     |
  0.891 [0]     |
  0.997 [0]     |
  1.104 [300]   |

Latency distribution:
  10%% in 0.0389 secs
  25%% in 0.0395 secs
  50%% in 0.0407 secs
  75%% in 0.0421 secs
  90%% in 0.0436 secs
  95%% in 0.0453 secs
  99%% in 0.0540 secs

Details (average, fastest, slowest):
  DNS+dialup:   0.0000 secs, 0.0000 secs, 0.0245 secs
  DNS-lookup:   0.0000 secs, 0.0000 secs, 0.0071 secs
  req write:    0.0000 secs, 0.0000 secs, 0.0079 secs
  resp wait:    0.0424 secs, 0.0365 secs, 1.1025 secs
  resp read:    0.0009 secs, 0.0000 secs, 0.0192 secs

Status code distribution:
  [200] 165951 responses
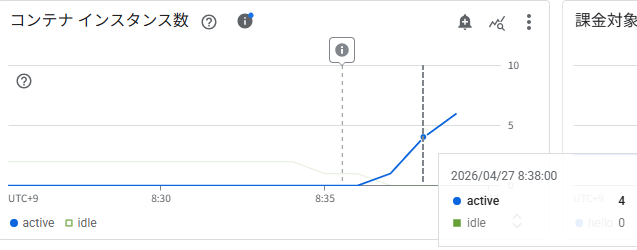
コンテナインスタンス数
8:35 頃から active インスタンスが急増し、8:38 時点ですでに 4 インスタンスに達し、さらに上昇中です。Step 5(最大 2 インスタンス)と比べてより積極的なスケールアウトが発生しています。CPU ターゲットを 20%(0.2)と低く設定したことで、わずかな負荷でもすぐにスケールアウトがトリガーされていることがわかります。
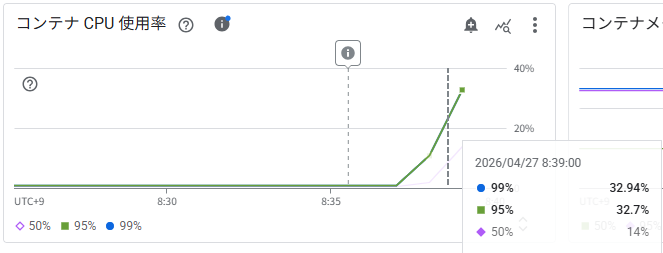
コンテナ CPU 使用率
8:39 時点で p95/p99 が約 32〜33% に上昇し、設定したターゲット(20%)を超えています。Step 5 では CPU がターゲットに達する前に同時実行数がトリガーしていましたが、今回はCPU が実際のスケーリングドライバーとして機能していることが確認できます。
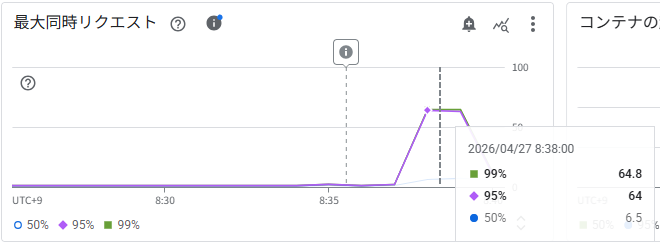
最大同時リクエスト
8:38 時点で p95/p99 が約 64〜65 同時リクエストに達しています。最大同時実行数 80 の約 80% に相当し、Step 5(54〜55)より高い値ですが、今回は同時実行数ターゲットを disabled に設定しているためスケーリングのトリガーにはなりません。CPU ドライバーのみが判定に使われています。
スケーリングイベントは Cloud Logging でも確認できます。
{
  "textPayload": "Starting new instance. Reason: AUTOSCALING - Instance started due to configured scaling factors (e.g. CPU utilization, request throughput, etc.) or no existing capacity for current traffic.",
  "insertId": "<INSERT_ID>",
  "resource": {
    "type": "cloud_run_revision",
    "labels": {
      "revision_name": "hello-00006-c7b",
      "location": "asia-northeast1",
      "project_id": "your-project-id",
      "service_name": "hello",
      "configuration_name": "hello"
    }
  },
  "timestamp": "2026-04-26T23:37:26.897152Z",
  "severity": "INFO",
  "labels": {
    "scaling_reason": "AUTOSCALING",
    "instanceId": "<INSTANCE_ID>"
  },
  "logName": "projects/your-project-id/logs/run.googleapis.com%2Fvarlog%2Fsystem",
  "receiveTimestamp": "2026-04-26T23:37:26.905889393Z"
}
タイムスタンプ(UTC 23:37 = JST 8:37)はインスタンス数グラフの急増開始タイミング(8:35〜8:38)と一致しています。
Step 7: 設定を確認する
更新後の設定を確認します。
gcloud CLI で確認すると以下のコマンドになります。
gcloud run services describe $SERVICE_NAME \
  --region=$REGION
出力の中に Target CPU utilization と Target concurrency utilization の項目が表示されます。
✔ Service hello in region asia-northeast1

URL:     https://hello-123456789012.asia-northeast1.run.app
Ingress: all
Traffic:
  100% LATEST (currently hello-00006-c7b)

Scaling: Auto (Min: 1, Max: 100)

Last updated on 2026-04-26T23:47:19.830279Z by user@example.com:
  Revision hello-00006-c7b
  Container hello-1
    Image:           us-docker.pkg.dev/cloudrun/container/hello
    Port:            8080
    Memory:          512Mi
    CPU:             1000m
    Startup Probe:
      TCP every 240s
      Port:          8080
      Initial delay: 0s
      Timeout:       240s
      Failure threshold: 1
      Type:          Default
  Service account:   123456789012-compute@developer.gserviceaccount.com
  Concurrency:       80
  Scaling:
    Max instances:   100
    Target CPU utilization: 0.2
    Target concurrency utilization: disabled
  Timeout:           300s
YAML 形式で確認することもできます。
gcloud run services describe $SERVICE_NAME \
  --region=$REGION \
  --format="yaml"
アノテーションにrun.googleapis.com/scaling-cpu-targetとrun.googleapis.com/scaling-concurrency-targetの設定が追加されていれば成功です。
apiVersion: serving.knative.dev/v1
kind: Service
metadata:
  annotations:
    run.googleapis.com/client-name: cloud-console
    run.googleapis.com/ingress: all
    run.googleapis.com/ingress-status: all
    run.googleapis.com/launch-stage: BETA
    run.googleapis.com/maxScale: '100'
    run.googleapis.com/minScale: '1'
    run.googleapis.com/operation-id: xxxxxxxx-xxxx-xxxx-xxxx-xxxxxxxxxxxx
    run.googleapis.com/urls: '["https://hello-123456789012.asia-northeast1.run.app","https://hello-4ysbdmny6a-an.a.run.app"]'
    serving.knative.dev/creator: user@example.com
    serving.knative.dev/lastModifier: user@example.com
  creationTimestamp: '2026-04-26T22:47:14.318541Z'
  generation: 10
  labels:
    cloud.googleapis.com/location: asia-northeast1
  name: hello
  namespace: '123456789012'
  resourceVersion: xxxxxxxxxxxx
  selfLink: /apis/serving.knative.dev/v1/namespaces/123456789012/services/hello
  uid: xxxxxxxx-xxxx-xxxx-xxxx-xxxxxxxxxxxx
spec:
  template:
    metadata:
      annotations:
        autoscaling.knative.dev/maxScale: '100'
        run.googleapis.com/client-name: cloud-console
        run.googleapis.com/scaling-concurrency-target: disabled
        run.googleapis.com/scaling-cpu-target: '0.2'
        run.googleapis.com/startup-cpu-boost: 'true'
      labels:
        client.knative.dev/nonce: papwkvscuj
        run.googleapis.com/startupProbeType: Default
    spec:
      containerConcurrency: 80
      containers:
      - image: us-docker.pkg.dev/cloudrun/container/hello
        name: hello-1
        ports:
        - containerPort: 8080
          name: http1
        resources:
          limits:
            cpu: 1000m
            memory: 512Mi
        startupProbe:
          failureThreshold: 1
          periodSeconds: 240
          tcpSocket:
            port: 8080
          timeoutSeconds: 240
      serviceAccountName: 123456789012-compute@developer.gserviceaccount.com
      timeoutSeconds: 300
  traffic:
  - latestRevision: true
    percent: 100
status:
  address:
    url: https://hello-4ysbdmny6a-an.a.run.app
  conditions:
  - lastTransitionTime: '2026-04-26T23:47:19.830279Z'
    status: 'True'
    type: Ready
  - lastTransitionTime: '2026-04-26T23:35:34.117622Z'
    status: 'True'
    type: ConfigurationsReady
  - lastTransitionTime: '2026-04-26T23:47:19.037955Z'
    status: 'True'
    type: RoutesReady
  latestCreatedRevisionName: hello-00006-c7b
  latestReadyRevisionName: hello-00006-c7b
  observedGeneration: 10
  traffic:
  - latestRevision: true
    percent: 100
    revisionName: hello-00006-c7b
  url: https://hello-4ysbdmny6a-an.a.run.app
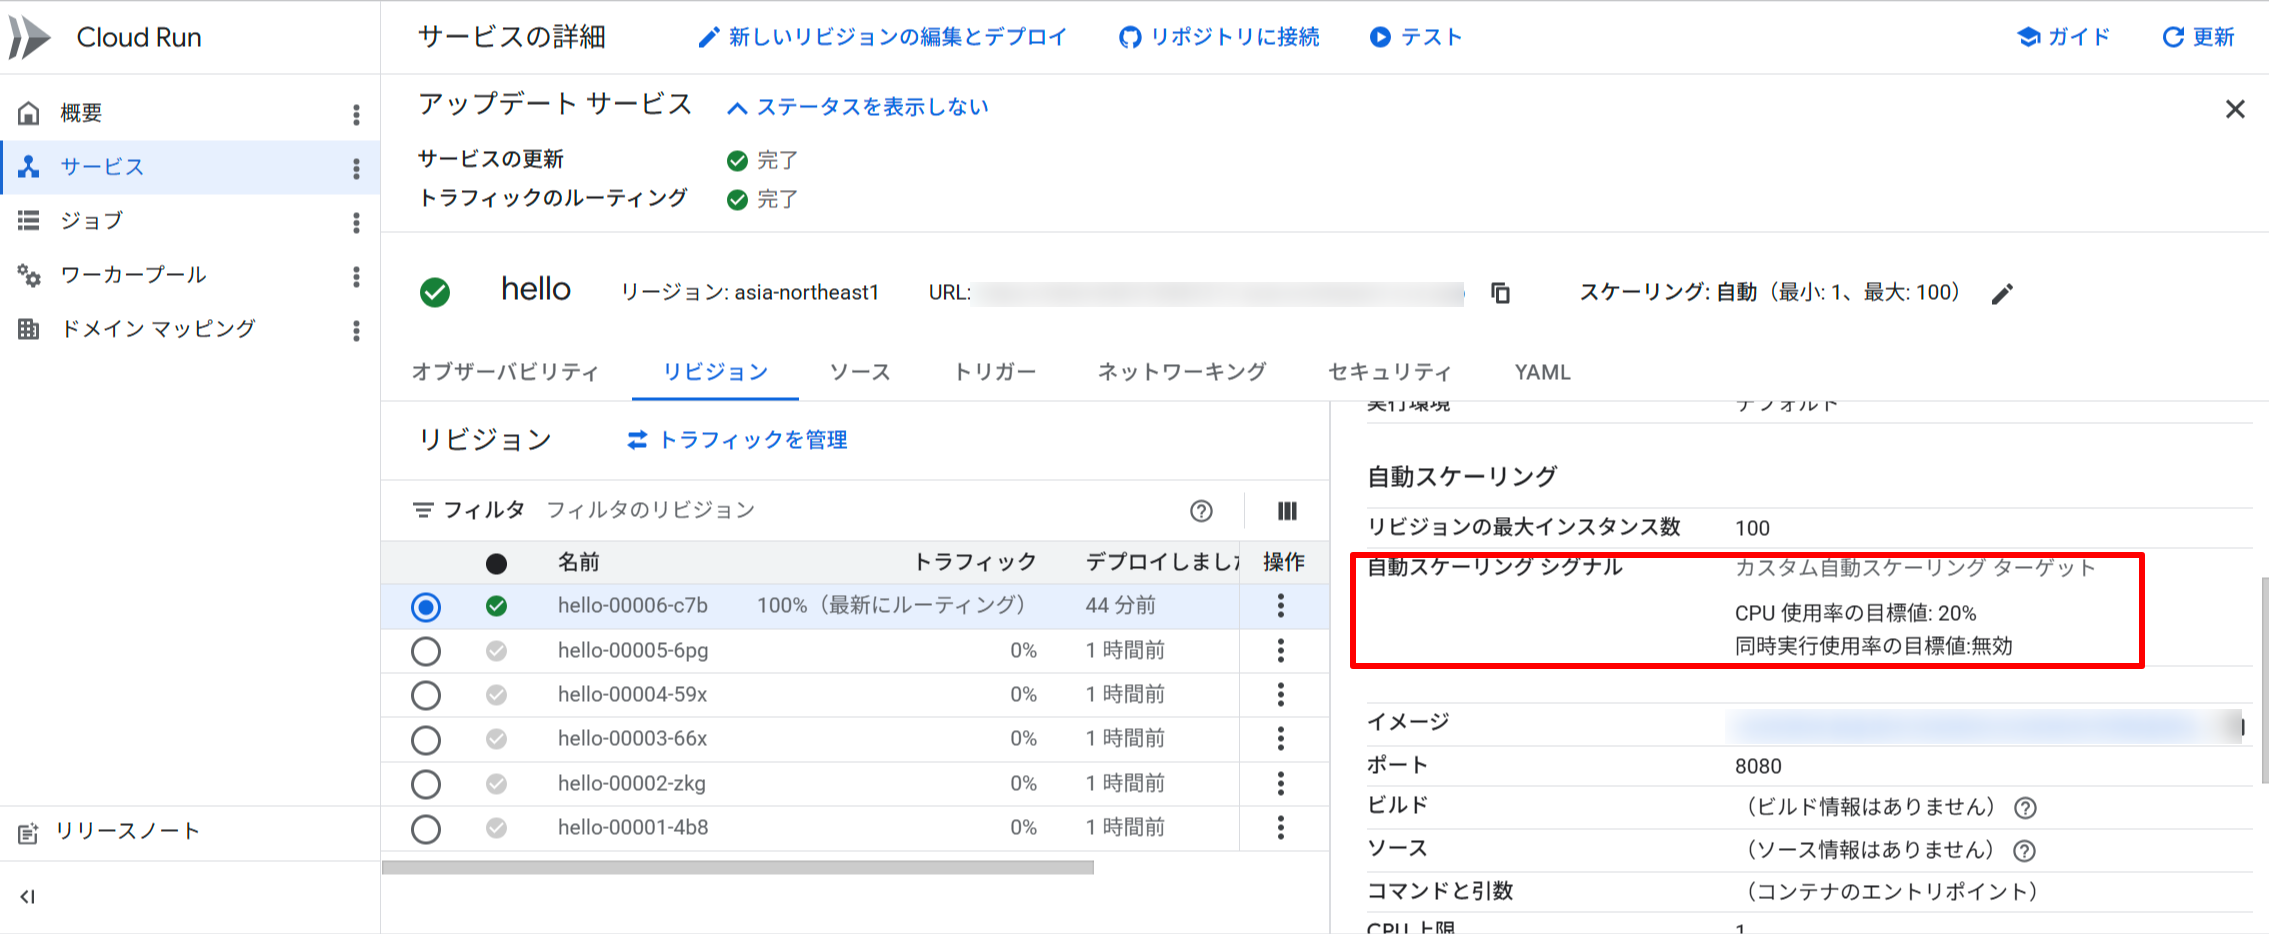
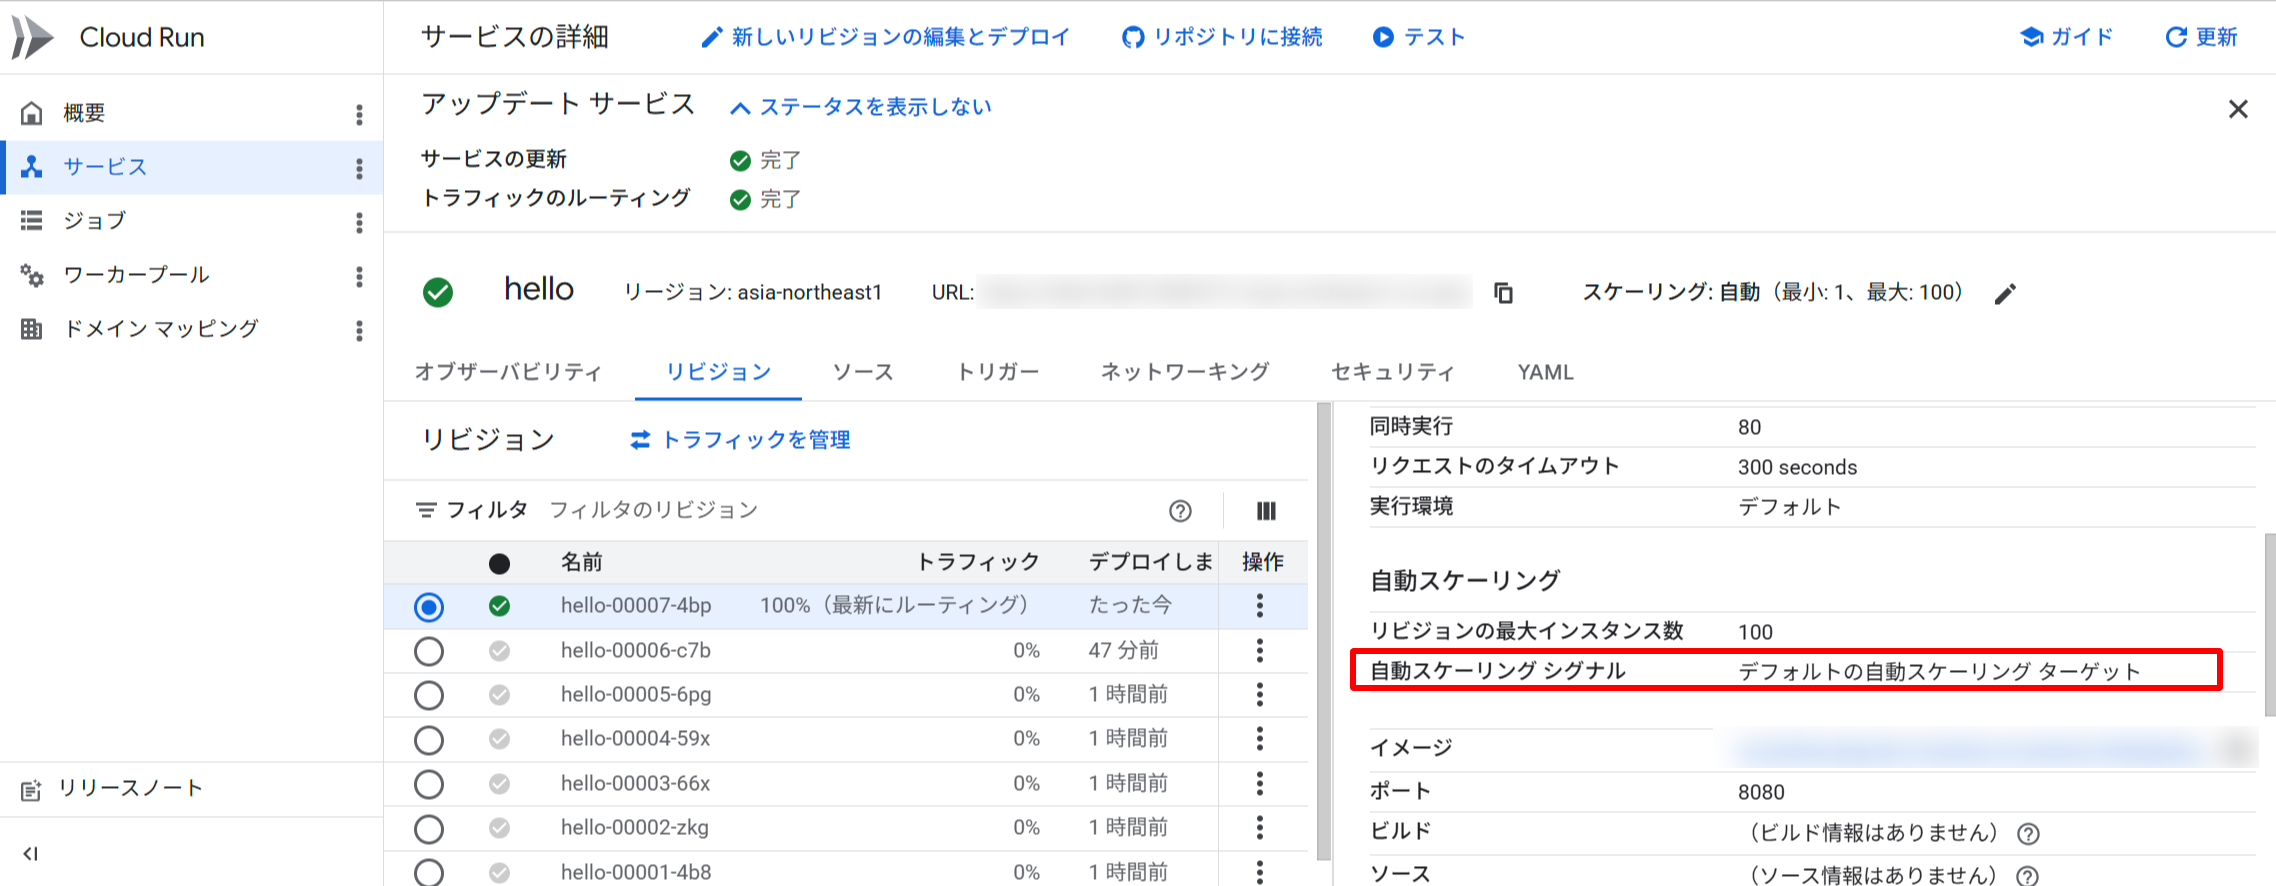
Google Cloud Console でも確認できます。
- Google Cloud Console で Cloud Run のサービス一覧ページを開く
- 対象のサービスをクリックしてサービス詳細パネルを開く
- 「リビジョン」 タブをクリック
- 右側の詳細パネルの 「コンテナ」 タブで 「自動スケーリング シグナル」 の設定を確認する
Step 8: Metrics Explorer でスケーリングドライバーを確認する
どのスケーリングドライバー(CPU または同時実行数)が実際にインスタンス数を決定しているかを確認できます。
- Google Cloud Console の Metrics Explorer を開く
- メトリクス
run.googleapis.com/scaling/recommended_instancesを検索して選択する - 「集計」 を 未集計 に設定する
- スケーリングドライバーごとにグループ化された推奨インスタンス数が表示される
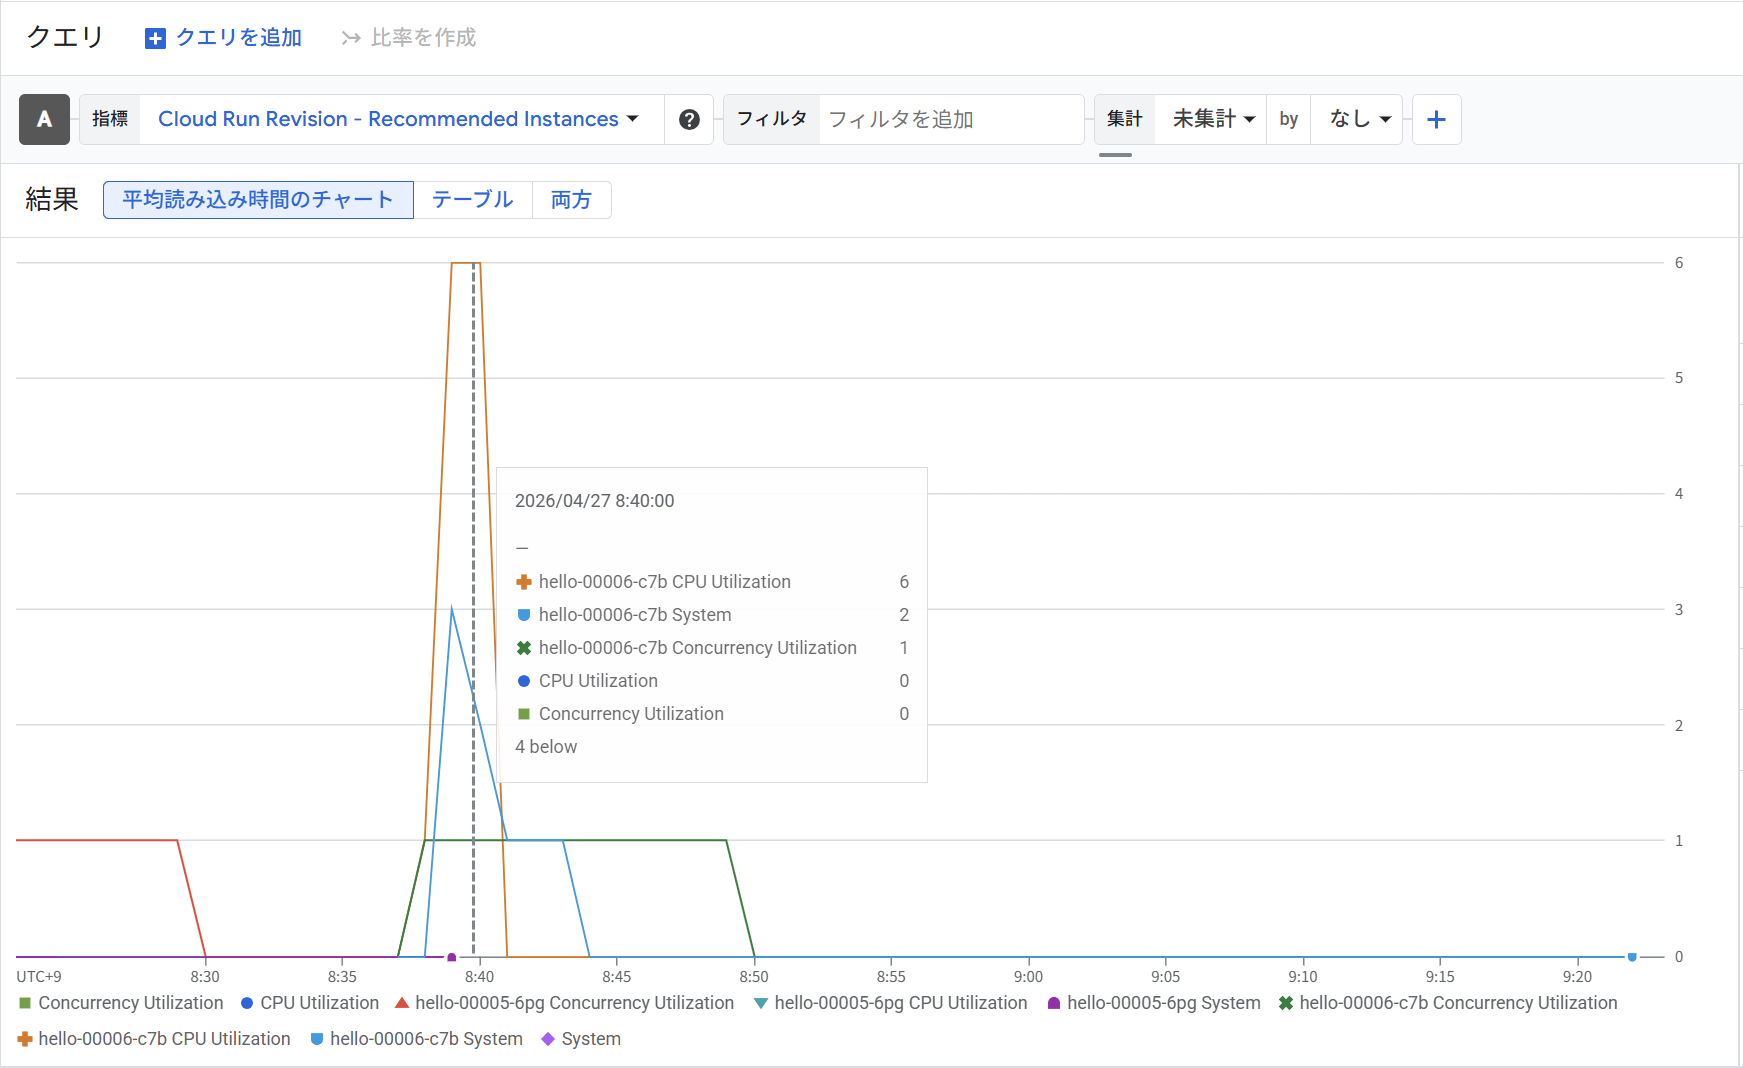
Metrics Explorer: run.googleapis.com/scaling/recommended_instances(未集計)
8:40 時点を確認すると、hello-00006-c7b(Step 6 で設定したリビジョン)のドライバー別推奨インスタンス数が以下のようになっています。
| ドライバー | 推奨インスタンス数 |
|---|---|
| CPU Utilization | 6 |
| System | 2 |
| Concurrency Utilization | 1 |
CPU Utilization が最大の 6 インスタンスを推奨しており、これが実際のスケーリング決定を主導しています。 同時実行数ターゲットを disabled にしているため Concurrency Utilization の影響は限定的(1 インスタンス)になっており、CPU ドライバーのみが実質的にスケーリングを制御していることをメトリクスからも確認できます。
このように recommended_instances を未集計でドライバー別に表示すると、どの指標がインスタンス数を決定しているかを可視化でき、ターゲット値のチューニングに役立てられます。
Step 9: デフォルト値に戻す
設定をデフォルト(60%)に戻すには default を指定します。デフォルト値に戻すとスケーリング制御からオプトアウトされ、通常のオートスケーラーに戻ります。
gcloud beta run services update $SERVICE_NAME \
  --region=$REGION \
  --scaling-cpu-target=default \
  --scaling-concurrency-target=default
デプロイが完了しました。
Deploying...
  Creating Revision...done
  Routing traffic...done
Done.
Service [hello] revision [hello-00007-4bp] has been deployed and is serving 100 percent of traffic.
Service URL: https://hello-123456789012.asia-northeast1.run.app
Proxy locally with: gcloud run services proxy hello --region asia-northeast1 --project your-project-id
自動スケーリング シグナルもデフォルトの自動スケーリングターゲットに戻っていました。
まとめ
2026年4月16日に Cloud Run のスケーリング制御が Preview として追加されました。固定の 60% だったオートスケーリングのターゲット値をアプリケーションの特性に合わせて調整できるようになります。
本機能を利用することで、CPU ターゲットを引き下げることにより、スケールアウトのタイミングを早めてレイテンシのスパイクを抑制でき、低レイテンシが求められるユースケースでの応答性が向上させることができます。また、CPU・同時実行数それぞれの独立した制御により、I/O バウンドや CPU バウンドなど異なる特性のアプリに最適なスケーリング戦略をきめ細かく設定できたりもします。
しかし、スケーリング制御はあくまでスケールアウト・スケールインの判断に使われる利用率ターゲットです。--min-instances や --max-instances との組み合わせで総合的なスケーリング戦略を設計することが大切になってきます。
Cloud Run サービスのスケーリング挙動に課題を感じている場合は、スケーリング制御の活用を検討してみてはいかがでしょうか。
この記事が誰かの助けになれば幸いです。
以上、クラウド事業本部コンサルティング部の渡邉でした!