
Flutterアプリ開発ではflutter devices/flutter runコマンドを使いこなせると便利そう
この記事は公開されてから1年以上経過しています。情報が古い可能性がありますので、ご注意ください。
こんにちは、CX事業本部 IoT事業部の若槻です。
前回のエントリでFlutterアプリ開発のデバッグ環境を整えてみました。
その後もデバッグ環境を触っていると、flutter devicesおよびflutter runコマンドを使いこなせると便利そうだったので書き留めておきます。
前提
前回のエントリの内容を実施済みである前提とします。
環境は次のとおりです。
- MacOS Big Sur Version 11.6
- Visual Studio Code 1.66.1
- Google Chrome 100.0.4896.75(Official Build) (x86_64)
- iOS Simulator 13.2 (972.2)
- Flutter 2.10.4
Flutterプロジェクト内でコマンドを実行していきます。
$ flutter analyze
Analyzing flutter_sample_app...
No issues found! (ran in 1.7s)
flutter devices
flutter devicesコマンドを実行すると、接続済みのデバイス(connected devices)を一覧表示することができます。標準ではChrome (web)が表示されるはずです。
$ flutter devices
1 connected device:

Chrome (web) • chrome • web-javascript • Google Chrome 100.0.4896.88
flutter emulatorsコマンドを実行すると利用可能なシミュレーターを確認できます。
$ flutter emulators
2 available emulators:

apple_ios_simulator • iOS Simulator • Apple  • ios
Nexus_6_API_R       • Nexus 6 API R • Google • android

To run an emulator, run 'flutter emulators --launch <emulator id>'.
To create a new emulator, run 'flutter emulators --create [--name xyz]'.

You can find more information on managing emulators at the links below:
  https://developer.android.com/studio/run/managing-avds
  https://developer.android.com/studio/command-line/avdmanager
iOSシミュレーターを起動してみます。
$ flutter emulators --launch apple_ios_simulator
シミュレーターを起動した状態であれば、そのデバイスもflutter devicesの結果一覧に表示されます。
$ flutter devices
2 connected devices:

iPhone 13 Pro Max (mobile) • 89C47CAB-7784-471C-8E5F-A71B4513A053 • ios            • com.apple.CoreSimulator.SimRuntime.iOS-15-2 (simulator)
Chrome (web)               • chrome                               • web-javascript • Google Chrome 100.0.4896.88
flutter run
flutter devicesコマンドでデバイス一覧を確認できたら、次はそれらデバイスを使用してFlutterアプリを起動してみます。
接続済みのデバイスが複数ある場合は、flutter run -d <DEVICE_ID>のようにデバイスIDをコマンドで指定します。デバイスIDはflutter devicesで確認した値(左から2列目)です。
Chrome (web)で起動
Chrome (web)で起動する場合は、chromeを指定して実行します。
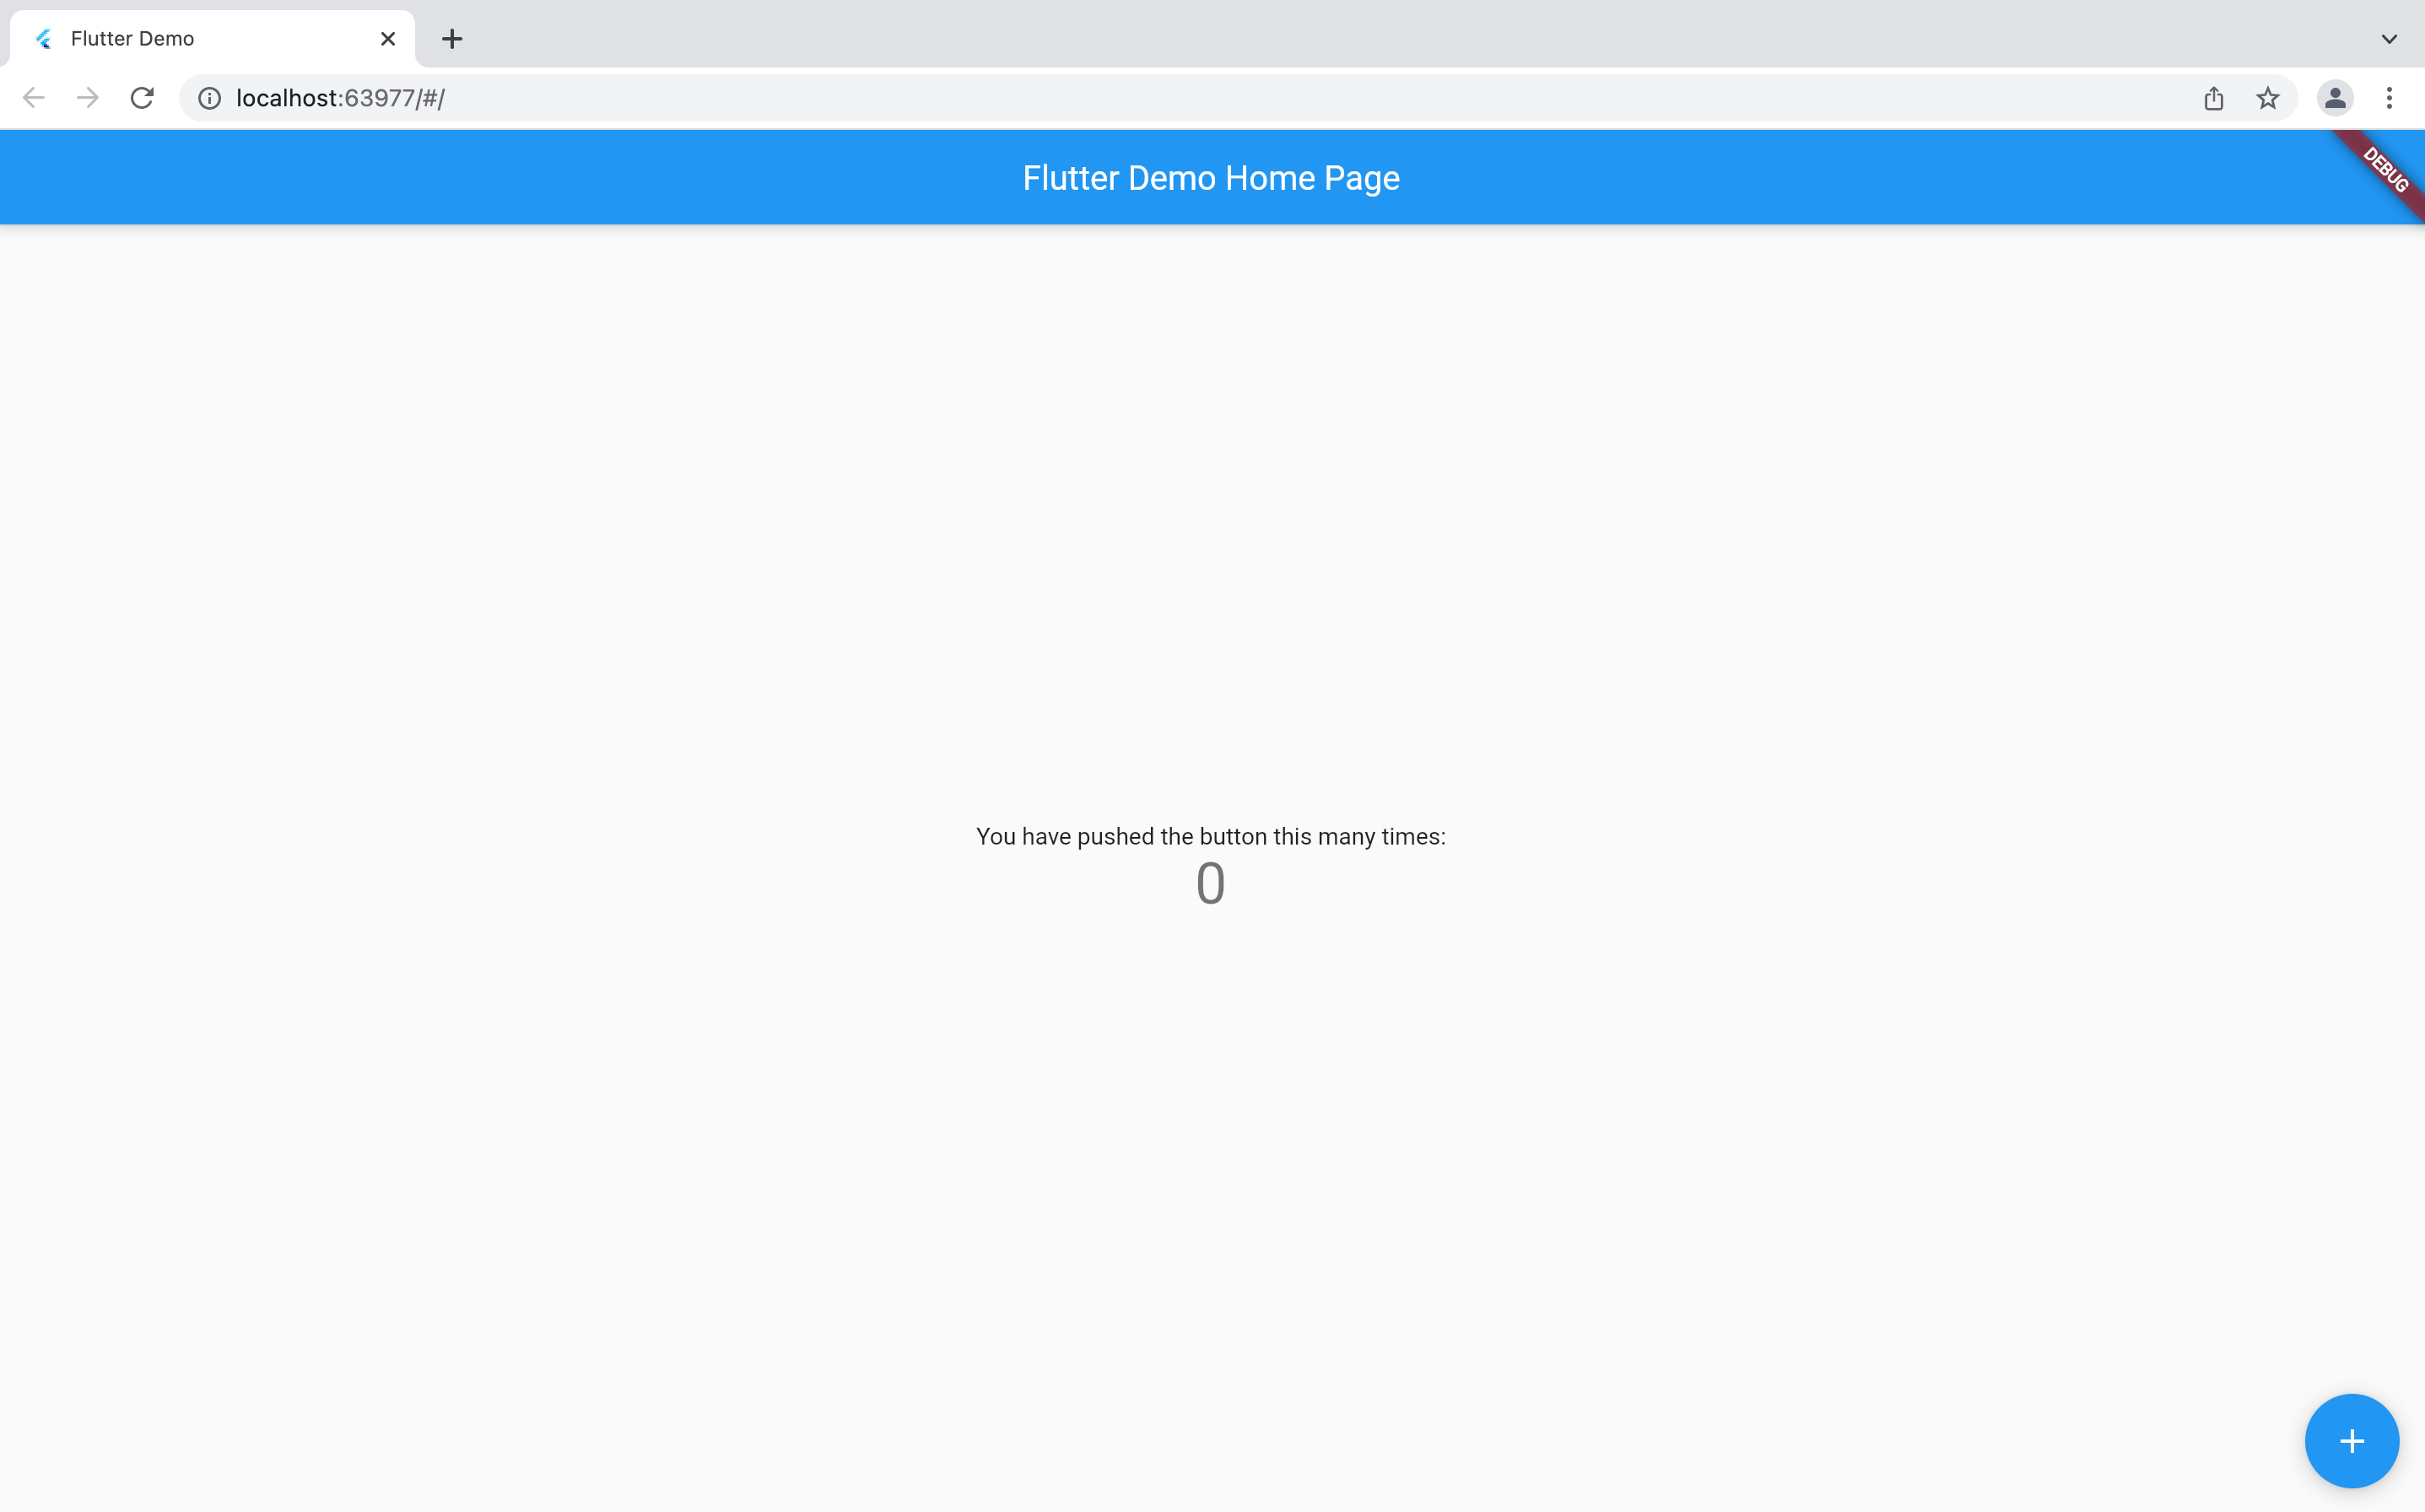
$ flutter run -d chrome

Launching lib/main.dart on Chrome in debug mode...
Waiting for connection from debug service on Chrome...             16.0s
This app is linked to the debug service: ws://127.0.0.1:64020/a0h7fgRxY3g=/ws
Debug service listening on ws://127.0.0.1:64020/a0h7fgRxY3g=/ws

💪 Running with sound null safety 💪

🔥  To hot restart changes while running, press "r" or "R".
For a more detailed help message, press "h". To quit, press "q".

An Observatory debugger and profiler on Chrome is available at: http://127.0.0.1:64020/a0h7fgRxY3g=
The Flutter DevTools debugger and profiler on Chrome is available at: http://127.0.0.1:9101?uri=http://127.0.0.1:64020/a0h7fgRxY3g=
Chromeでデバッグモードでアプリを起動できました。
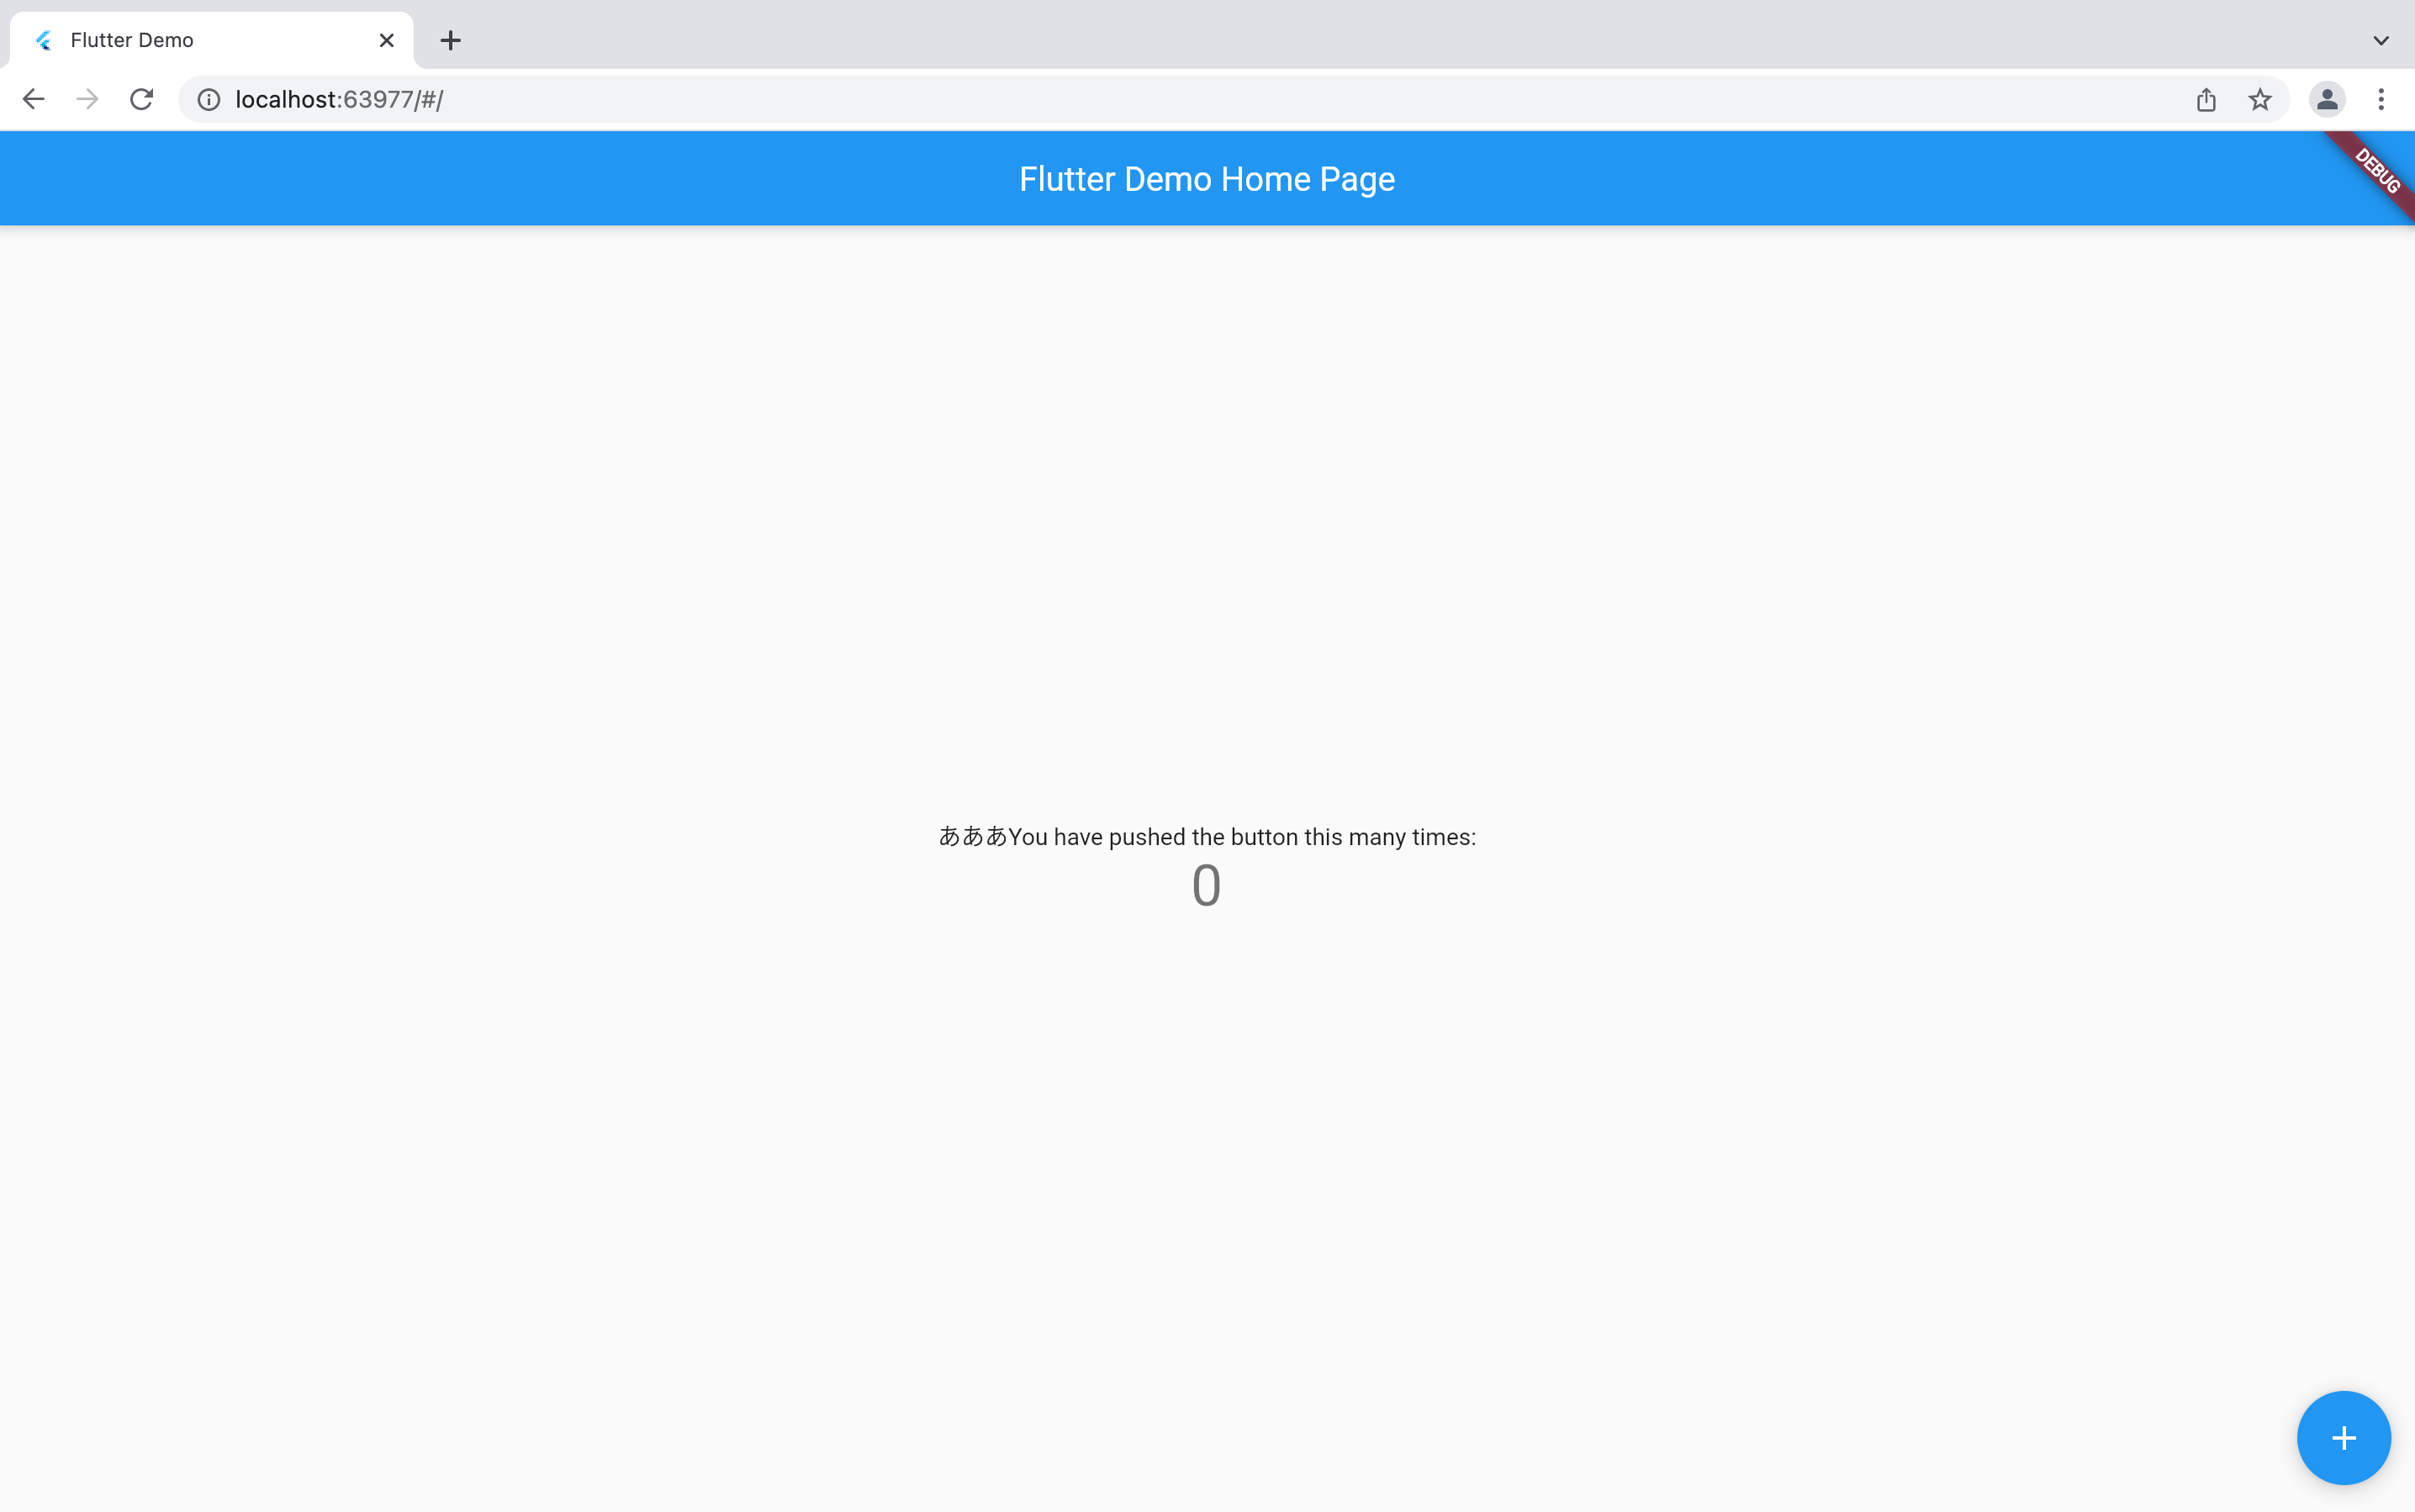
rをクリックすると、ソースコードの変更をホットリロードで反映させられます。
Performing hot restart...                                          331ms
Restarted application in 333ms.
反映されました。
hをクリックすると、ショートカット一覧を表示できます。
v Open Flutter DevTools.
w Dump widget hierarchy to the console.                                               (debugDumpApp)
t Dump rendering tree to the console.                                          (debugDumpRenderTree)
L Dump layer tree to the console.                                               (debugDumpLayerTree)
S Dump accessibility tree in traversal order.                                   (debugDumpSemantics)
U Dump accessibility tree in inverse hit test order.                            (debugDumpSemantics)
i Toggle widget inspector.                                  (WidgetsApp.showWidgetInspectorOverride)
p Toggle the display of construction lines.                                  (debugPaintSizeEnabled)
I Toggle oversized image inversion.                                     (debugInvertOversizedImages)
o Simulate different operating systems.                                      (defaultTargetPlatform)
b Toggle platform brightness (dark and light mode).                        (debugBrightnessOverride)
P Toggle performance overlay.                                    (WidgetsApp.showPerformanceOverlay)
a Toggle timeline events for all widget build methods.                    (debugProfileWidgetBuilds)
g Run source code generators.
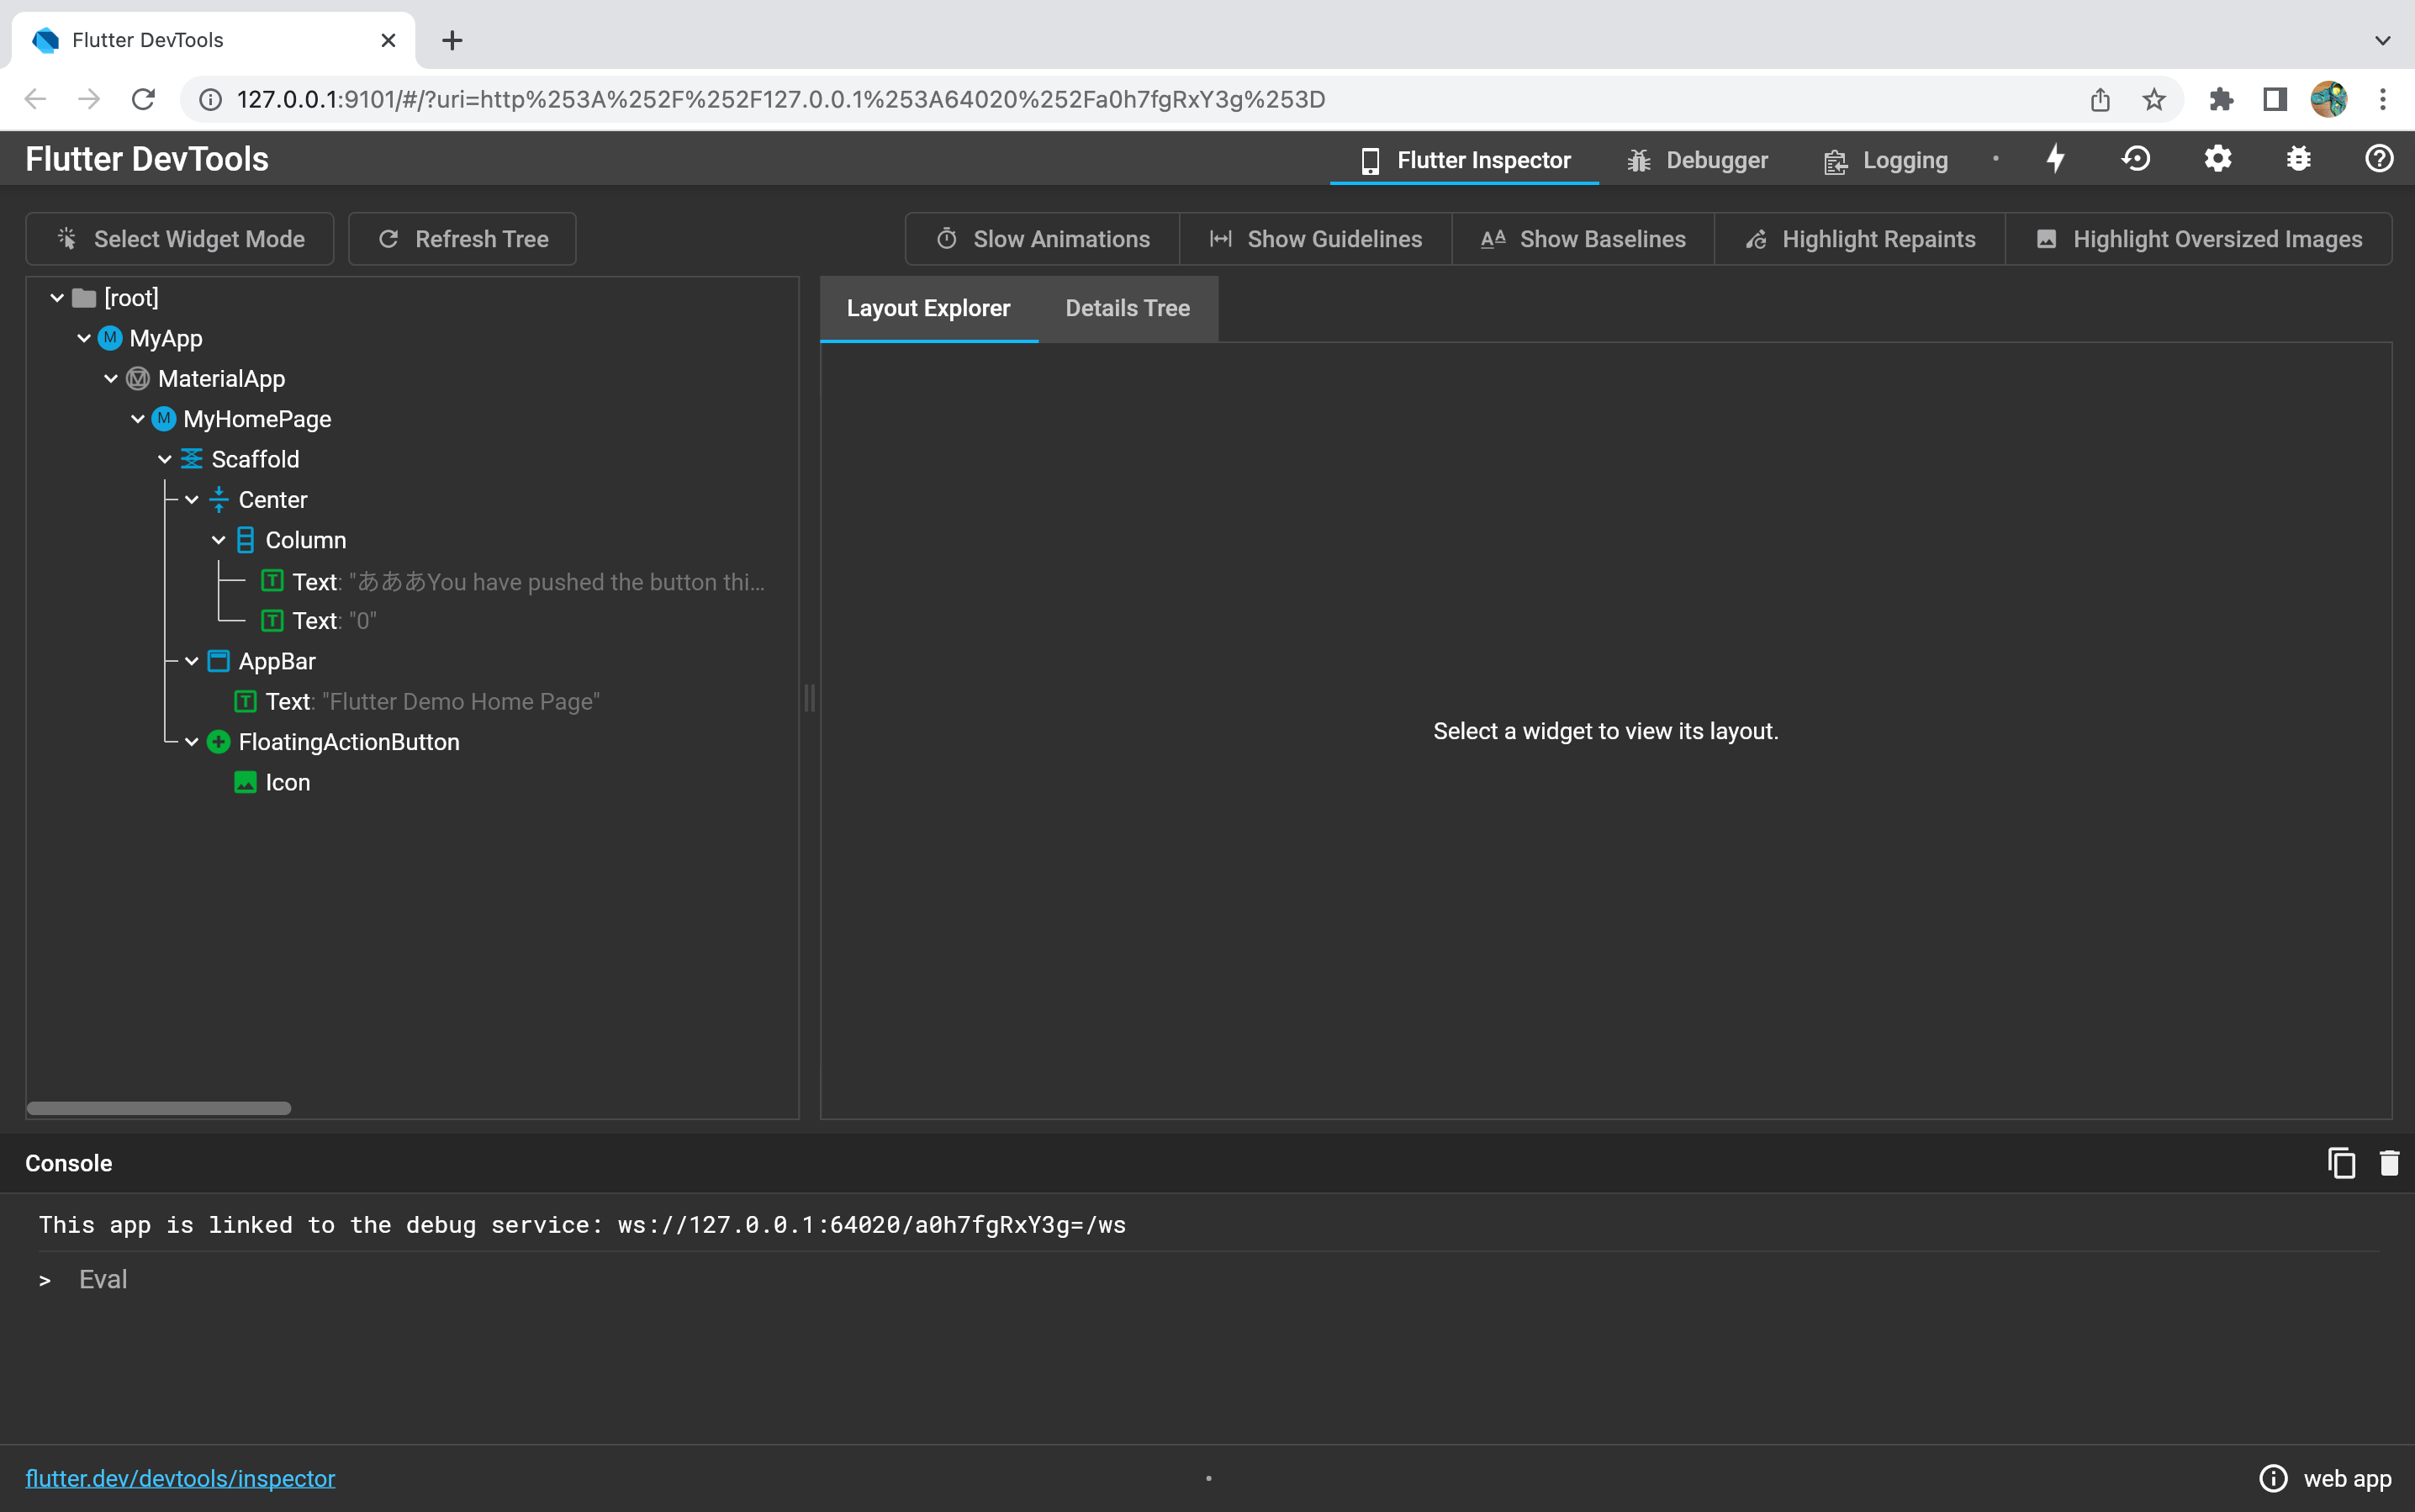
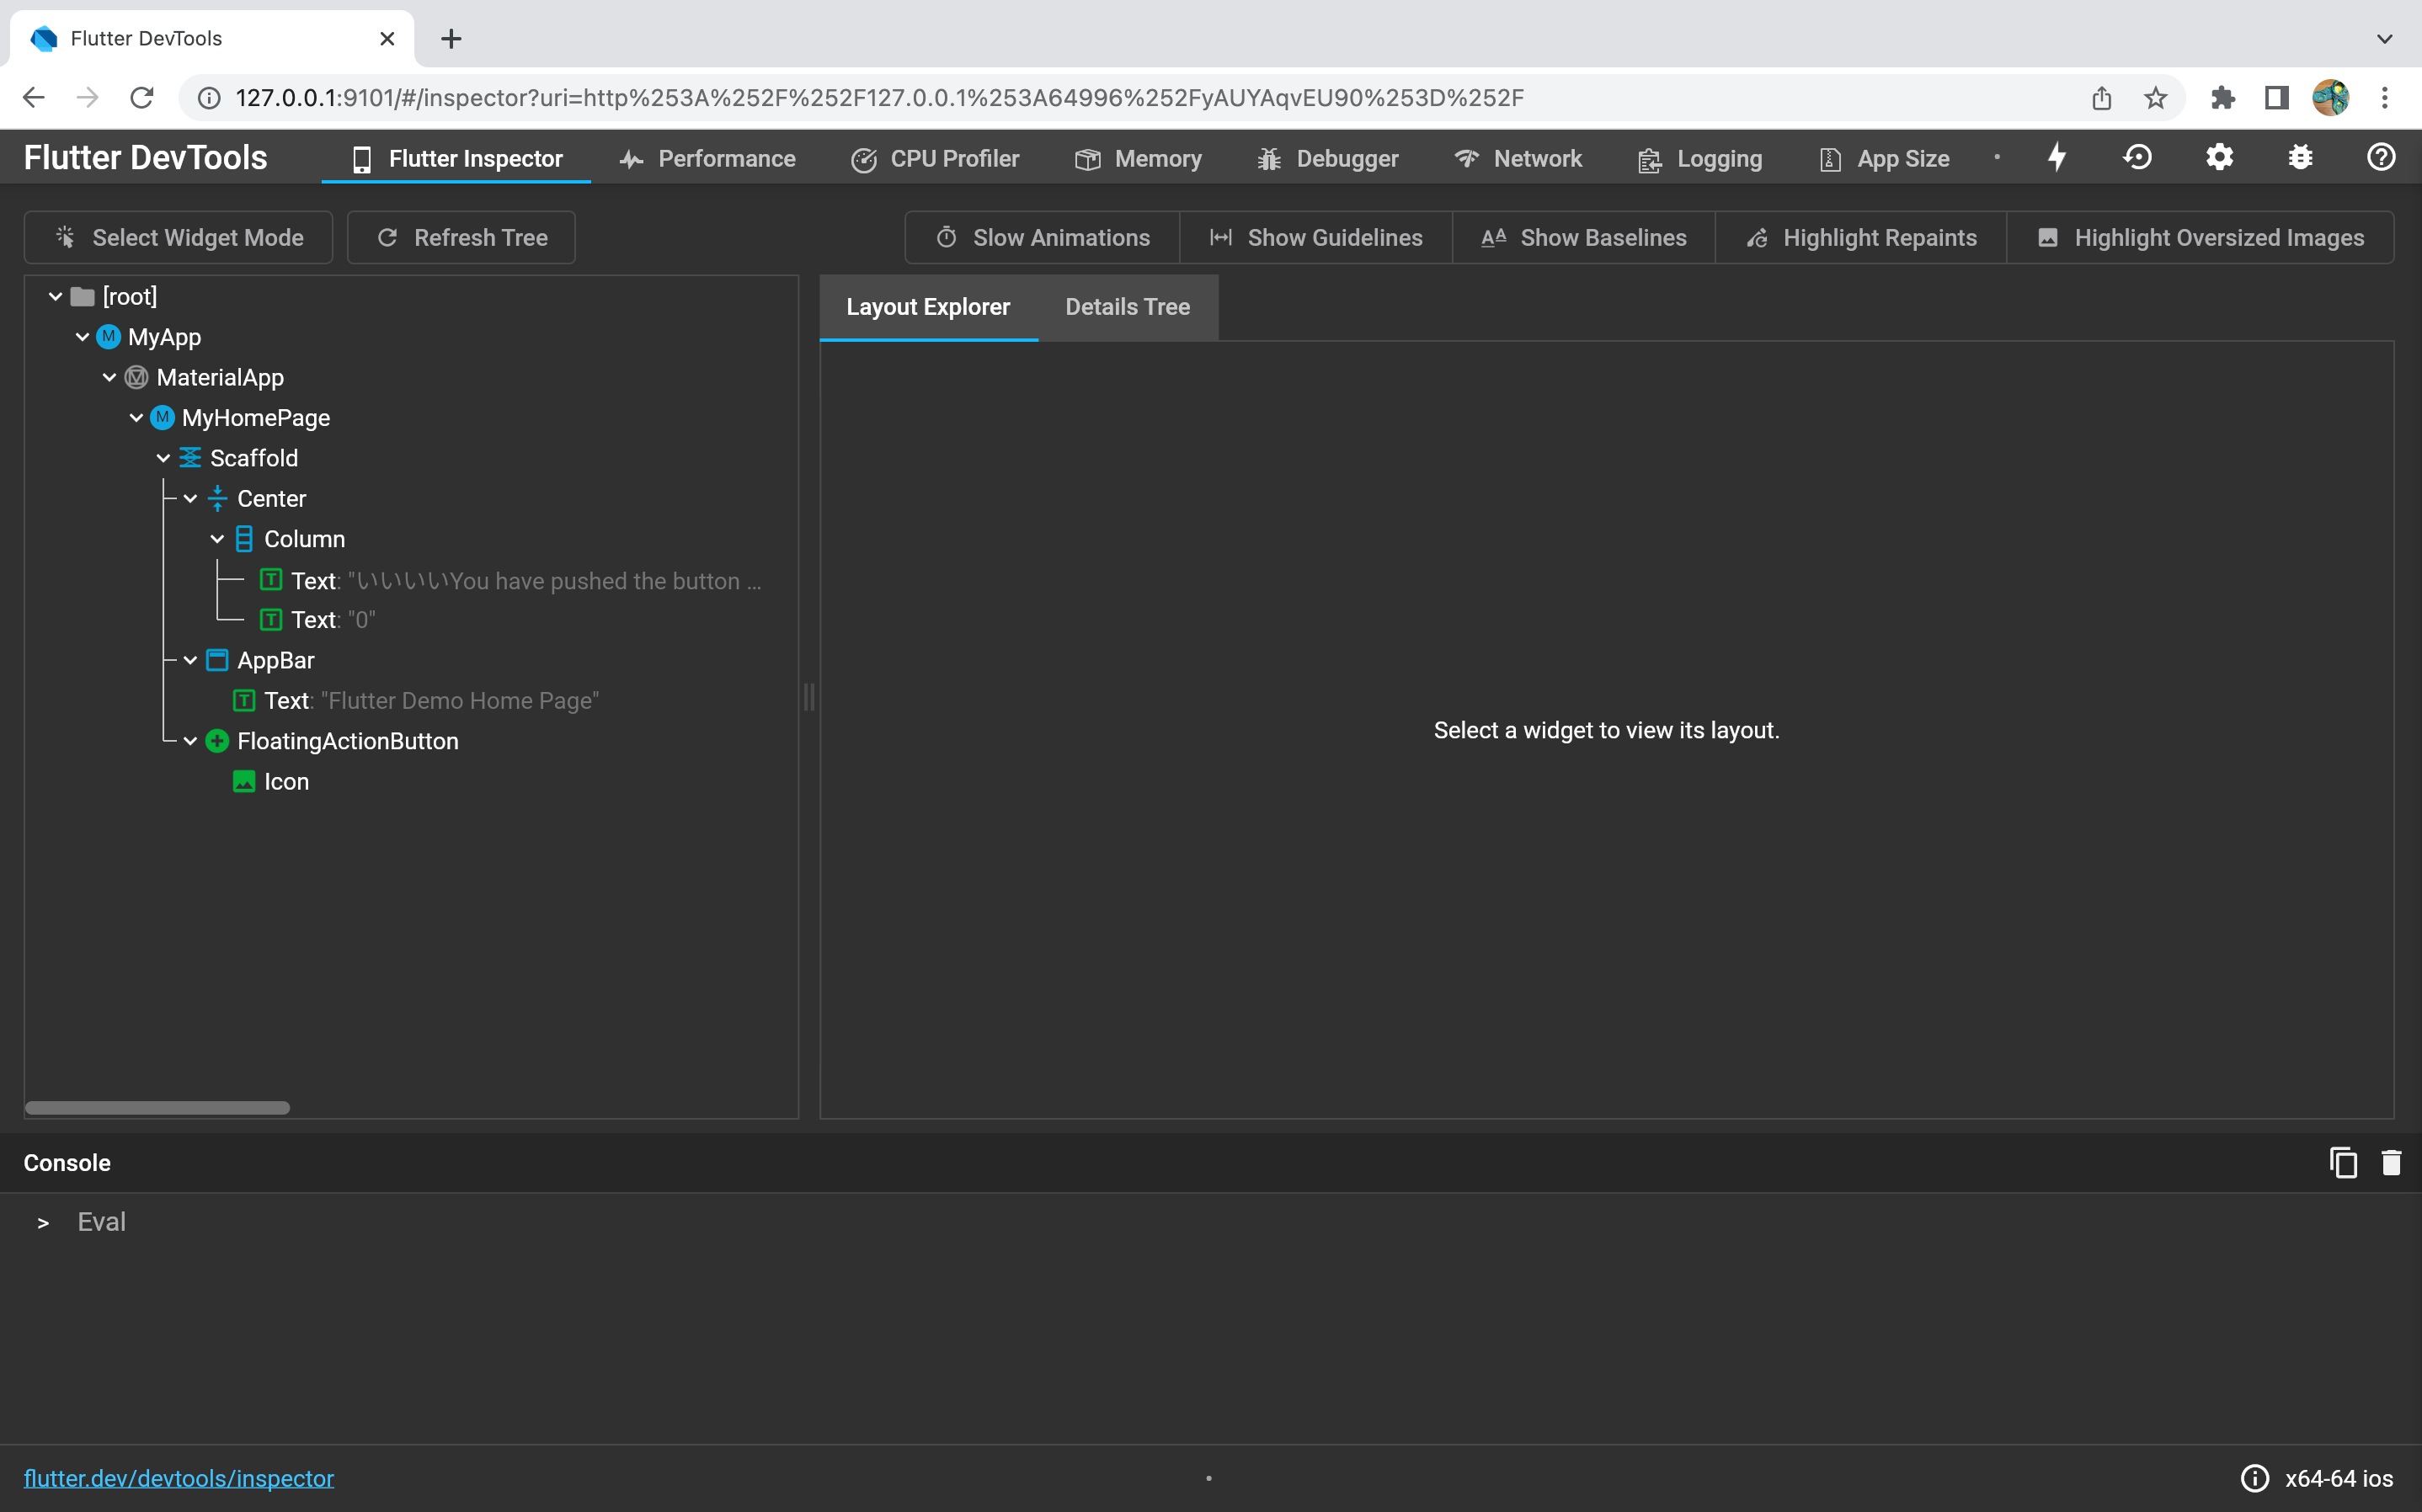
vをクリックすると、ブラウザでDevToolsを起動できます。ウィジェットのツリーが確認できます。
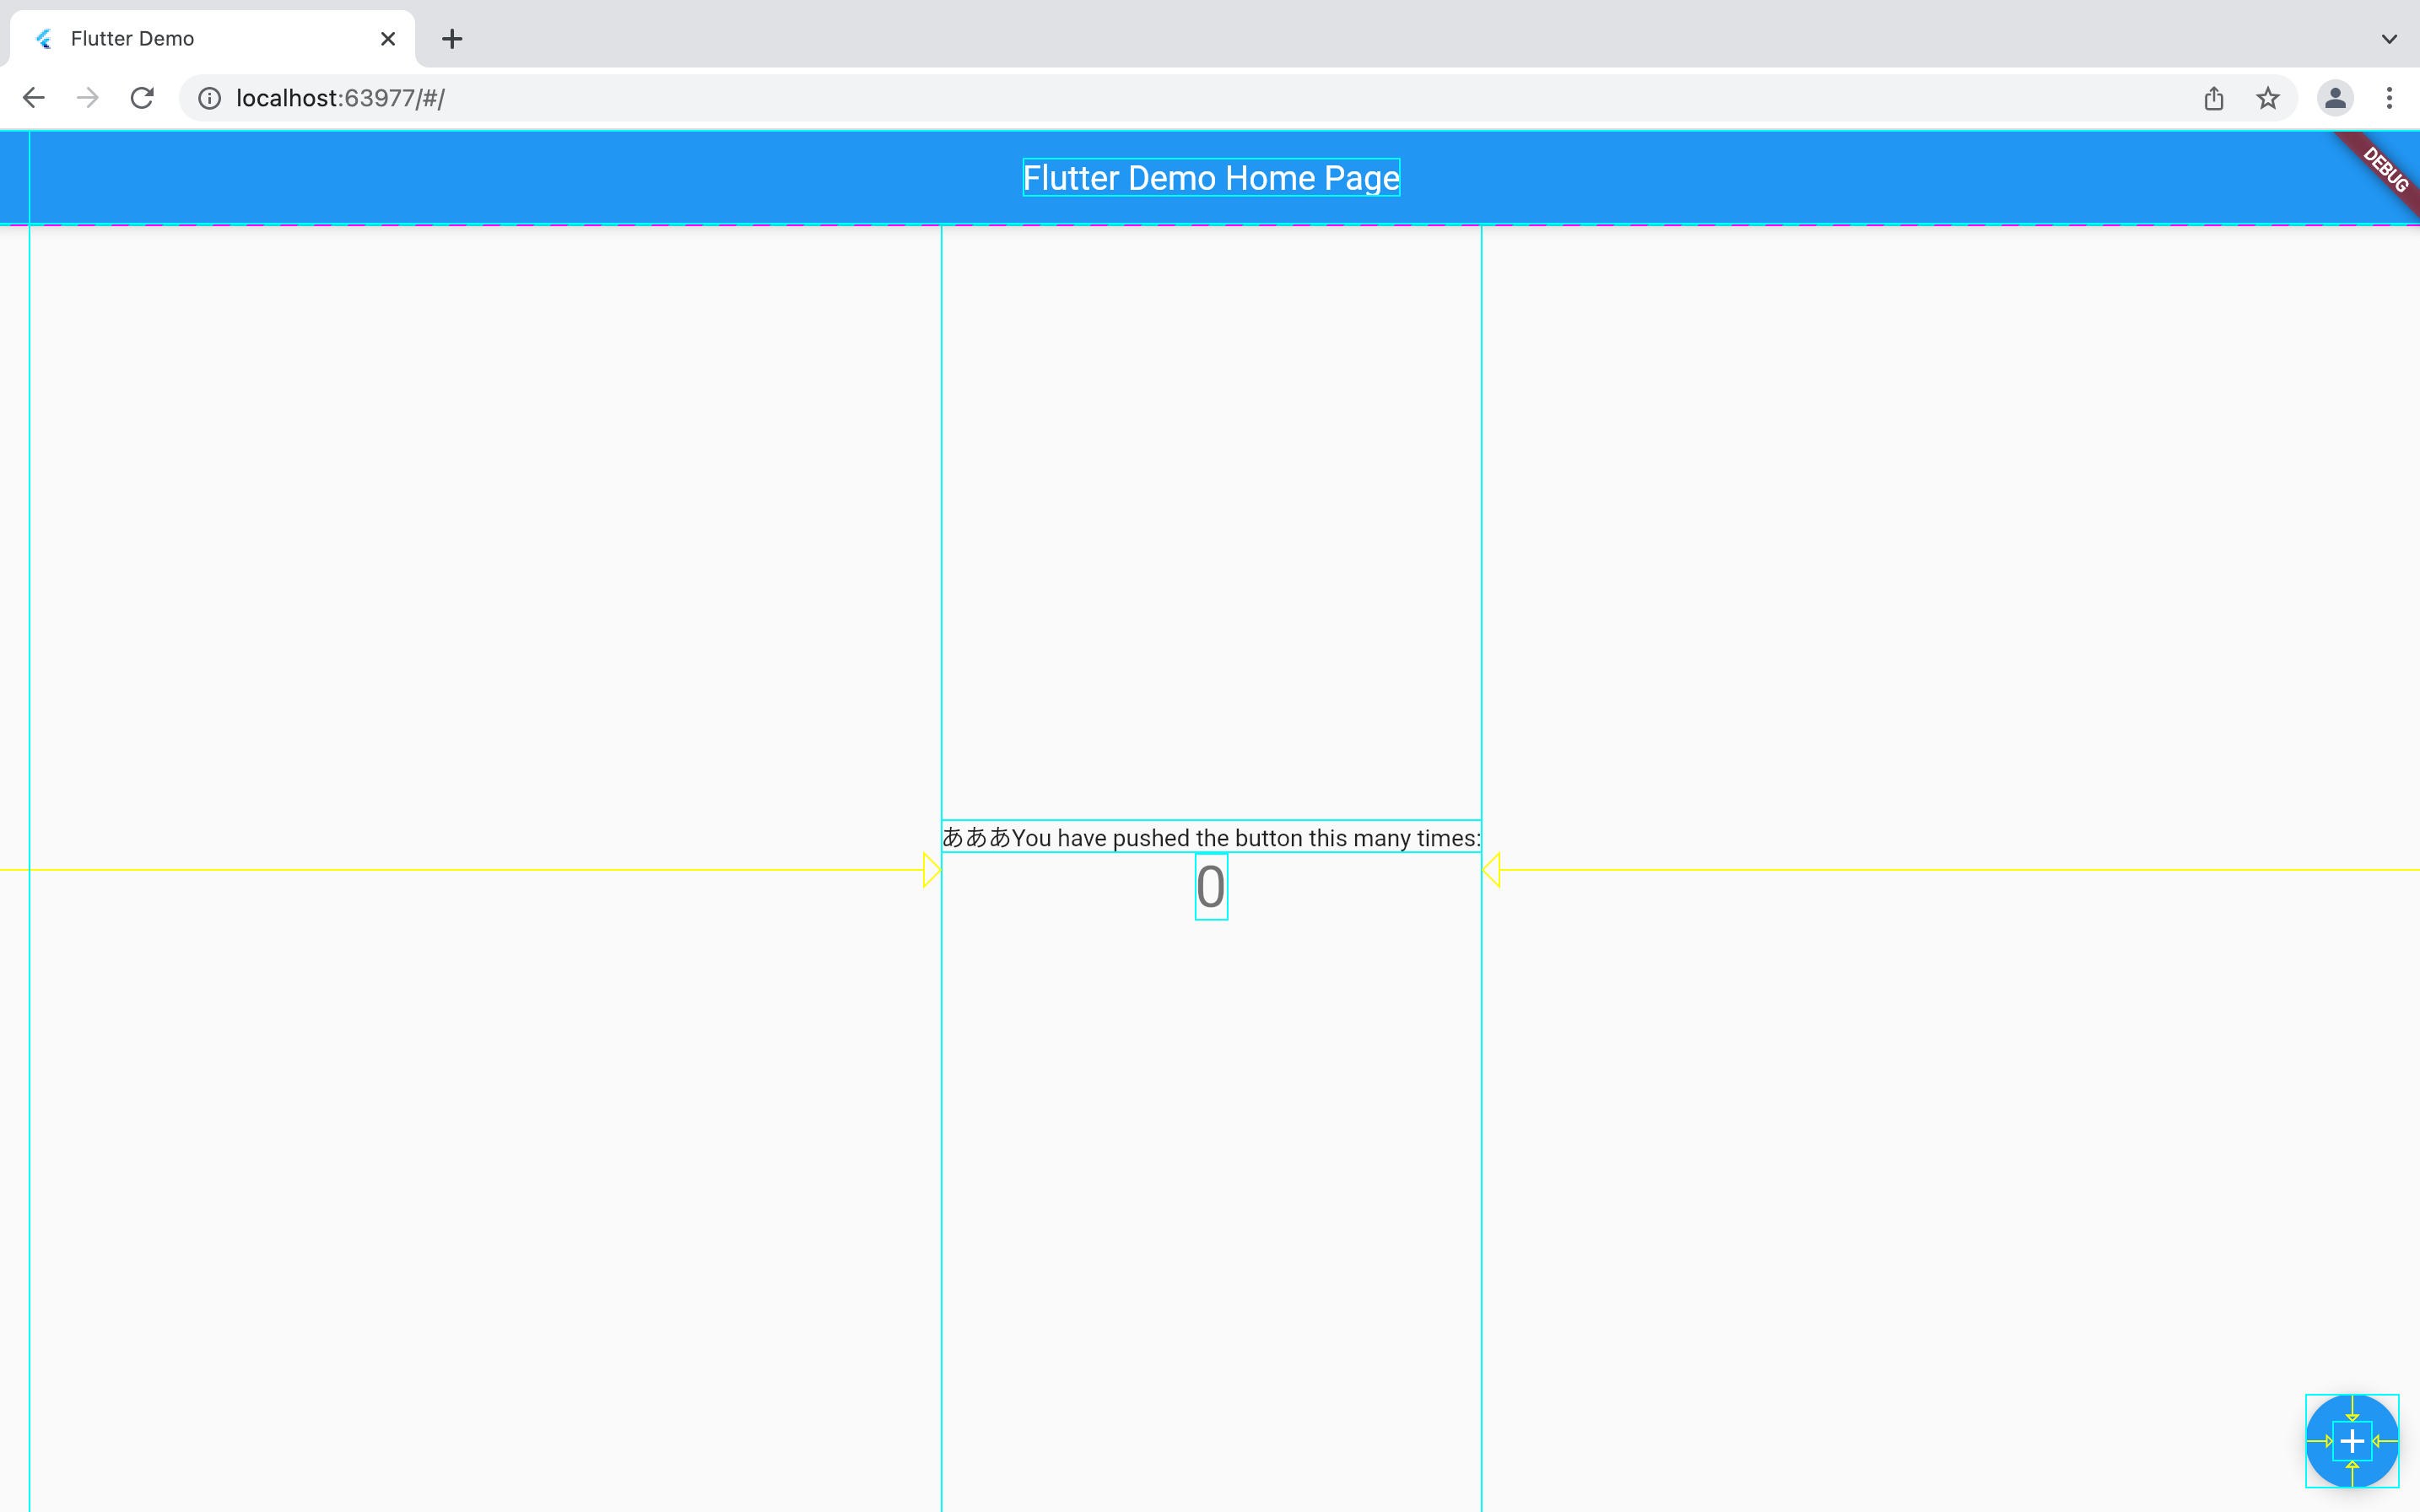
[Show Guidelines]をクリックして有効にします。
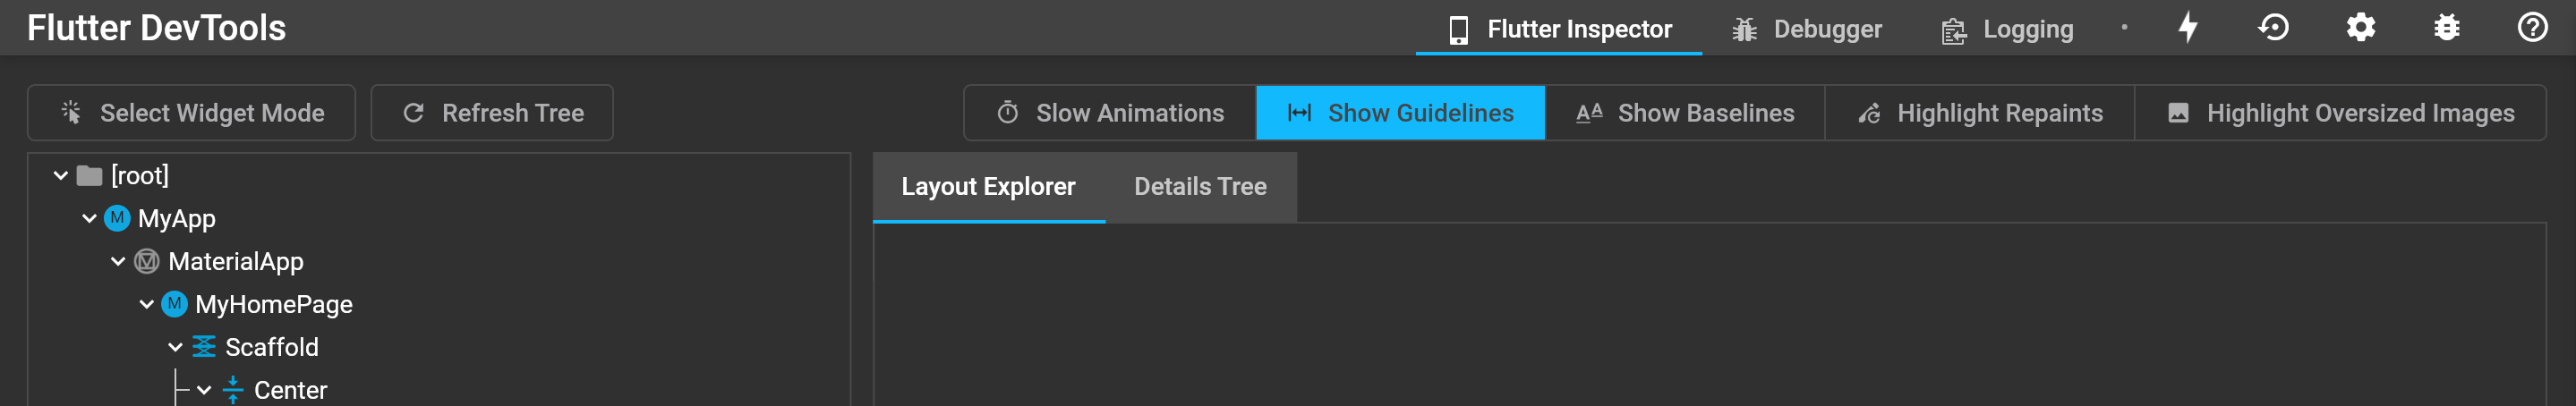
するとアプリ上にガイドラインがオーバーレイ表示されました。ウィジェットの位置を整えるのに役立ちそうです。
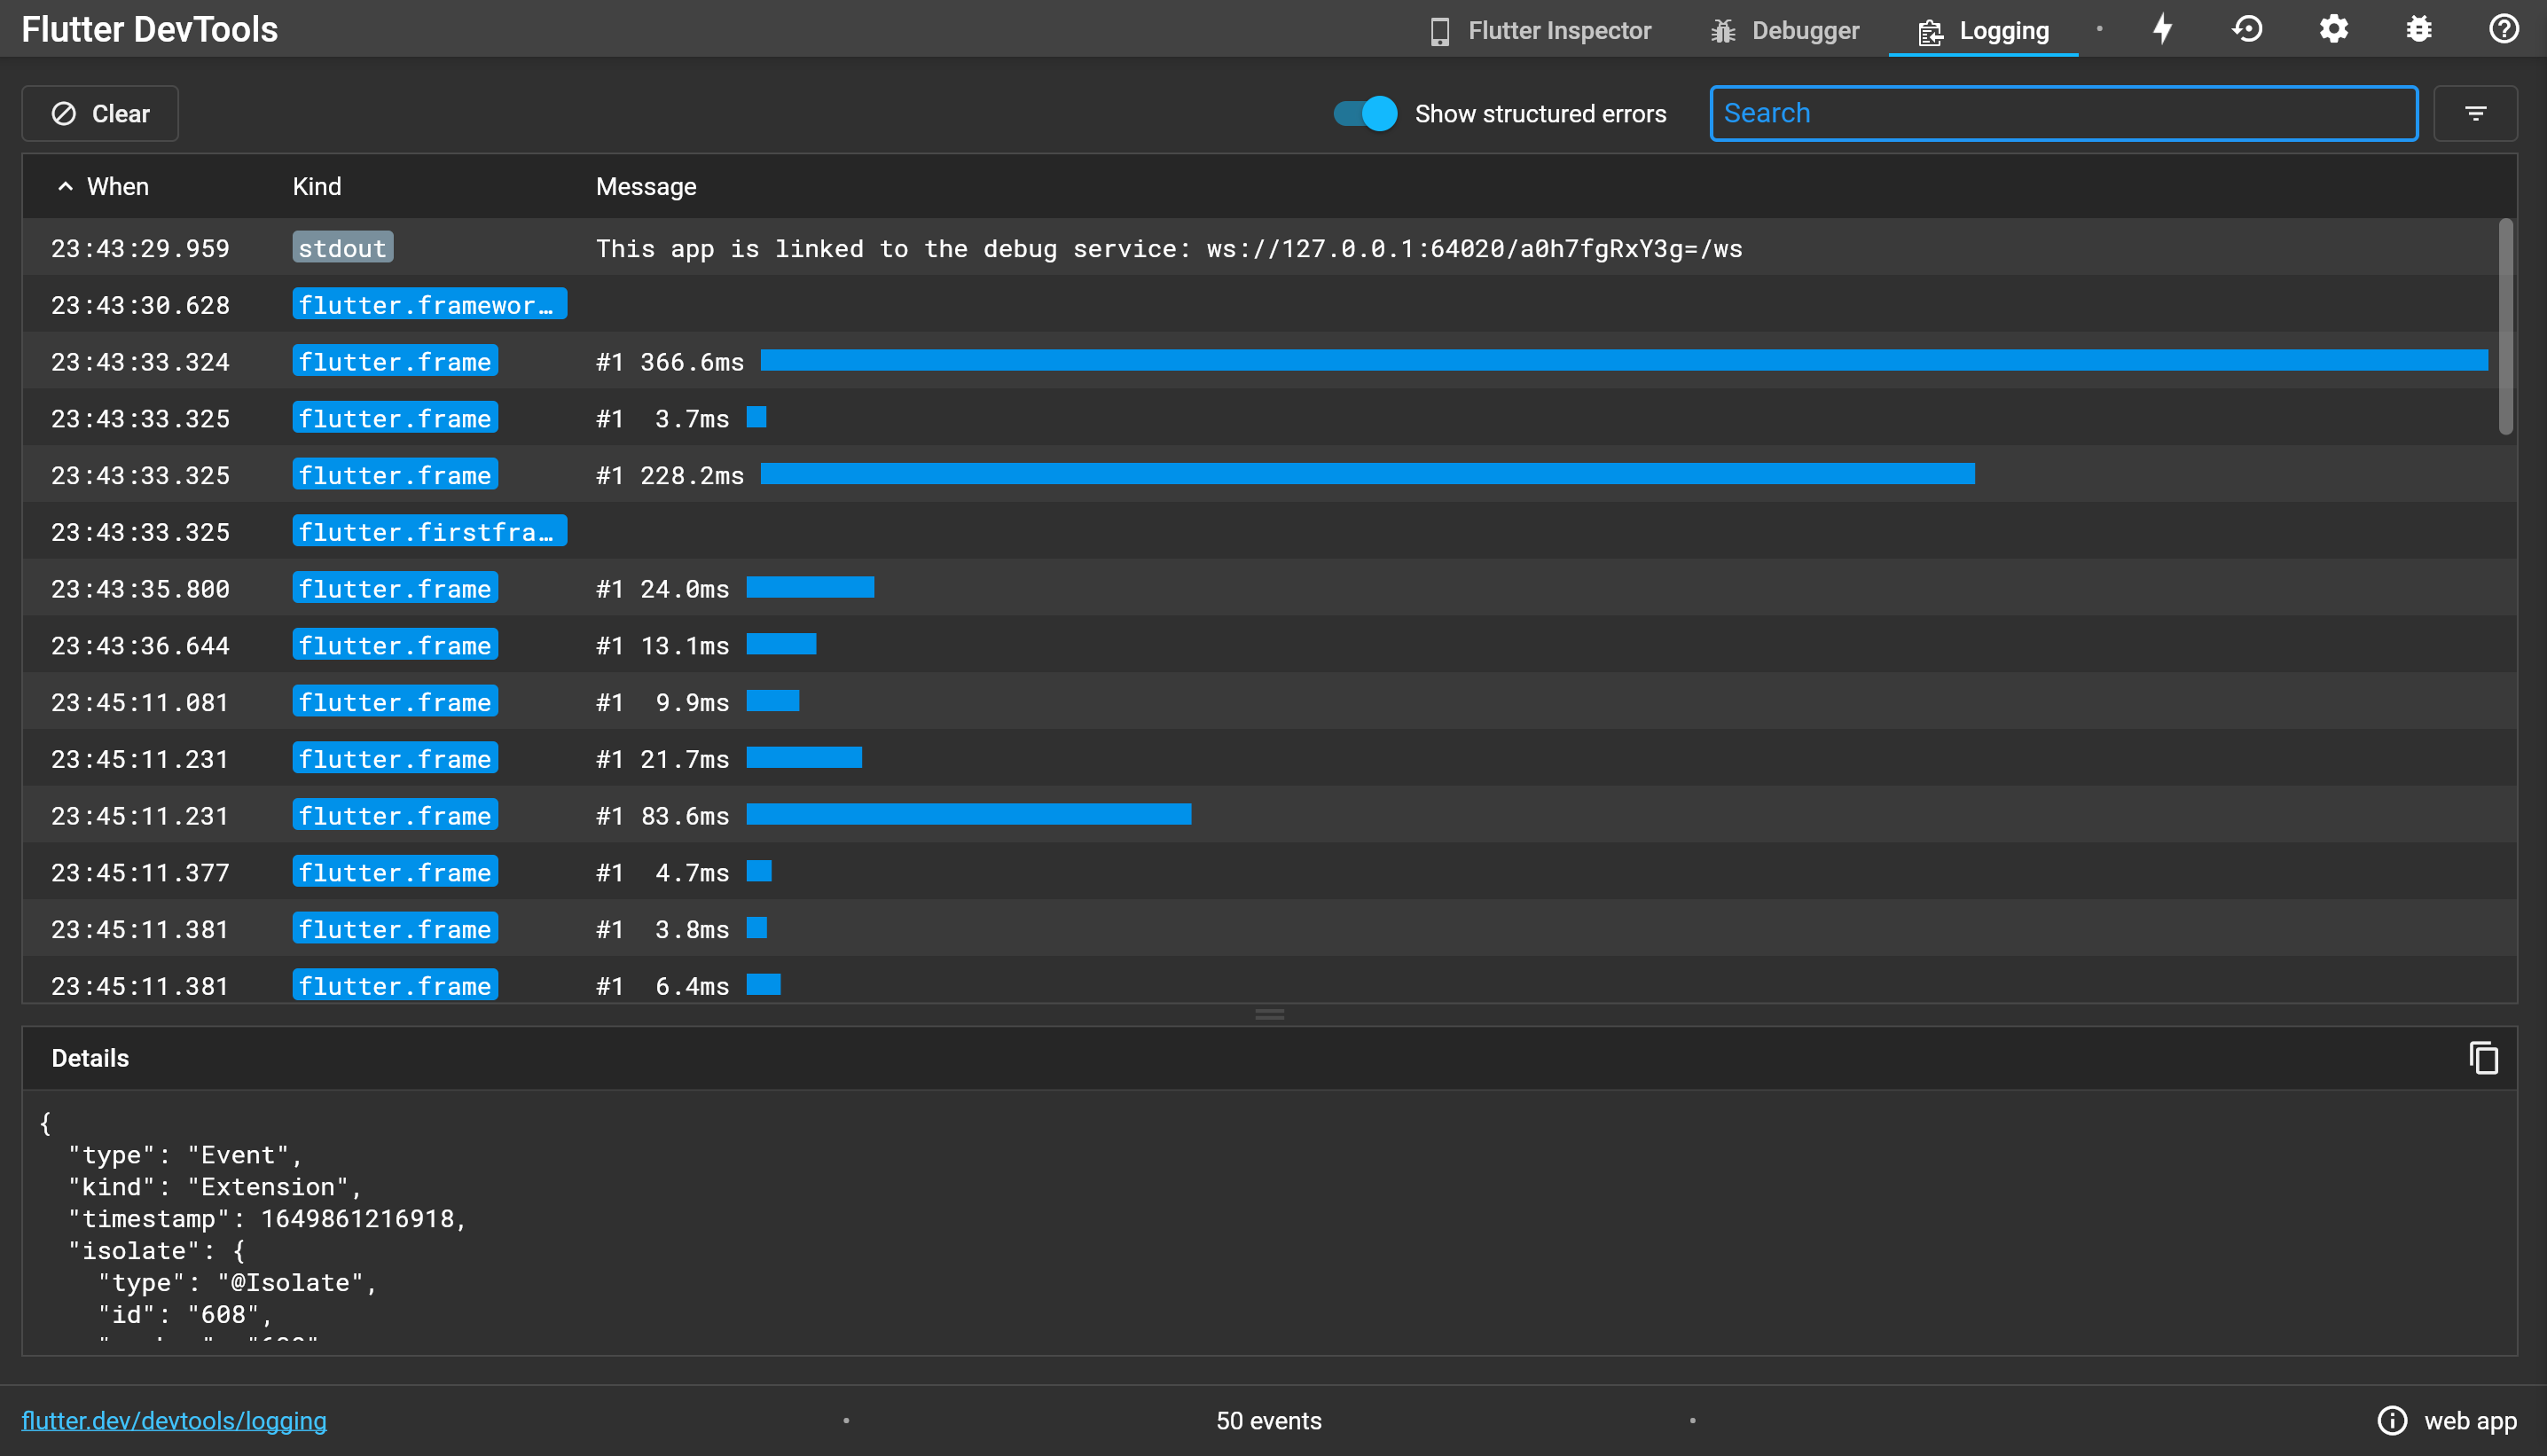
[Logging]では、ウィジェットごとの読み込み時間が比較して確認できます。遅延のボトルネックを突き止めるのに役立ちそうです。
iOS Simulatorで起動
iOS Simulatorで起動する場合も、flutter devicesで確認した該当するデバイスのIDを指定してflutter run -d <DEVICE_ID>と実行します。
$ flutter devices
2 connected devices:

iPhone 13 Pro Max (mobile) • 89C47CAB-7784-471C-8E5F-A71B4513A053 • ios            • com.apple.CoreSimulator.SimRuntime.iOS-15-2 (simulator)
Chrome (web)               • chrome                               • web-javascript • Google Chrome 100.0.4896.88
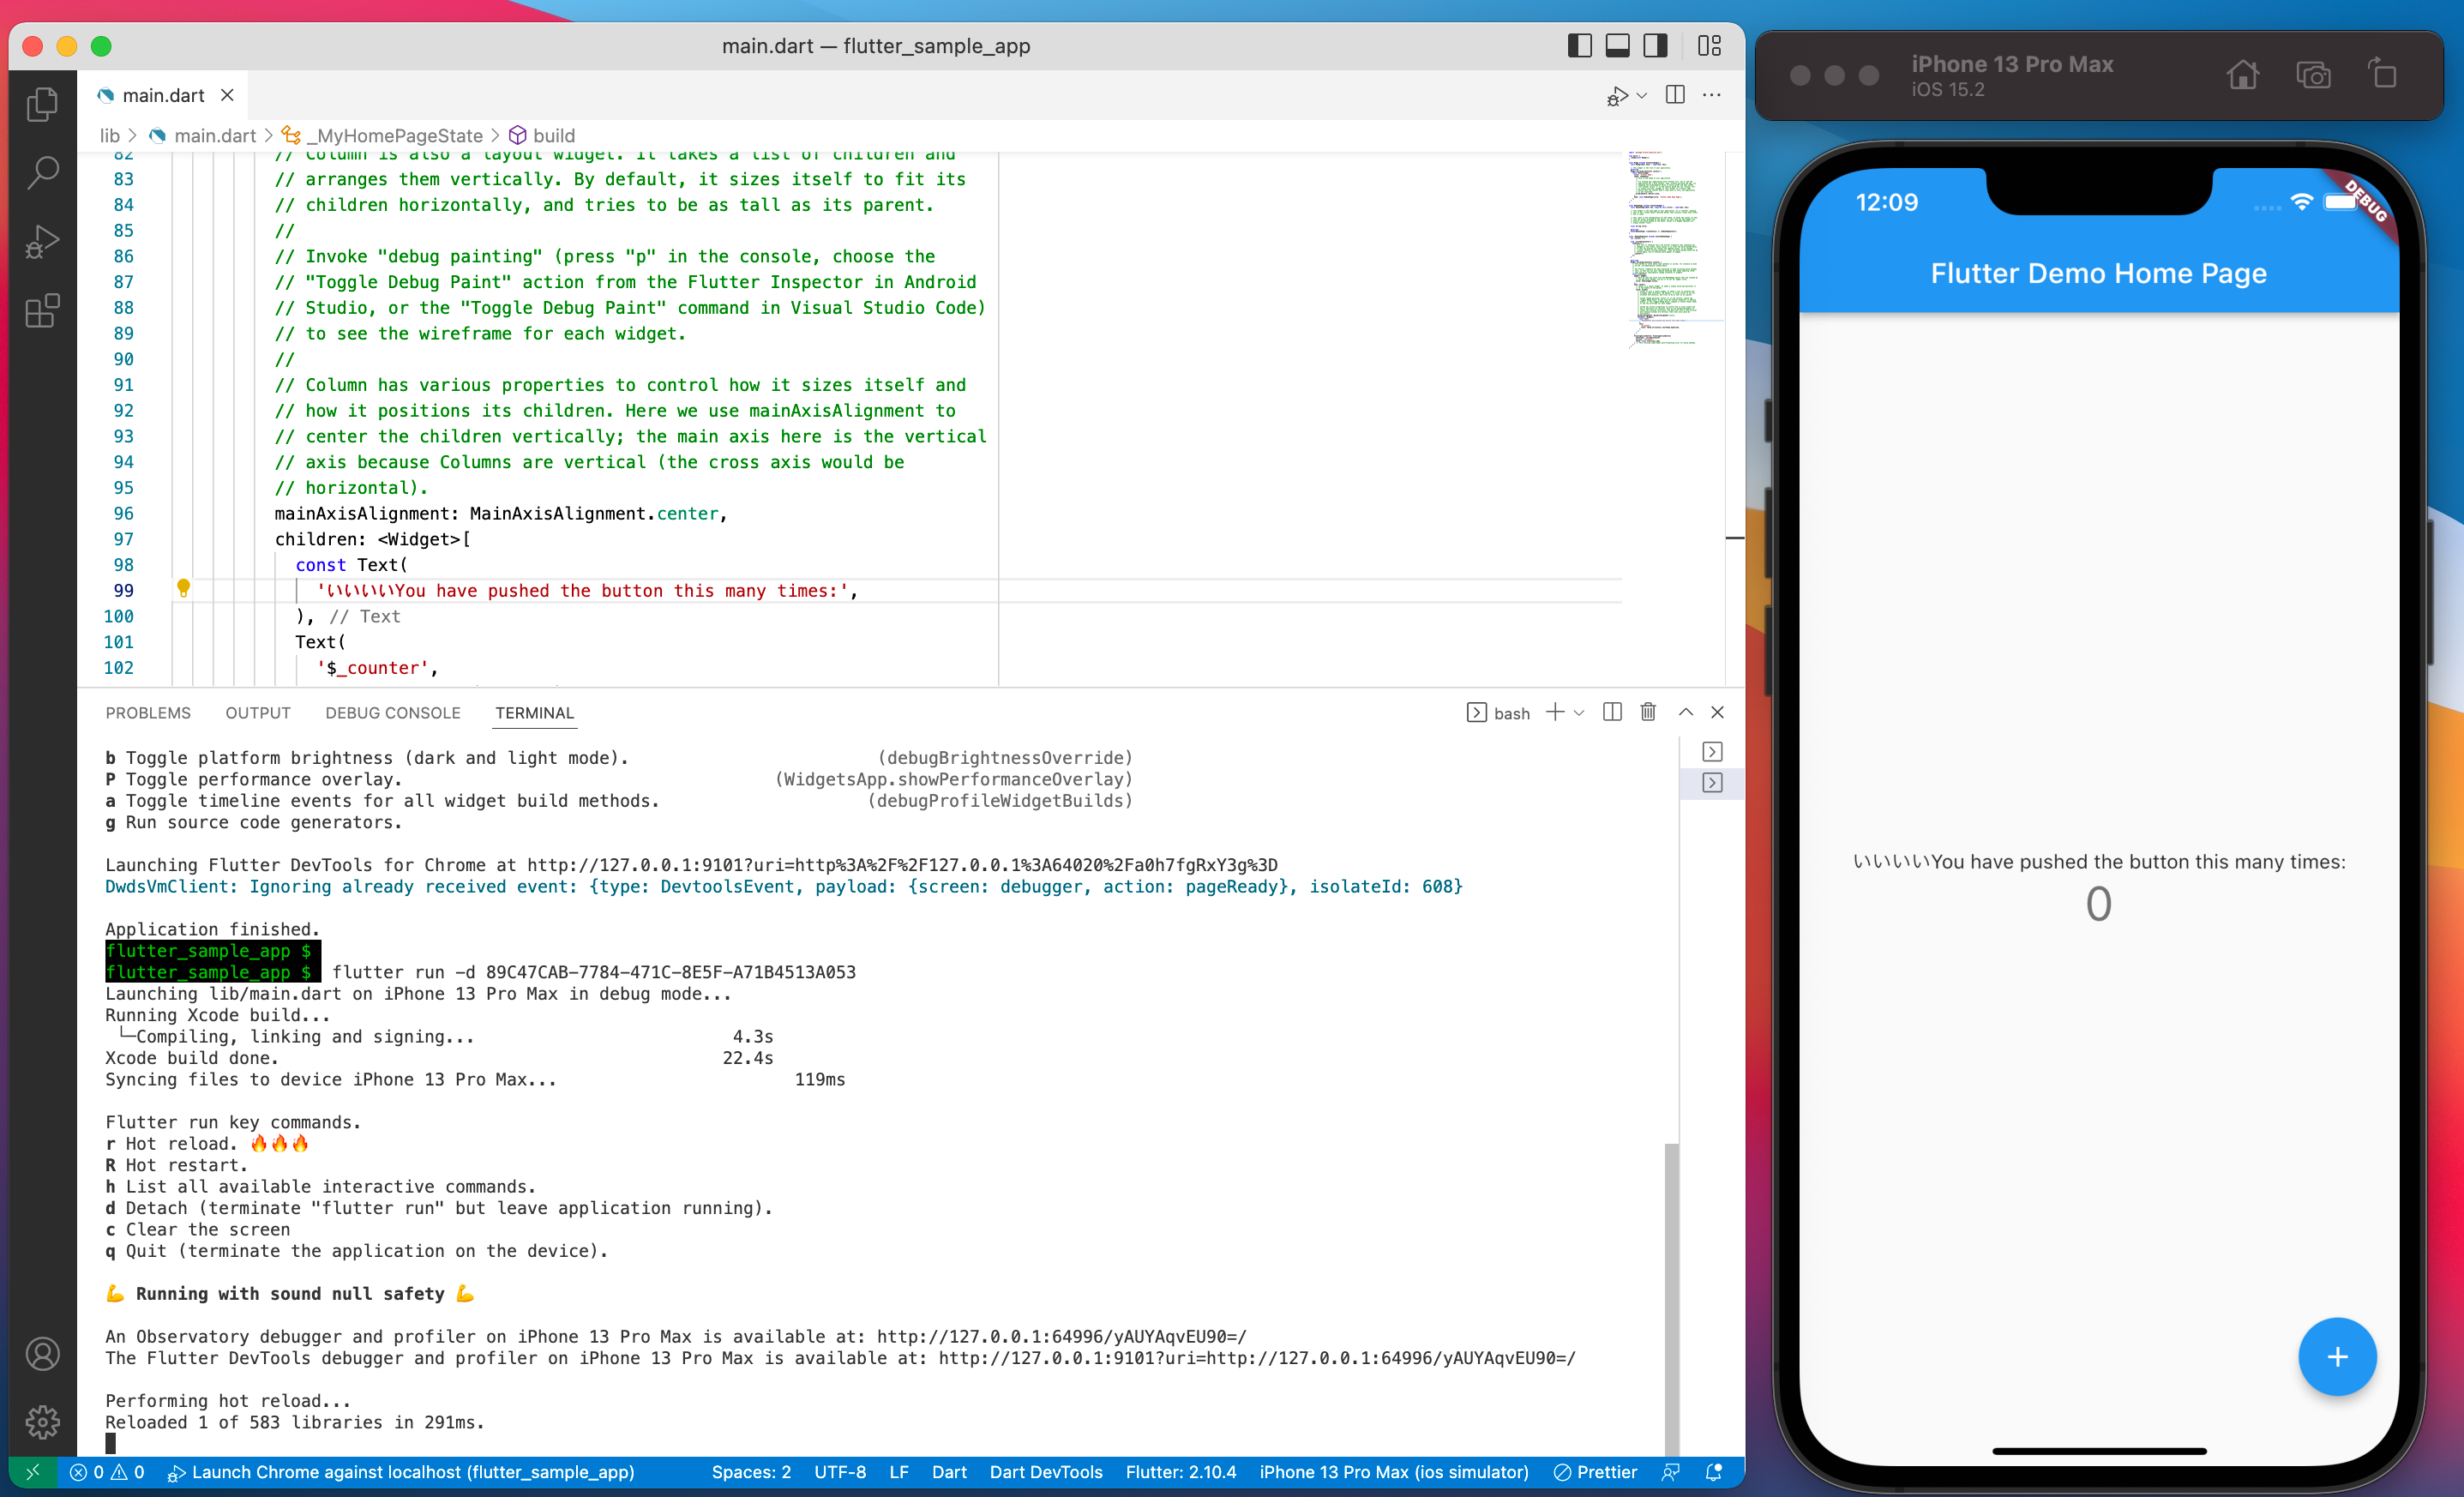
$ flutter run -d 89C47CAB-7784-471C-8E5F-A71B4513A053
アプリのビルドが行われます。
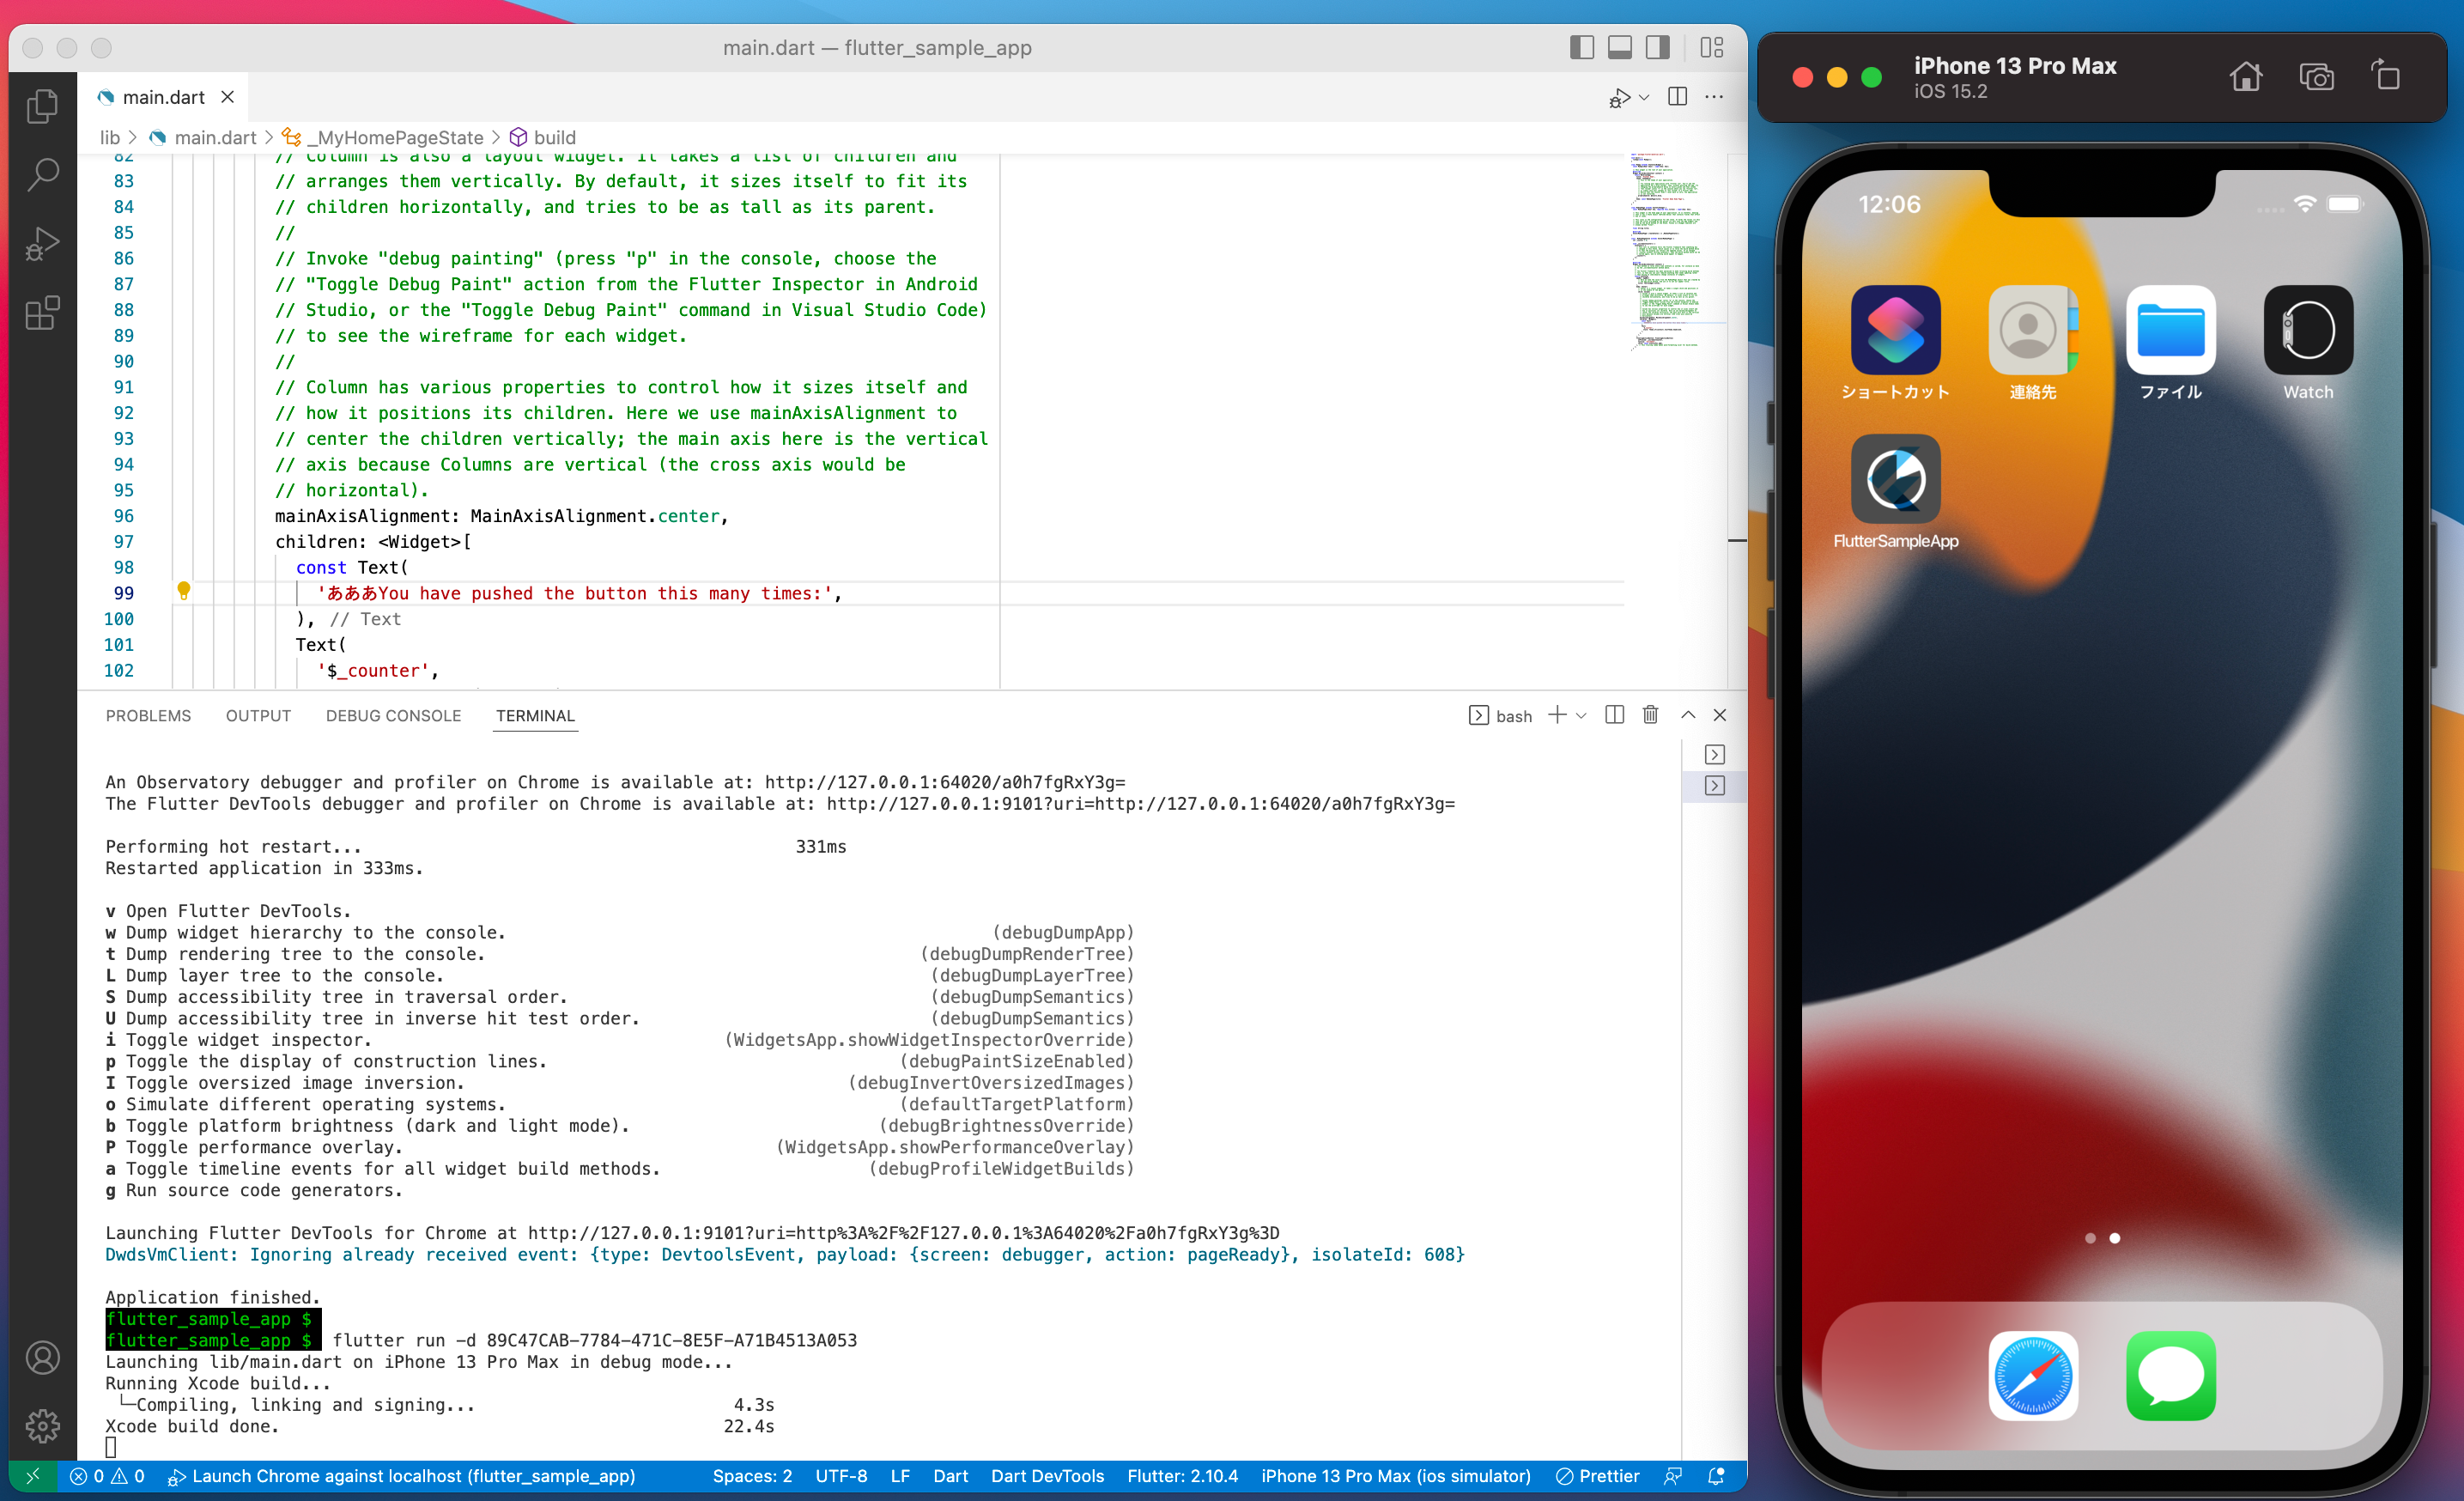
アプリを起動できました。
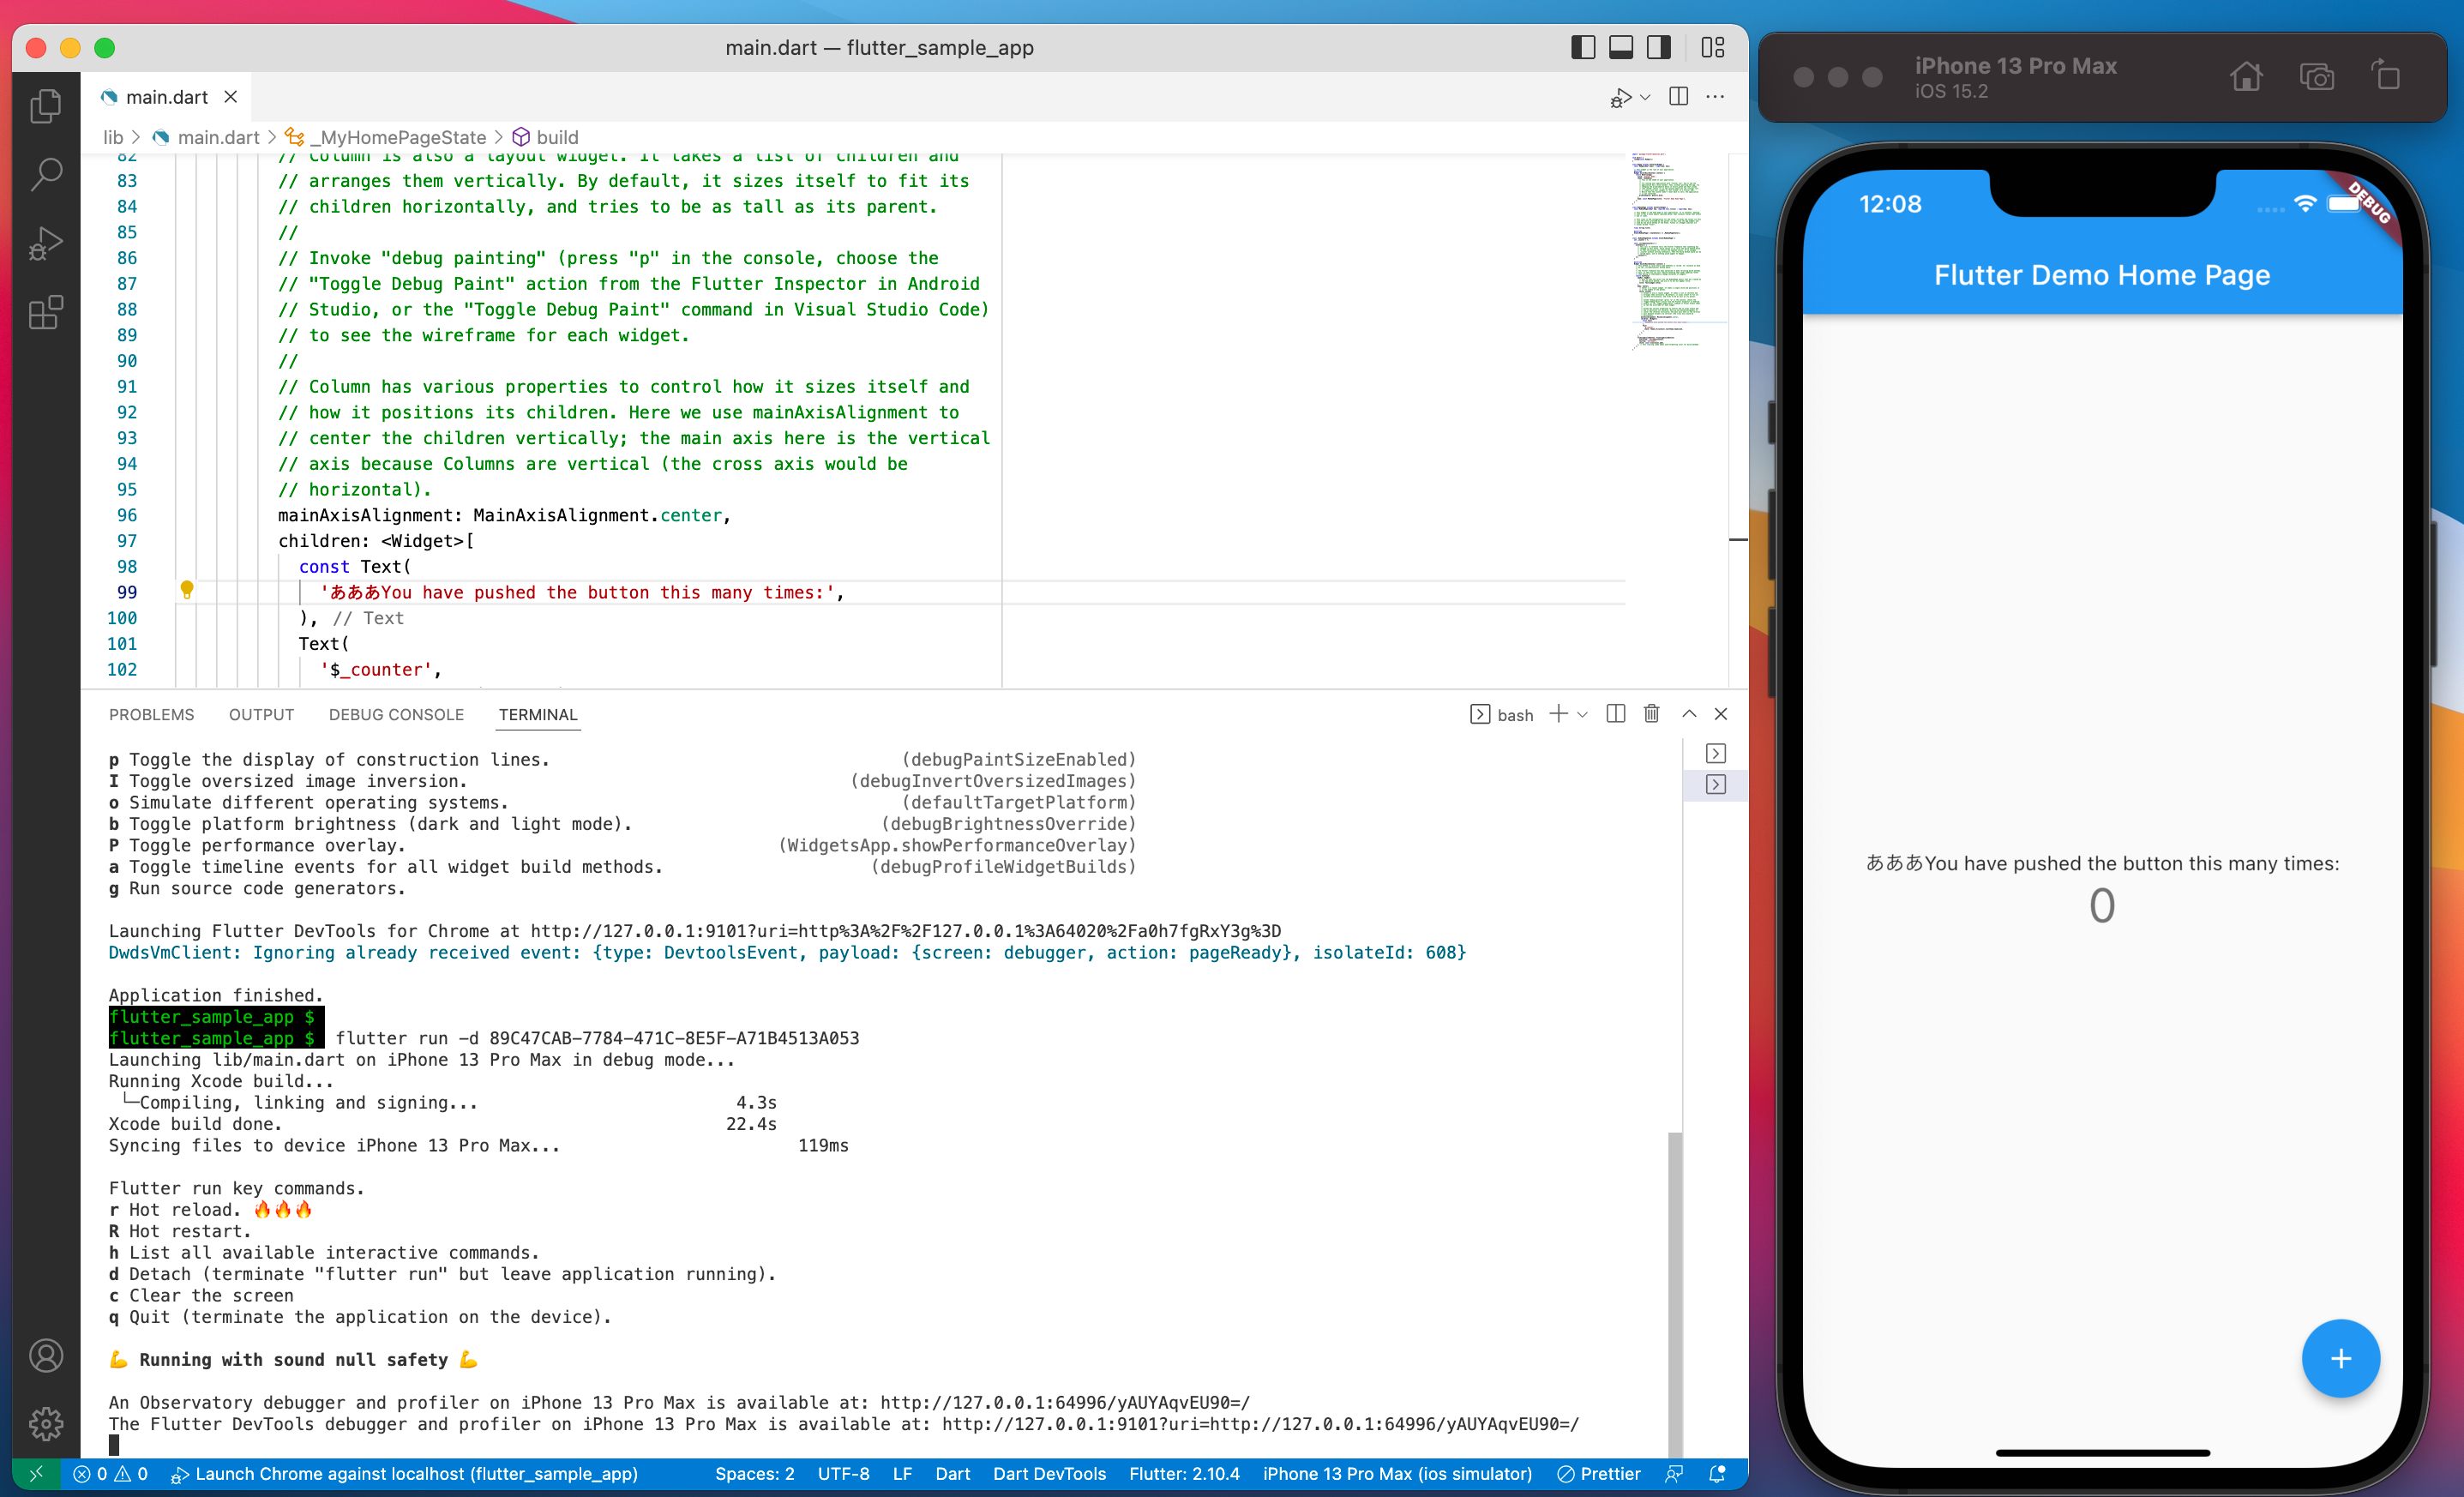
rをクリックすると、ソースコードの変更をホットリロードで反映させられます。
vをクリックすると、ブラウザでDevToolsを起動できます。
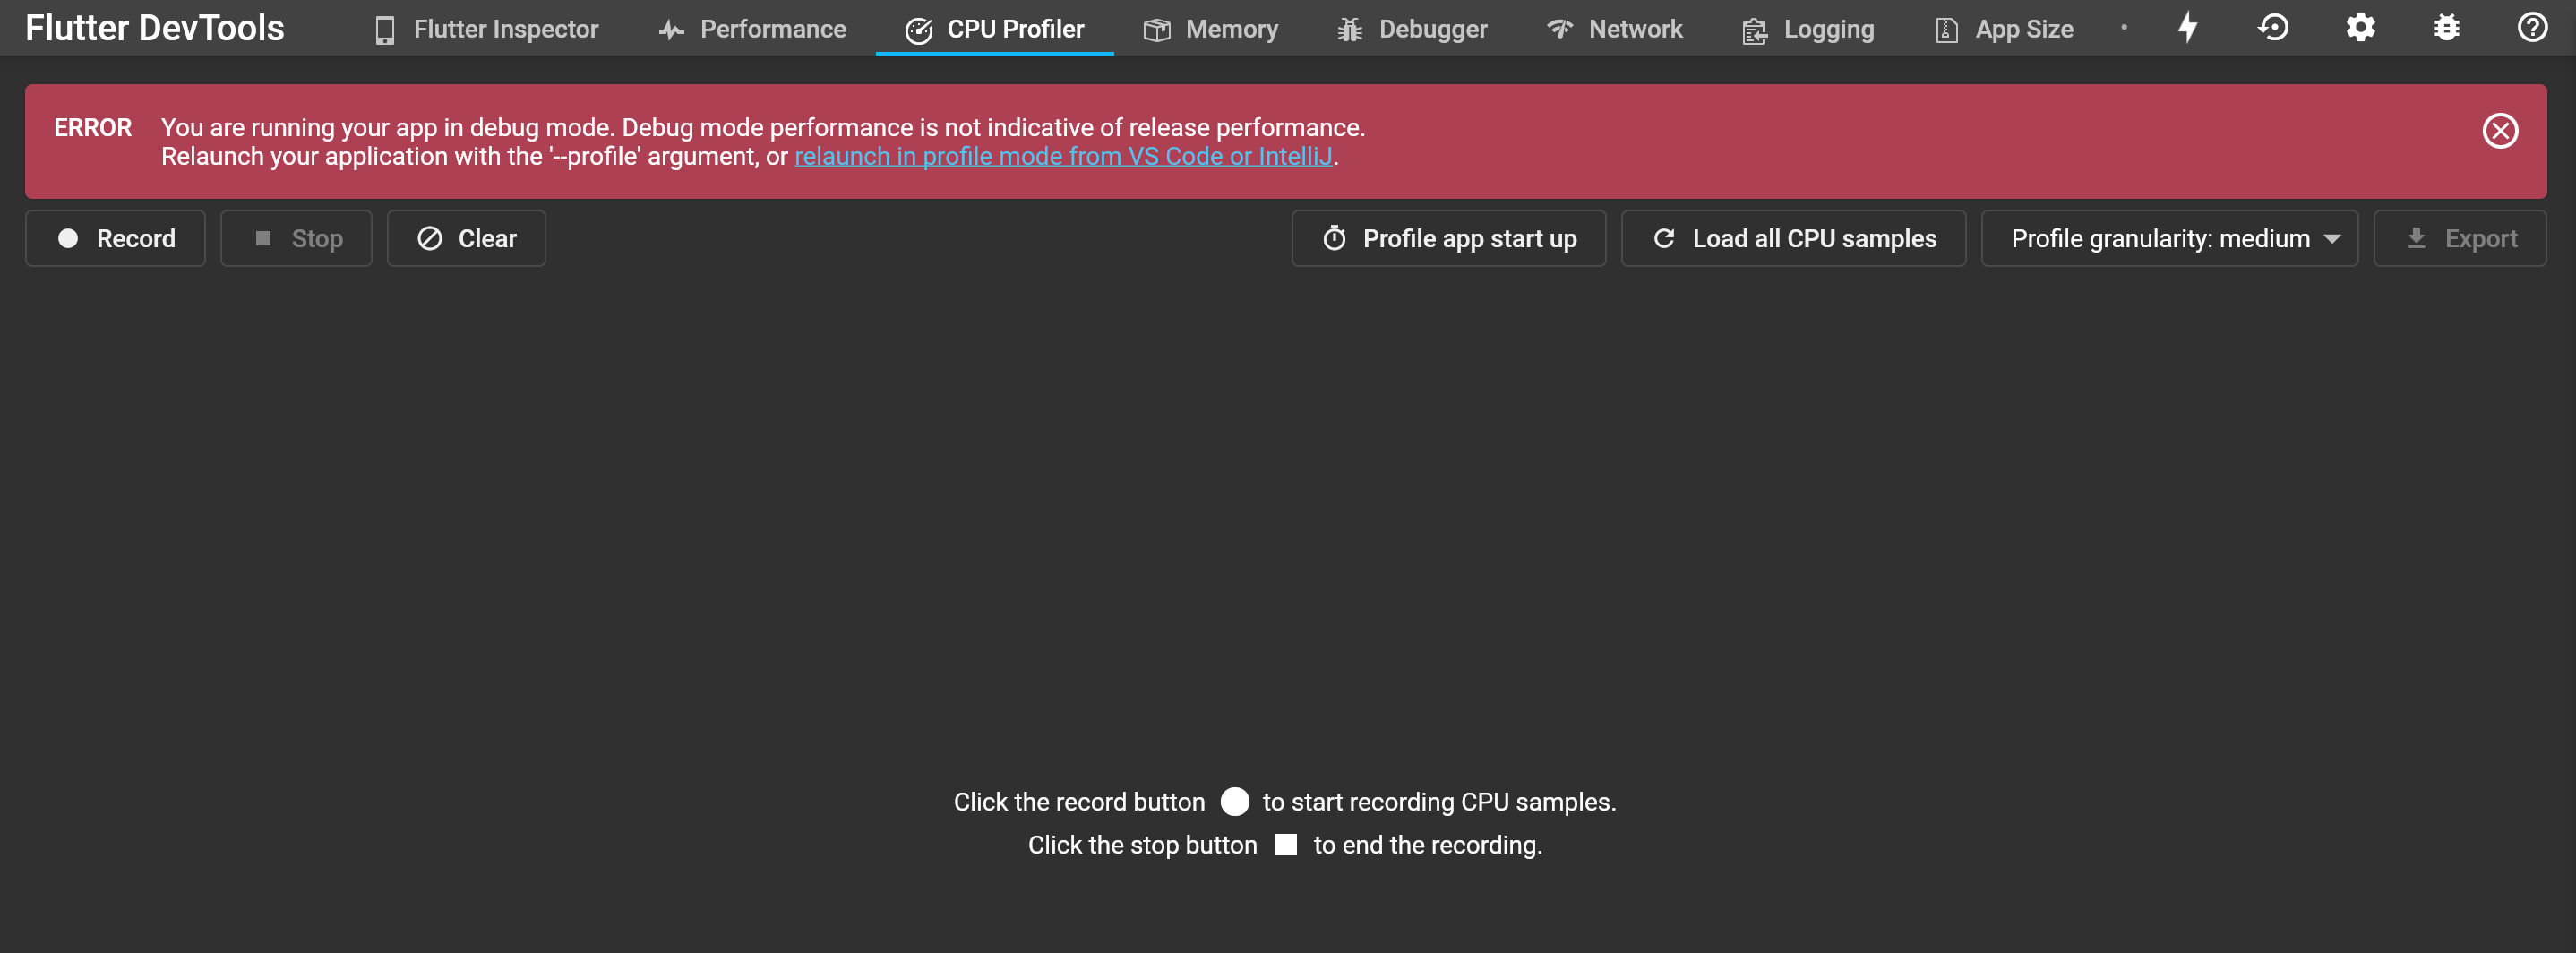
ちなみに[Performance]や[CPU Profiler]ではエラーが表示され使えないようになっています。Profileモードなら使えるようです。
ここで、Flutterのビルドモードには次の3種類があるようです。ここまで使用してきたのは、ホットリロードが可能なDebugモードです。
- Use debug mode during development, when you want to use hot reload.
- Use profile mode when you want to analyze performance.
- Use release mode when you are ready to release your app.
しかしProfileやReleaseモードでアプリを起動しようとするとエラーとなってしまいます。
$ flutter run -d 89C47CAB-7784-471C-8E5F-A71B4513A053 --profile
Profile mode is not supported by iPhone 13 Pro Max.
$ flutter run -d 89C47CAB-7784-471C-8E5F-A71B4513A053 --release
Release mode is not supported by iPhone 13 Pro Max.
調べてみたところiOS SimulatorではDebugモードしか使えないようです。
おわりに
flutter devicesおよびflutter runコマンドを使ってみました。
前回のエントリでは同様のアプリのデバッグ起動をVS Codeのメニューから行いましたが、コマンドから実施できる今回の方法の方が使う機会は多そうです。
参考
以上