![[アップデート] Mountpoint for Amazon S3 が OTLP 対応でパフォーマンス監視ができるようになりました](https://images.ctfassets.net/ct0aopd36mqt/wp-thumbnail-066beb776f0c57ce64255fadcc072f60/82b2f6687ab5774cd73f9176dcac7855/amazon-s3?w=3840&fm=webp)
[アップデート] Mountpoint for Amazon S3 が OTLP 対応でパフォーマンス監視ができるようになりました
はじめに
Mountpoint for Amazon S3 で OpenTelemetry Protocol (OTLP) を使用してメトリクスをエクスポートできるようになりました。FUSE リクエスト、S3 API 呼び出し、Mountpoint のプロセスで使用しているメモリ消費など新しくメトリクスを CloudWatch や、Prometheus で確認できます。
メトリクス収集と、ダッシュボード作成を試してみた結果をご紹介します。
検証環境のセットアップ
OTLP で取得するメトリクスするは CloudWatch Agent を利用して CloudWatch から確認する検証をとります。Prometheus を利用する場合は、こちらのドキュメントを参考にしてください。
SSM から CloudWatch Agent のインストールと設定
SSM の RunCommand を利用して CloudWatch Agent のインストール手順は以下の記事を参考にしてください。
今回の検証では、Mountpoint のメトリクスを収集するために OTLP エンドポイントを有効にした設定を使用しました。
{
	"agent": {
		"metrics_collection_interval": 60
	},
	"metrics": {
		"namespace": "CWAgent",
		"append_dimensions": {
			"InstanceId": "${aws:InstanceId}"
		},
		"metrics_collected": {
			"mem": {
				"measurement": [
					"mem_used_percent"
				],
				"metrics_collection_interval": 60
			},
			"otlp": {
                "http_endpoint": "127.0.0.1:4318"
			}
		}
	}
}
インストール後のバージョン情報です。
$ cat /opt/aws/amazon-cloudwatch-agent/bin/CWAGENT_VERSION
1.300061.0b1289
Mountpoint for Amazon S3 のインストール
Mountpoint for Amazon S3 をインストールし、S3 バケットをマウントする準備をしました。
# Please inpute your info
BUCKET_NAME="devio-bucket-for-mountpoint"
TARGET_DIRECTORY="/mnt/s3"

# Setup
sudo apt update
sudo apt install libfuse2 -y

wget -P /tmp https://s3.amazonaws.com/mountpoint-s3-release/latest/x86_64/mount-s3.deb
sudo apt-get install /tmp/mount-s3.deb -y

# Allow other users to access mount
if ! grep -q "^user_allow_other" /etc/fuse.conf
then
    echo "user_allow_other" | sudo tee -a /etc/fuse.conf
fi

# Create mount TARGET_DIRECTORY
sudo mkdir -p ${TARGET_DIRECTORY}
sudo chmod 777 ${TARGET_DIRECTORY}
インストールしたバージョンを確認します。
$ mount-s3 --version
mount-s3 1.21.0
S3 バケットのマウント
今回のアップデートを利用するために--otlp-endpoint オプションを指定して S3 バケットをマウントします。このオプションにより、Mountpoint のメトリクスが OTLP 形式で CloudWatch Agent に送信されます。
mount-s3 --allow-delete --allow-other --otlp-endpoint http://localhost:4318 ${BUCKET_NAME} ${TARGET_DIRECTORY}
マウントが成功したことを確認します。
$ df -hT
Filesystem      Type      Size  Used Avail Use% Mounted on
/dev/root       ext4      6.8G  2.7G  4.1G  40% /
tmpfs           tmpfs     458M     0  458M   0% /dev/shm
tmpfs           tmpfs     183M  888K  182M   1% /run
tmpfs           tmpfs     5.0M     0  5.0M   0% /run/lock
efivarfs        efivarfs  128K  3.8K  120K   4% /sys/firmware/efi/efivars
/dev/nvme0n1p16 ext4      881M   89M  730M  11% /boot
/dev/nvme0n1p15 vfat      105M  6.2M   99M   6% /boot/efi
tmpfs           tmpfs      92M   12K   92M   1% /run/user/1000
mountpoint-s3   fuse      8.0E     0  8.0E   0% /mnt/s3
読み込みテストとメトリクスの確認
読み込みテストの実行
事前にテストファイルを保存した S3 バケットをマウントしたこともあり、fio を使用して読み取り負荷をかけました。
fio --name=s3-read-test \
    --directory=/mnt/s3/small-files-s5cmd-test1/ \
    --rw=read \
    --bs=128k \
    --numjobs=4 \
    --iodepth=16 \
    --filesize=512k \
    --nrfiles=10000 \
    --time_based \
    --runtime=60s \
    --group_reporting
メトリクスの確認
負荷テスト実行中、CloudWatch にメトリクスが送信されていることを確認できました。
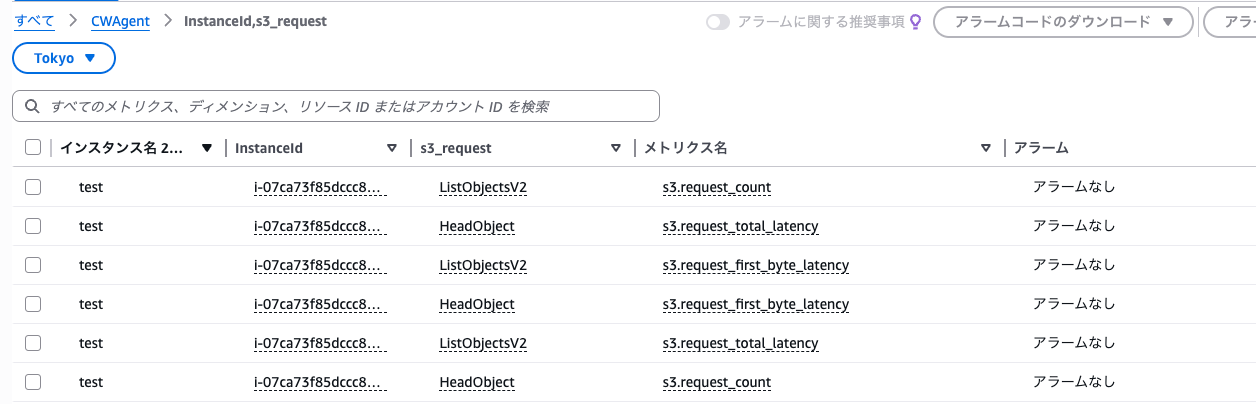
以下は実際に収集されたメトリクスの例です。FUSE リクエストのレイテンシ、S3 API のコール数、エラー数などが可視化されています。今回はメトリクスの取得頻度は 1 分の設定にしてあります。
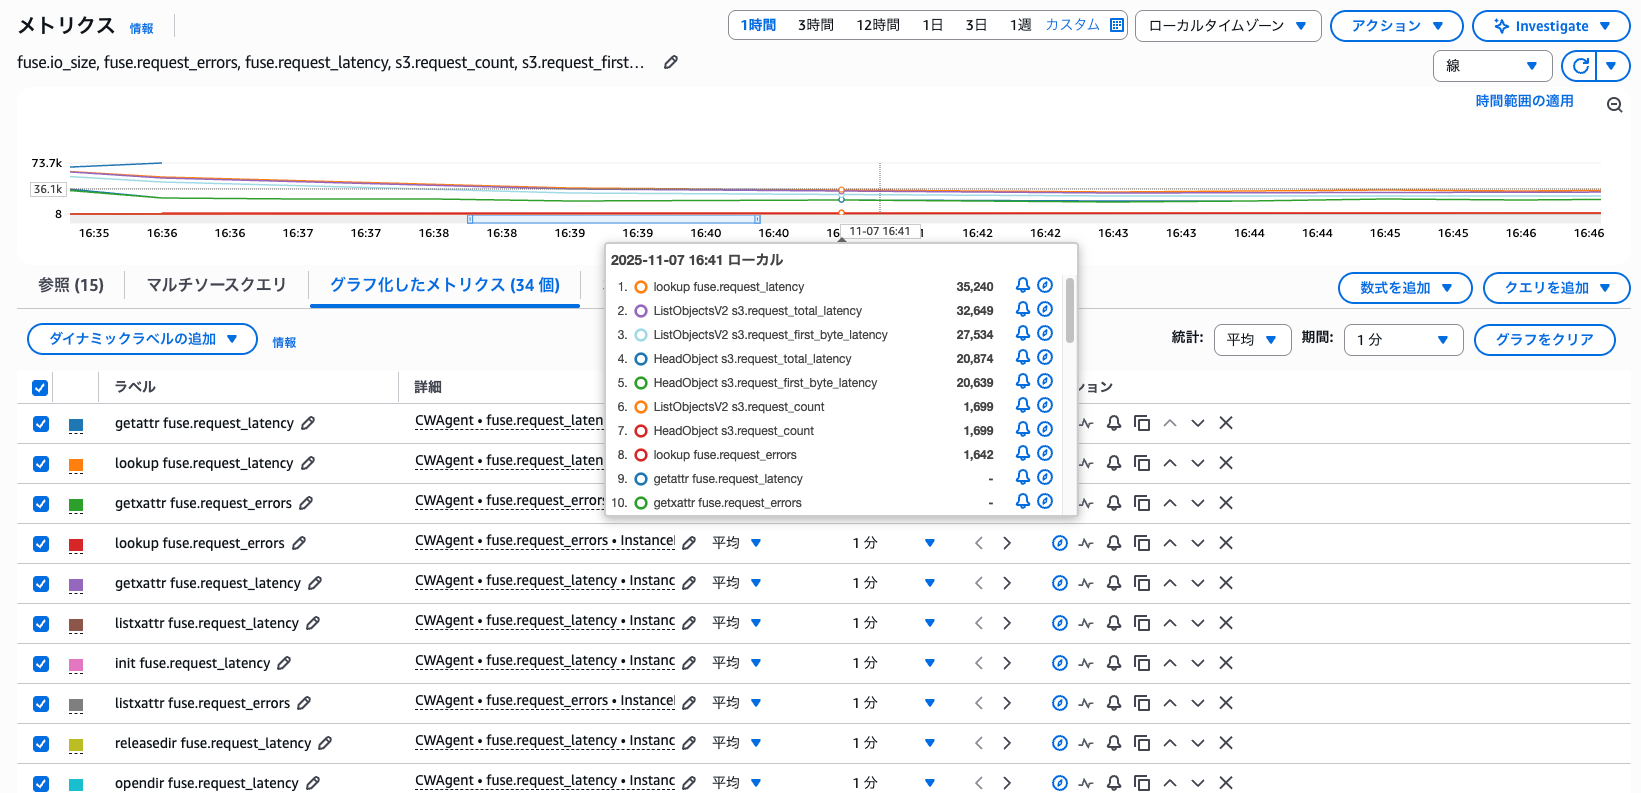
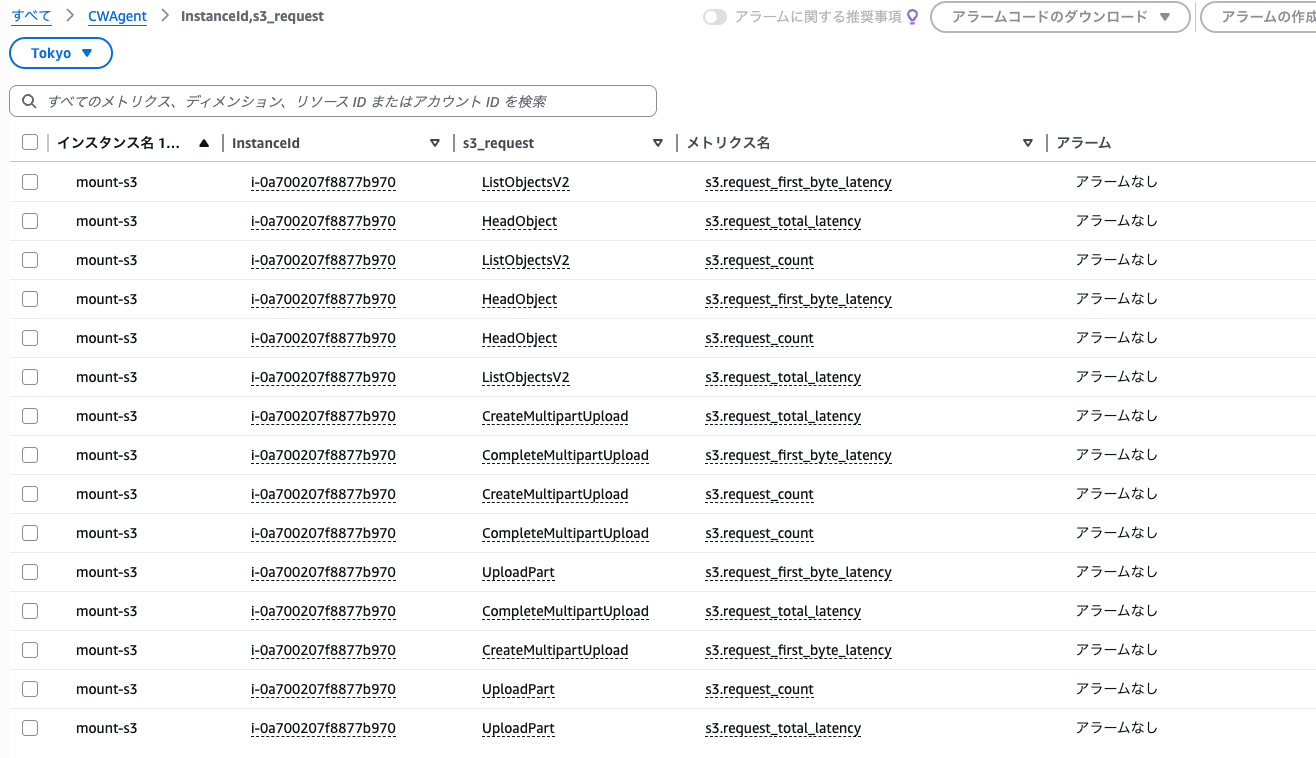
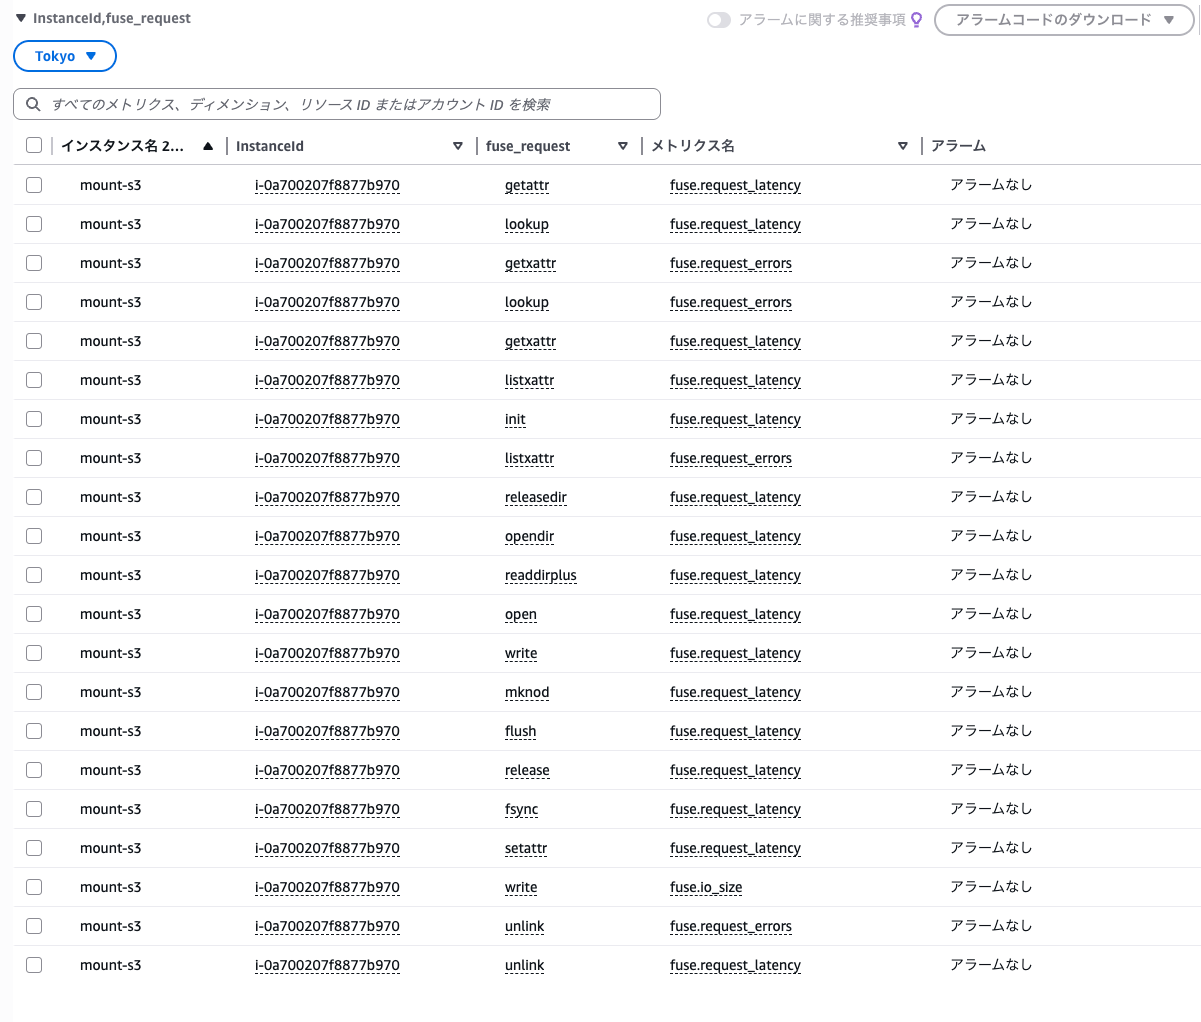
取得できたメトリクスの一部
メトリクス数が結構ありますね、41 個記録されていました。CloudWatch はカスタムメトリクス数で課金されるため $12.29/月かかる計算です。※ 東京リージョン 2025/11/7 時点
HTTP のステータスコードごとに別メトリクスに分かれていたため、一部項目は記録された値に応じて数が増減することになります。そのため 41 個固定のカスタムメトリクスではないとご認識ください。
CloudWatch ダッシュボードの作成
ダッシュボードの設定
公式リポジトリで提供されているサンプルダッシュボードをベースに、今回取得したメトリクスに合わせてカスタマイズした設定を作成しました。
以下のコマンドでダッシュボードを作成できます。
aws cloudwatch put-dashboard --region ap-northeast-1 --dashboard-name test-dashboard --dashboard-body file://./cloudwatch.json
コンフィグファイルが長いため折りたたみ
{
"variables": [],
"widgets": [
{
"type": "text",
"x": 0,
"y": 0,
"width": 24,
"height": 2,
"properties": {
"markdown": "# FUSE request metrics",
"background": "transparent"
}
},
{
"type": "metric",
"x": 0,
"y": 2,
"width": 8,
"height": 6,
"properties": {
"metrics": [
[
{
"expression": "SEARCH('{CWAgent,InstanceId,fuse_request} MetricName=\"fuse.request_latency\"', 'SampleCount', 60)/60",
"id": "e3",
"period": 60
}
]
],
"view": "timeSeries",
"stacked": false,
"region": "ap-northeast-1",
"stat": "SampleCount",
"period": 60,
"title": "FUSE request rate",
"yAxis": {
"left": {
"label": "Requests/second"
}
}
}
},
{
"type": "metric",
"x": 8,
"y": 2,
"width": 8,
"height": 6,
"properties": {
"metrics": [
[
{
"expression": "SEARCH('{CWAgent,InstanceId,fuse_request} MetricName=\"fuse.io_size\"', 'Sum', 60)/60",
"id": "e1",
"period": 60
}
]
],
"view": "timeSeries",
"stacked": false,
"region": "ap-northeast-1",
"period": 60,
"title": "FUSE bytes transfer rate",
"yAxis": {
"left": {
"label": "Bytes/second"
}
}
}
},
{
"type": "metric",
"x": 16,
"y": 2,
"width": 8,
"height": 6,
"properties": {
"metrics": [
[
{
"expression": "SEARCH('{CWAgent,InstanceId,fuse_request} MetricName=\"fuse.request_errors\"', 'Sum', 60)/60",
"id": "e1",
"period": 60
}
]
],
"view": "timeSeries",
"stacked": false,
"region": "ap-northeast-1",
"title": "FUSE request error rate",
"period": 60,
"yAxis": {
"left": {
"label": "Errors/second"
}
}
}
},
{
"type": "metric",
"x": 0,
"y": 8,
"width": 8,
"height": 6,
"properties": {
"metrics": [
[
"CWAgent",
"fuse.request_latency",
"InstanceId",
"i-0a700207f8877b970",
"fuse_request",
"read",
{
"stat": "p0"
}
],
[
"...",
{
"stat": "p50"
}
],
[
"...",
{
"stat": "p99"
}
],
[
"...",
{
"stat": "p99.9"
}
],
[
"...",
{
"stat": "p100"
}
]
],
"view": "timeSeries",
"stacked": false,
"region": "ap-northeast-1",
"title": "FUSE READ request latency",
"period": 60,
"stat": "p99.9"
}
},
{
"type": "metric",
"x": 8,
"y": 8,
"width": 8,
"height": 6,
"properties": {
"metrics": [
[
"CWAgent",
"fuse.request_latency",
"InstanceId",
"i-0a700207f8877b970",
"fuse_request",
"write",
{
"stat": "p0"
}
],
[
"...",
{
"stat": "p50"
}
],
[
"...",
{
"stat": "p99"
}
],
[
"...",
{
"stat": "p99.9"
}
],
[
"...",
{
"stat": "p100"
}
]
],
"view": "timeSeries",
"stacked": false,
"region": "ap-northeast-1",
"title": "FUSE WRITE request latency",
"period": 60,
"stat": "p99.9"
}
},
{
"type": "metric",
"x": 16,
"y": 8,
"width": 8,
"height": 6,
"properties": {
"metrics": [
[
{
"expression": "SEARCH('{CWAgent,InstanceId,fuse_request} NOT fuse_request=\"read\" NOT fuse_request=\"write\" MetricName=\"fuse.request_latency\"', 'p99', 60)",
"id": "e1",
"period": 60
}
]
],
"view": "timeSeries",
"stacked": false,
"region": "ap-northeast-1",
"title": "FUSE other requests latency (P99)",
"period": 60,
"stat": "p99",
"yAxis": {
"left": {
"label": "Microseconds"
}
}
}
},
{
"type": "metric",
"x": 0,
"y": 14,
"width": 8,
"height": 6,
"properties": {
"metrics": [
[
"CWAgent",
"fuse.io_size",
"InstanceId",
"i-0a700207f8877b970",
"fuse_request",
"read",
{
"stat": "p0"
}
],
[
"...",
{
"stat": "p50"
}
],
[
"...",
{
"stat": "p99"
}
],
[
"...",
{
"stat": "p99.9"
}
],
[
"...",
{
"stat": "p100"
}
]
],
"view": "timeSeries",
"stacked": false,
"region": "ap-northeast-1",
"title": "FUSE READ request size",
"period": 60,
"stat": "p100"
}
},
{
"type": "metric",
"x": 8,
"y": 14,
"width": 8,
"height": 6,
"properties": {
"metrics": [
[
"CWAgent",
"fuse.io_size",
"InstanceId",
"i-0a700207f8877b970",
"fuse_request",
"write",
{
"stat": "p0"
}
],
[
"...",
{
"stat": "p50"
}
],
[
"...",
{
"stat": "p99"
}
],
[
"...",
{
"stat": "p99.9"
}
],
[
"...",
{
"stat": "Average"
}
]
],
"view": "timeSeries",
"stacked": false,
"region": "ap-northeast-1",
"title": "FUSE WRITE request size",
"period": 60
}
},
{
"type": "metric",
"x": 16,
"y": 14,
"width": 8,
"height": 6,
"properties": {
"metrics": [
[
{
"expression": "100*(1 - m1/LAST(m2))",
"label": "Thread utilization %",
"id": "e1"
}
],
[
"CWAgent",
"experimental.fuse.idle_threads",
"InstanceId",
"i-0a700207f8877b970",
{
"id": "m1",
"stat": "Minimum",
"visible": false
}
],
[
".",
"experimental.fuse.total_threads",
".",
".",
{
"id": "m2",
"stat": "Maximum",
"label": "Total threads (LAST: ${LAST})"
}
]
],
"view": "timeSeries",
"stacked": false,
"region": "ap-northeast-1",
"title": "FUSE thread utilization",
"period": 60,
"stat": "Maximum",
"yAxis": {
"left": {
"label": "%"
}
}
}
},
{
"type": "text",
"x": 0,
"y": 20,
"width": 24,
"height": 2,
"properties": {
"markdown": "# S3 request metrics",
"background": "transparent"
}
},
{
"type": "metric",
"x": 0,
"y": 22,
"width": 8,
"height": 6,
"properties": {
"metrics": [
[
{
"expression": "SEARCH('{CWAgent,InstanceId,s3_request} MetricName=\"s3.request_count\"', 'Sum', 60)/60",
"id": "e1",
"period": 60
}
]
],
"view": "timeSeries",
"stacked": false,
"region": "ap-northeast-1",
"title": "S3 request rate",
"yAxis": {
"left": {
"label": "Requests/second"
}
},
"period": 60
}
},
{
"type": "metric",
"x": 8,
"y": 22,
"width": 8,
"height": 6,
"properties": {
"metrics": [
[
{
"expression": "SEARCH('{CWAgent,InstanceId,s3_request,http_status} MetricName=\"s3.request_errors\"', 'Sum', 60)/60",
"id": "e2",
"period": 60
}
]
],
"view": "timeSeries",
"stacked": false,
"region": "ap-northeast-1",
"title": "S3 request error rate",
"yAxis": {
"left": {
"label": "Requests/second"
}
},
"period": 60
}
},
{
"type": "text",
"x": 16,
"y": 22,
"width": 8,
"height": 6,
"properties": {
"markdown": "",
"background": "transparent"
}
},
{
"type": "metric",
"x": 0,
"y": 28,
"width": 8,
"height": 6,
"properties": {
"metrics": [
[
"CWAgent",
"s3.request_total_latency",
"InstanceId",
"i-0a700207f8877b970",
"s3_request",
"GetObject",
{
"stat": "p0"
}
],
[
"...",
{
"stat": "p50"
}
],
[
"...",
{
"stat": "p99"
}
],
[
"...",
{
"stat": "p99.9"
}
],
[
"...",
{
"stat": "p100"
}
]
],
"view": "timeSeries",
"stacked": false,
"region": "ap-northeast-1",
"title": "S3 GetObject request latency",
"period": 60,
"stat": "p99.9"
}
},
{
"type": "metric",
"x": 8,
"y": 28,
"width": 8,
"height": 6,
"properties": {
"metrics": [
[
"CWAgent",
"s3.request_total_latency",
"InstanceId",
"i-0a700207f8877b970",
"s3_request",
"UploadPart",
{
"stat": "p0"
}
],
[
"...",
{
"stat": "p50"
}
],
[
"...",
{
"stat": "p99"
}
],
[
"...",
{
"stat": "p99.9"
}
],
[
"...",
{
"stat": "p100"
}
]
],
"view": "timeSeries",
"stacked": false,
"region": "ap-northeast-1",
"title": "S3 UploadPart request latency",
"period": 60,
"stat": "p99.9"
}
},
{
"type": "metric",
"x": 16,
"y": 28,
"width": 8,
"height": 6,
"properties": {
"metrics": [
[
{
"expression": "SEARCH('{CWAgent,InstanceId,s3_request} NOT s3_request=\"GetObject\" NOT s3_request=\"UploadPart\" MetricName=\"s3.request_total_latency\"', 'p99', 60)",
"id": "e1",
"period": 60
}
]
],
"view": "timeSeries",
"stacked": false,
"region": "ap-northeast-1",
"title": "S3 other requests latency (P99)",
"period": 60,
"stat": "p99",
"yAxis": {
"left": {
"label": "Microseconds"
}
}
}
},
{
"type": "text",
"x": 0,
"y": 34,
"width": 24,
"height": 2,
"properties": {
"markdown": "# Prefetch metrics",
"background": "transparent"
}
},
{
"type": "metric",
"x": 0,
"y": 36,
"width": 8,
"height": 6,
"properties": {
"metrics": [
[
"CWAgent",
"experimental.prefetch.reset_state",
"InstanceId",
"i-0a700207f8877b970"
]
],
"view": "timeSeries",
"stacked": false,
"region": "ap-northeast-1",
"title": "Prefetch reset state",
"period": 60,
"stat": "p100"
}
},
{
"type": "text",
"x": 0,
"y": 42,
"width": 24,
"height": 2,
"properties": {
"markdown": "# Memory usage",
"background": "transparent"
}
},
{
"type": "metric",
"x": 0,
"y": 44,
"width": 8,
"height": 6,
"properties": {
"metrics": [
[
"CWAgent",
"process.memory_usage",
"InstanceId",
"i-0a700207f8877b970"
]
],
"view": "timeSeries",
"stacked": false,
"region": "ap-northeast-1",
"title": "Memory usage",
"period": 60,
"stat": "Maximum"
}
}
]
}
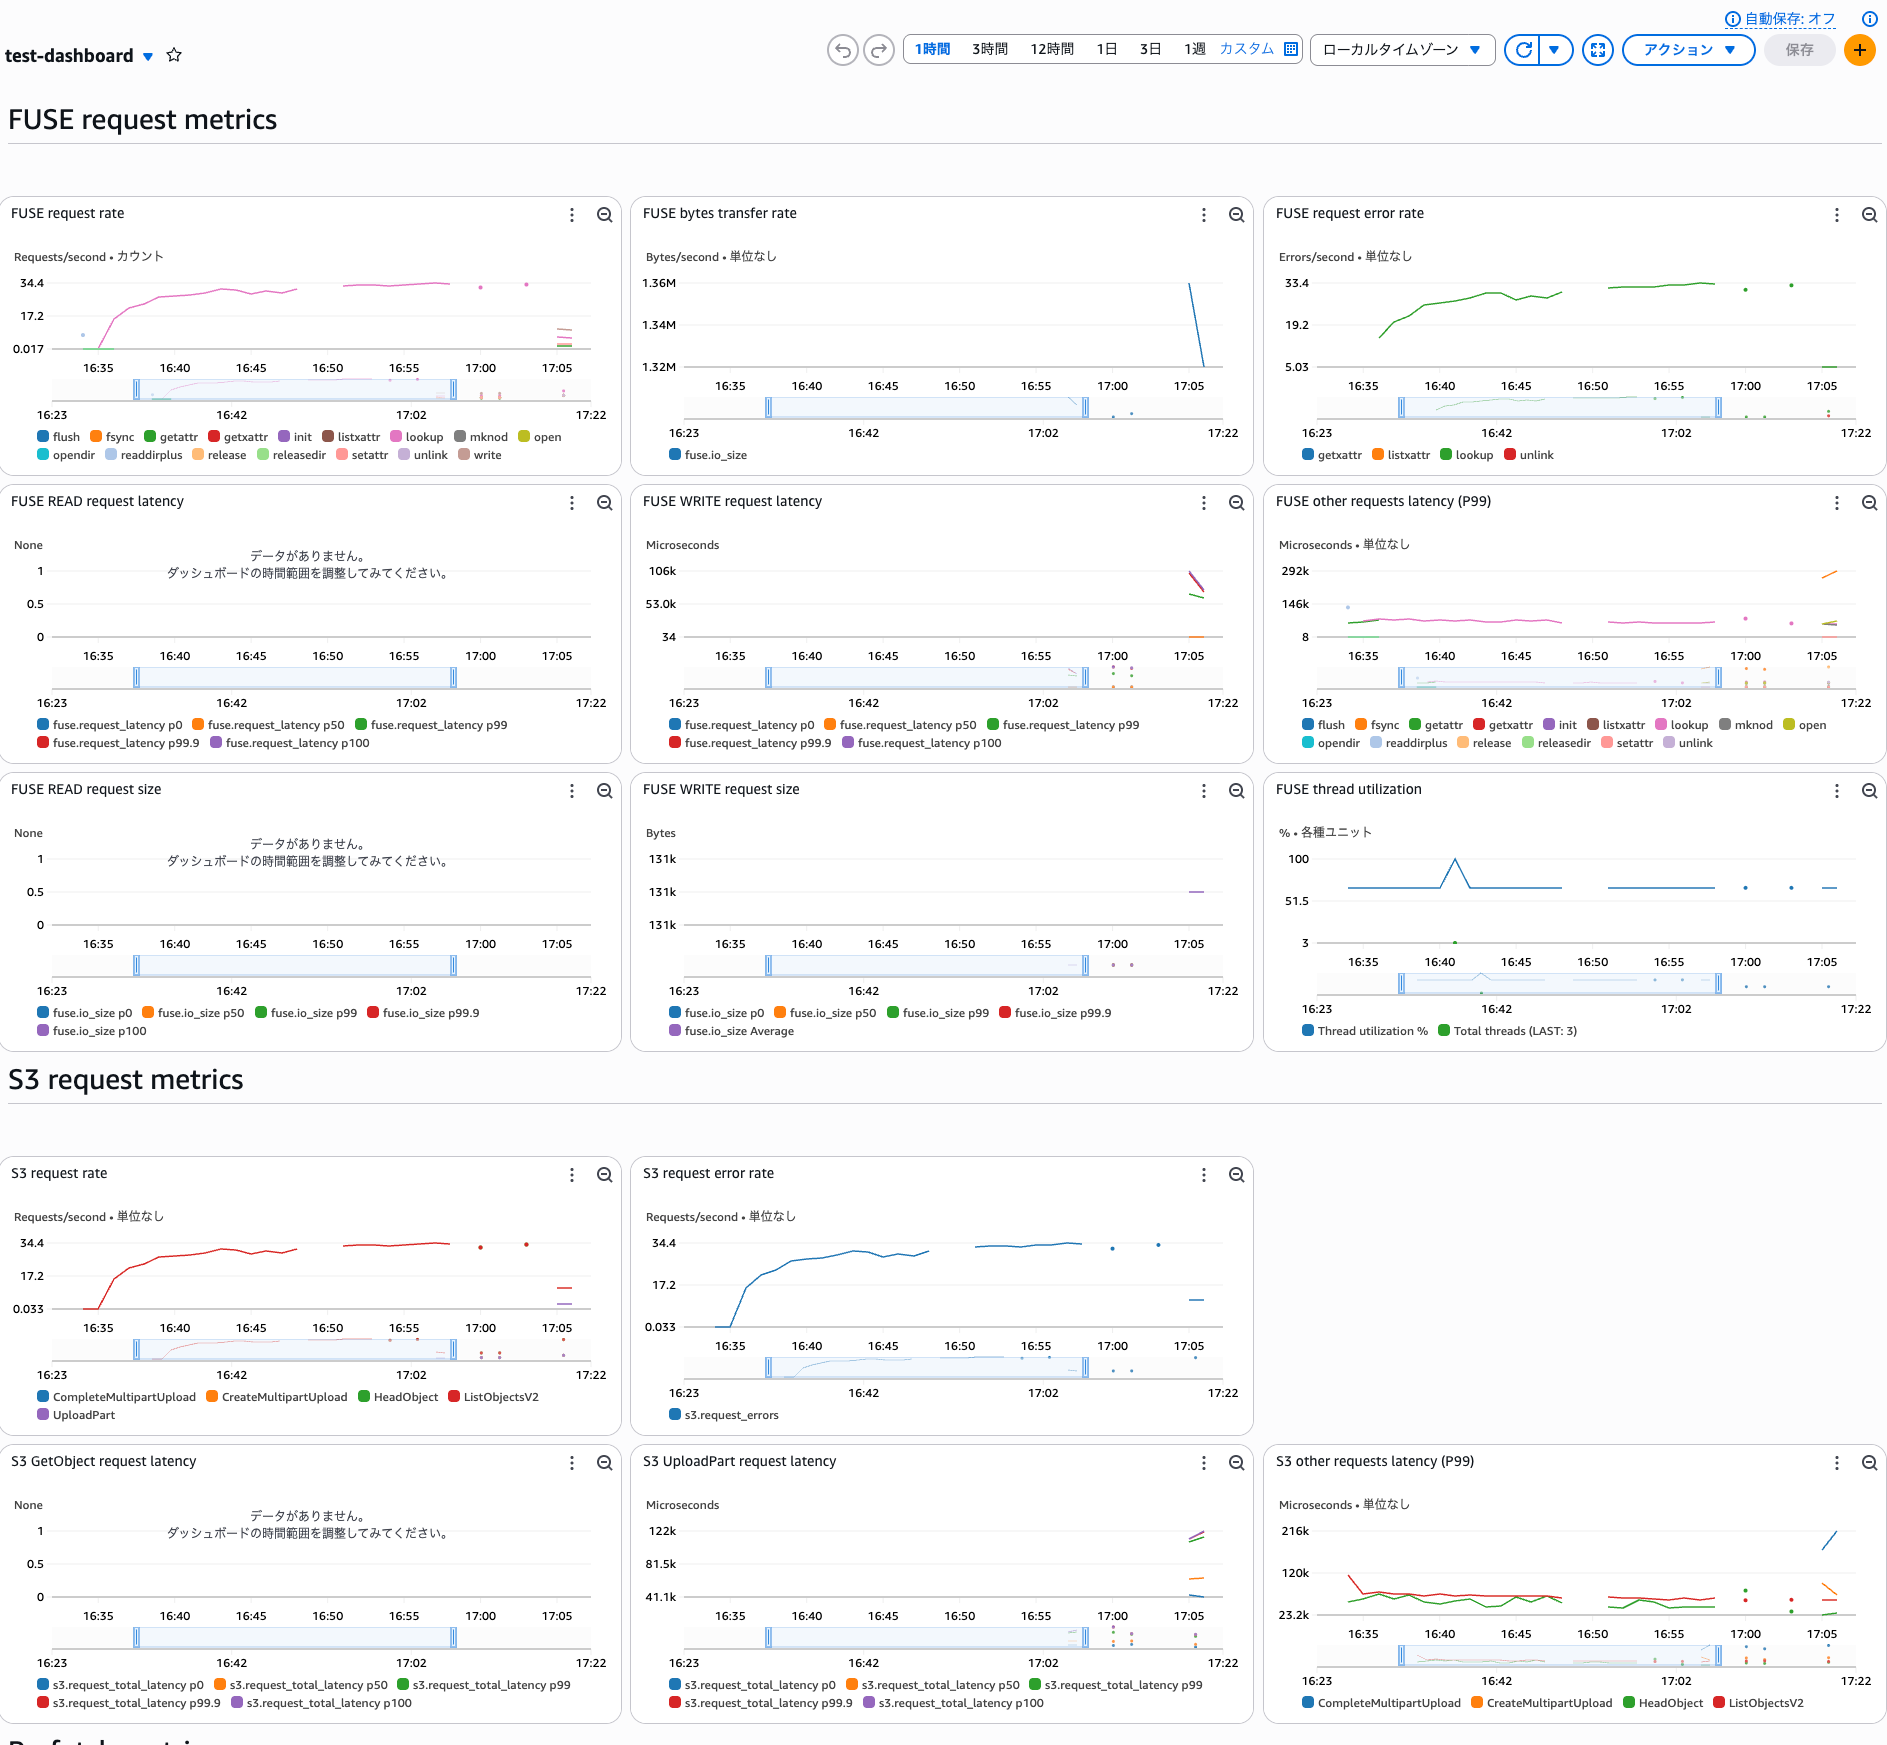
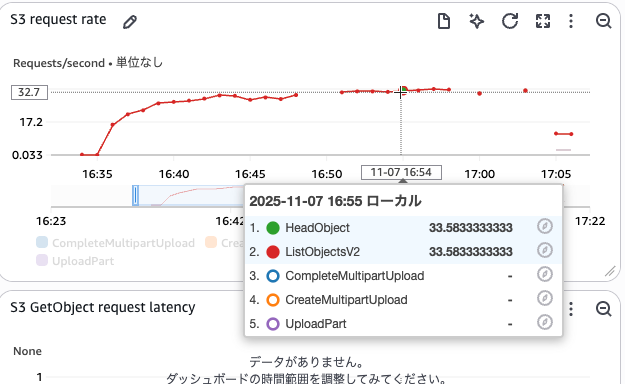
ダッシュボードの表示例
以下のようなダッシュボードになりました。
全体表示
一箇所のアップ
収集できるメトリクスの種類
Mountpoint for Amazon S3 は、OTLP 形式で以下の 3 つのカテゴリのメトリクスを出力します。
FUSE リクエストメトリクス
FUSE レイヤーでのファイルシステム操作に関するメトリクスです。アプリケーションレベルでの I/O パフォーマンスを把握できます。
| メトリクス名 | 型 | 説明 |
|---|---|---|
| fuse.io_size | ヒストグラム | FUSE リクエストごとのバイト数 |
| fuse.request_latency | ヒストグラム | リクエスト処理時間(マイクロ秒) |
| fuse.request_errors | カウンター | リクエストタイプ別のエラー数 |
S3 リクエストメトリクス
バックエンドの S3 API 呼び出しに関するメトリクスです。S3 側のパフォーマンスとネットワークレイテンシを監視できます。
| メトリクス名 | 型 | 説明 |
|---|---|---|
| s3.request_count | カウンター | S3 API 呼び出し数 |
| s3.request_errors | カウンター | HTTP ステータス別のエラー数 |
| s3.request_first_byte_latency | ヒストグラム | 最初のバイトを受信するまでの時間 |
| s3.request_total_latency | ヒストグラム | リクエスト全体の所要時間 |
Mountpoint のシステムメトリクス
Mountpoint プロセスのリソース使用状況に関するメトリクスです。Mountpoint でのメモリ使用量が気になるときが過去にあったのでこれは助かります。
| メトリクス名 | 型 | 説明 |
|---|---|---|
| process.memory_usage | ゲージ | Mountpoint プロセスのメモリ消費量 |
| experimental.fuse.idle_threads | ヒストグラム | 待機しているワーカースレッド数 |
| experimental.fuse.total_threads | ゲージ | 起動済みワーカスレッド合計数 |
| experimental.prefetch.reset_state | カウンター | プリフェッチの破棄回数 |
fstab による永続化設定
システム起動時に自動的に Mountpoint をマウントする場合は、fstab を使用します。
OTLP エンドポイントの設定を含めた永続化スクリプトを用意しました。再起動後も自動的にメトリクス収集が有効な状態でマウントされます。
- OTLP 設定:
otlp-endpoint=http://localhost:4318でメトリクス収集を有効化
#!/bin/bash

BUCKET_NAME="devio-bucket-for-mountpoint"
TARGET_DIRECTORY="/mnt/s3"
OPTIONS="allow-delete,allow-other,otlp-endpoint=http://localhost:4318"

# Setup
sudo apt update
sudo apt install libfuse2 -y

wget -P /tmp https://s3.amazonaws.com/mountpoint-s3-release/latest/x86_64/mount-s3.deb
sudo apt-get install /tmp/mount-s3.deb -y

# Allow other users to access mount
if ! grep -q "^user_allow_other" /etc/fuse.conf
then
    echo "user_allow_other" | sudo tee -a /etc/fuse.conf
fi

# Create mount TARGET_DIRECTORY
sudo mkdir -p ${TARGET_DIRECTORY}
sudo chmod 777 ${TARGET_DIRECTORY}

# Ensure BUCKET_NAME has correct s3:// format
if [[ ! ${BUCKET_NAME} =~ ^s3:// ]]; then
    FORMATTED_BUCKET="s3://${BUCKET_NAME}/"
else
    if [[ ! ${BUCKET_NAME} =~ /$ ]]; then
        FORMATTED_BUCKET="${BUCKET_NAME}/"
    else
        FORMATTED_BUCKET="${BUCKET_NAME}"
    fi
fi

# Add entry to /etc/fstab for persistent mounting
# Required options: _netdev, nosuid, nodev (Mountpoint will fail without these)
FSTAB_ENTRY="${FORMATTED_BUCKET} ${TARGET_DIRECTORY} mount-s3 _netdev,nosuid,nodev,nofail,${OPTIONS} 0 0"

# Check if entry already exists in fstab
sudo sed -i "\|${BUCKET_NAME}.*${TARGET_DIRECTORY}|d" /etc/fstab

# Add new entry
echo "${FSTAB_ENTRY}" | sudo tee -a /etc/fstab

# Mount the filesystem
sudo mount ${TARGET_DIRECTORY}

# Verify mount was successful
if mountpoint -q ${TARGET_DIRECTORY}; then
    echo "Successfully mounted ${FORMATTED_BUCKET} to ${TARGET_DIRECTORY}"
    ls -la ${TARGET_DIRECTORY}
else
    echo "Warning: Mount may have failed"
fi

sudo systemctl daemon-reload
動作確認
別のインスタンスで fstab 設定を適用し、メトリクスが正常に収集されることを確認しました。
まとめ
Mountpoint for Amazon S3 で OTLP を使用したメトリクスエクスポートが可能になりました。
CloudWatch Agent や Prometheus に対応しており、パフォーマンスメトリクスを可視化できます。FUSE リクエスト、S3 API 呼び出し、Mountpoint のシステムリソースなどが取得可能です。
本記事では、以下の内容を検証しました。
セットアップと設定について
- SSM RunCommand を使った CloudWatch Agent のインストール
--otlp-endpointオプションを指定するだけでメトリクス収集開始
取得できたメトリクスについて
- FUSE、S3 API、システムの 3 カテゴリで構成
- 今回の検証では 41 個のカスタムメトリクスを記録
- HTTP ステータスコードごとに分かれるため、メトリクス数は動的に変動
- カスタムメトリクス課金の目安:$12.29/月(東京リージョン、2025/11/7 時点)
実用的な使い方について
- 公式サンプルダッシュボードをカスタマイズして可視化
- fstab による永続化設定でシステム起動時から自動収集
おわりに
Mountpoint のパフォーマンス分析やトラブルシューティングが楽になりました。私は AWS ParallelCluster でよく Mountpoint for Amazon S3 をマウントしていたため、パフォーマンス分析で使える場面がありそうなアップデートでした。本記事で紹介した設定やスクリプトを参考になれば幸いです。