
Tagging Macros and Generating Reports in Zendesk Explore!
この記事は公開されてから1年以上経過しています。情報が古い可能性がありますので、ご注意ください。
Introduction
Tags play an important role in organizing and categorizing macros, which makes analyzing and filtering data in Zendesk Explore easier.
This blog encapsulates the process of adding tags to macros and generating reports to analyze those tags.
Getting Started!
For this specific blog we'll be using the example of a macro when the ticket is on hold for about 2 days.
Step 1: Adding Tags to Macros.
- Navigate to the Admin Center:
- Login to your account and head to the Admin Center and click on the
Workspacesicon in the sidebar.
- Login to your account and head to the Admin Center and click on the
- Under the
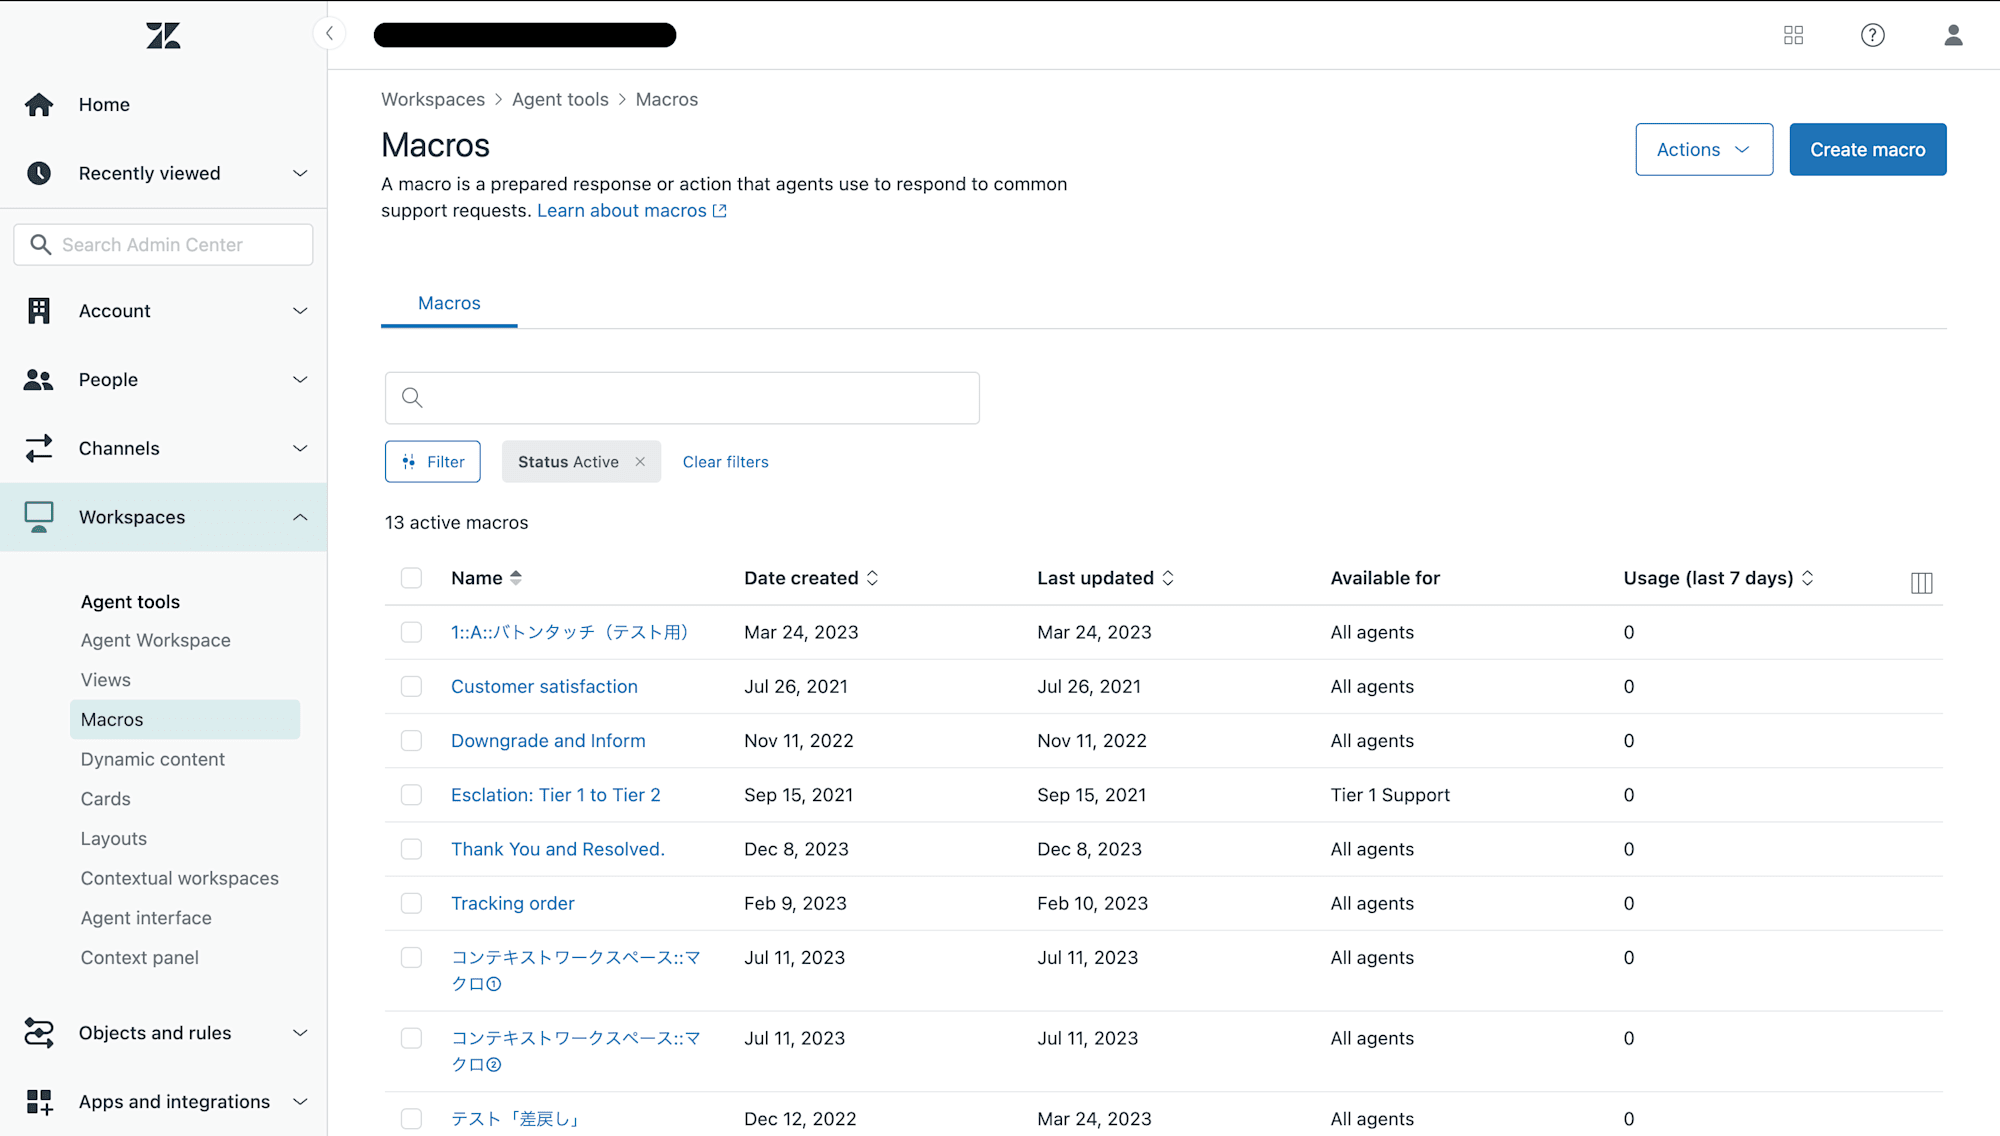
Agent toolssection, selectMacros.
-
Create or Edit a Macro:
- To create a new macro, click
Create macro. - To edit an existing macro, select it from the list.
- To create a new macro, click
-
Add Tags to the Macro:
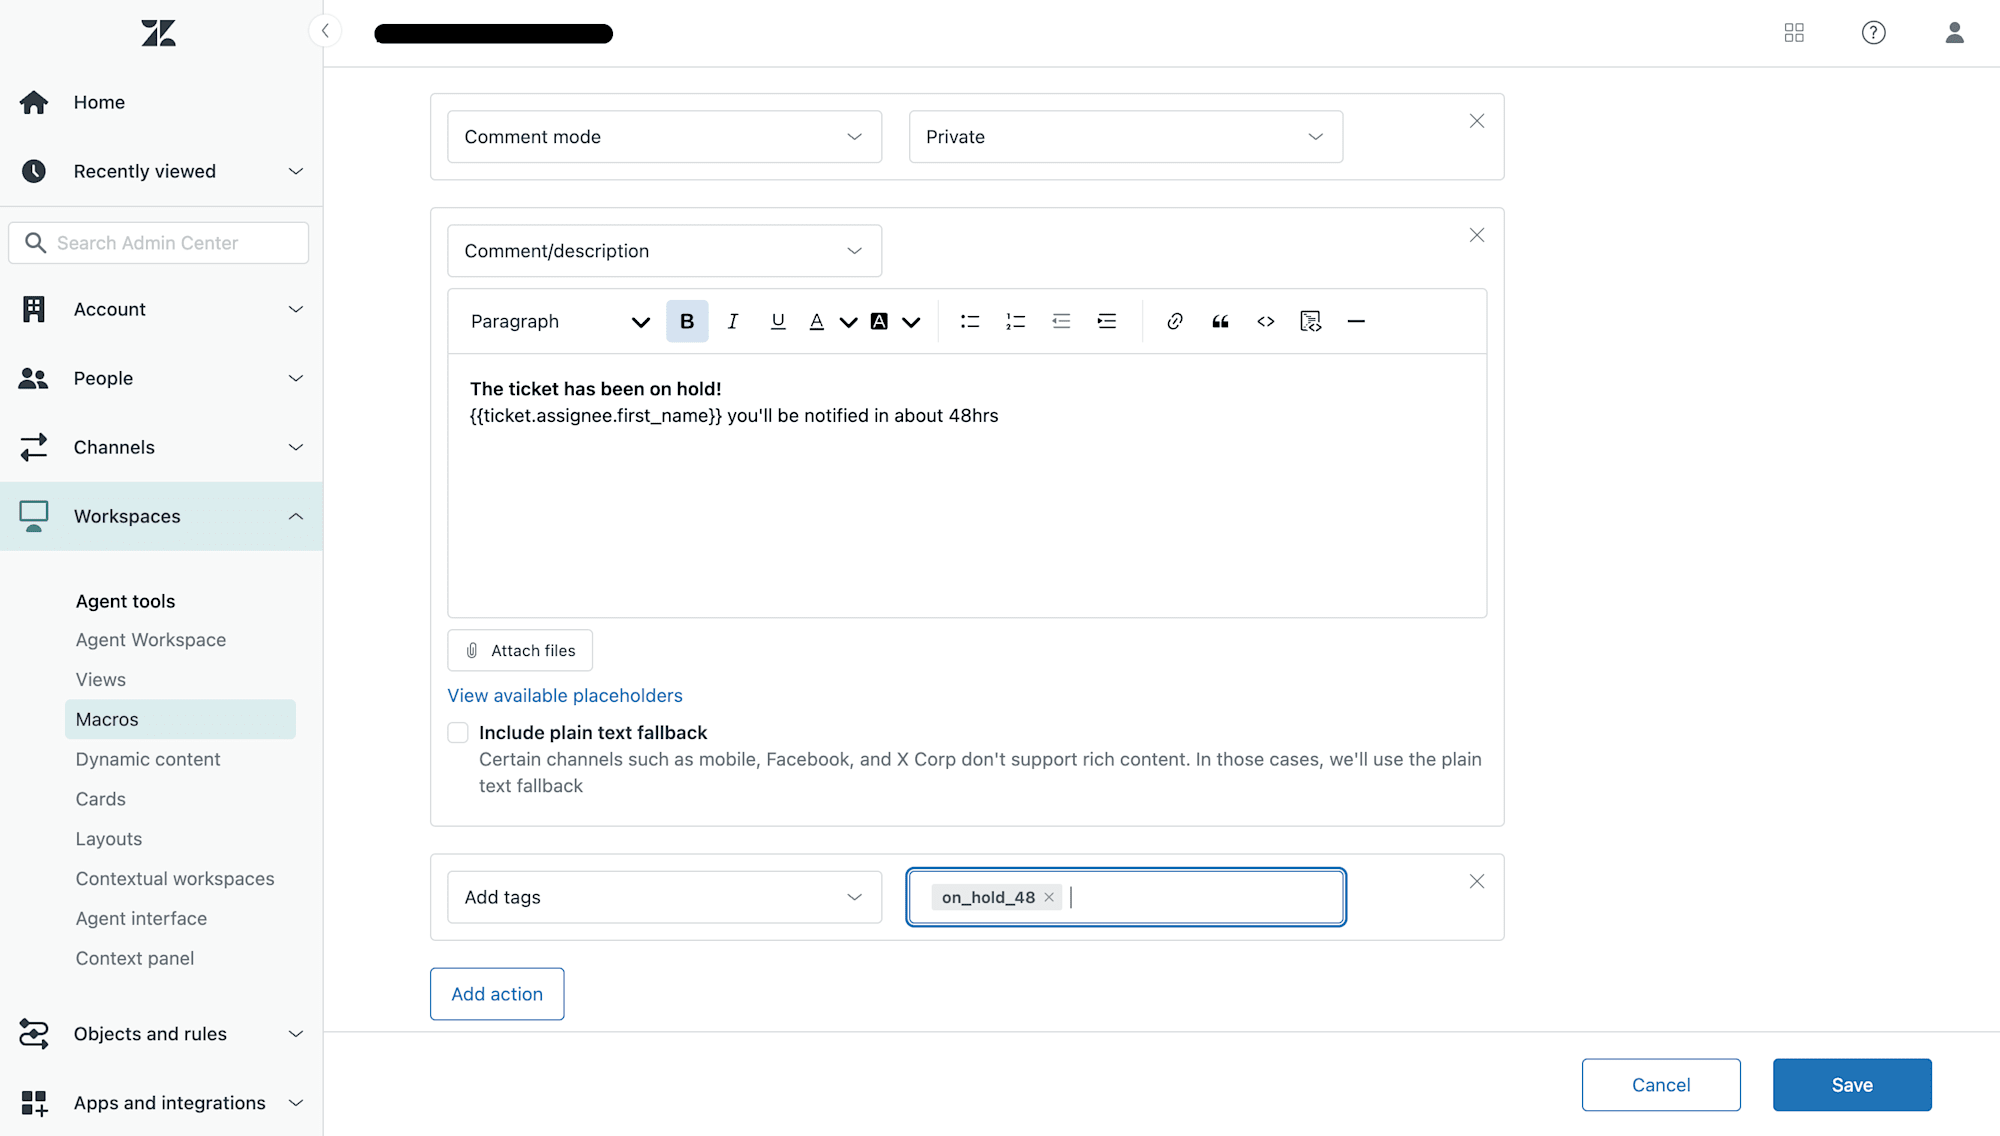
- On the macro editing page, click
Add action. - From the drop-down list, select
Add tags. - Enter the desired tag(s) in the text box. If you’re adding multiple tags, separate them with spaces.
- On the macro editing page, click
-
Save Your Changes:
- Once you’ve added the tags, click
Createfor new macros orSavefor existing ones.
- Once you’ve added the tags, click
Step 2: Applying the Macro.
Once you've created the macros apply them to the tickets in order to check how they actually work.
-
Open Support:
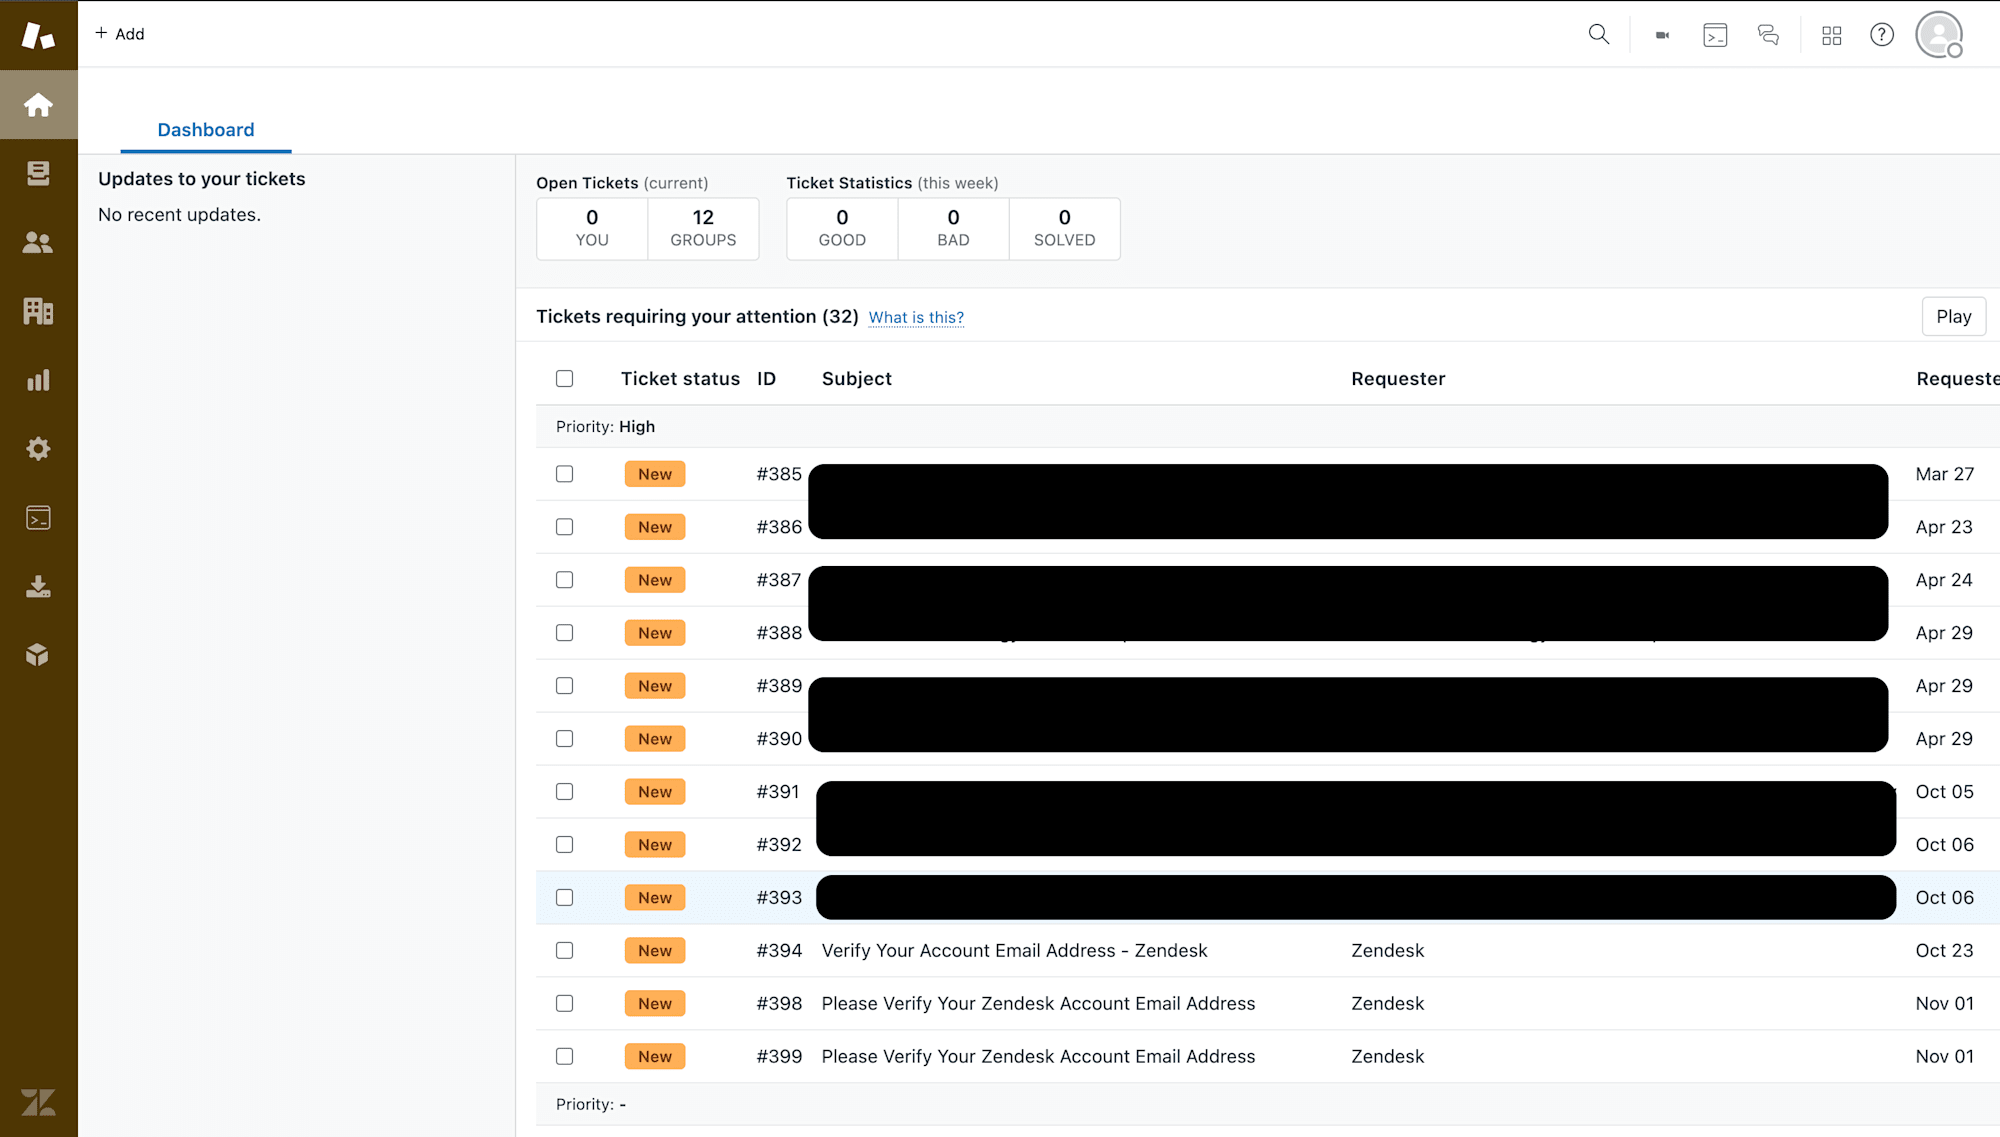
- Navigate to Support and click on the
Add Ticketicon.
- Navigate to Support and click on the
-
Apply the Macro:
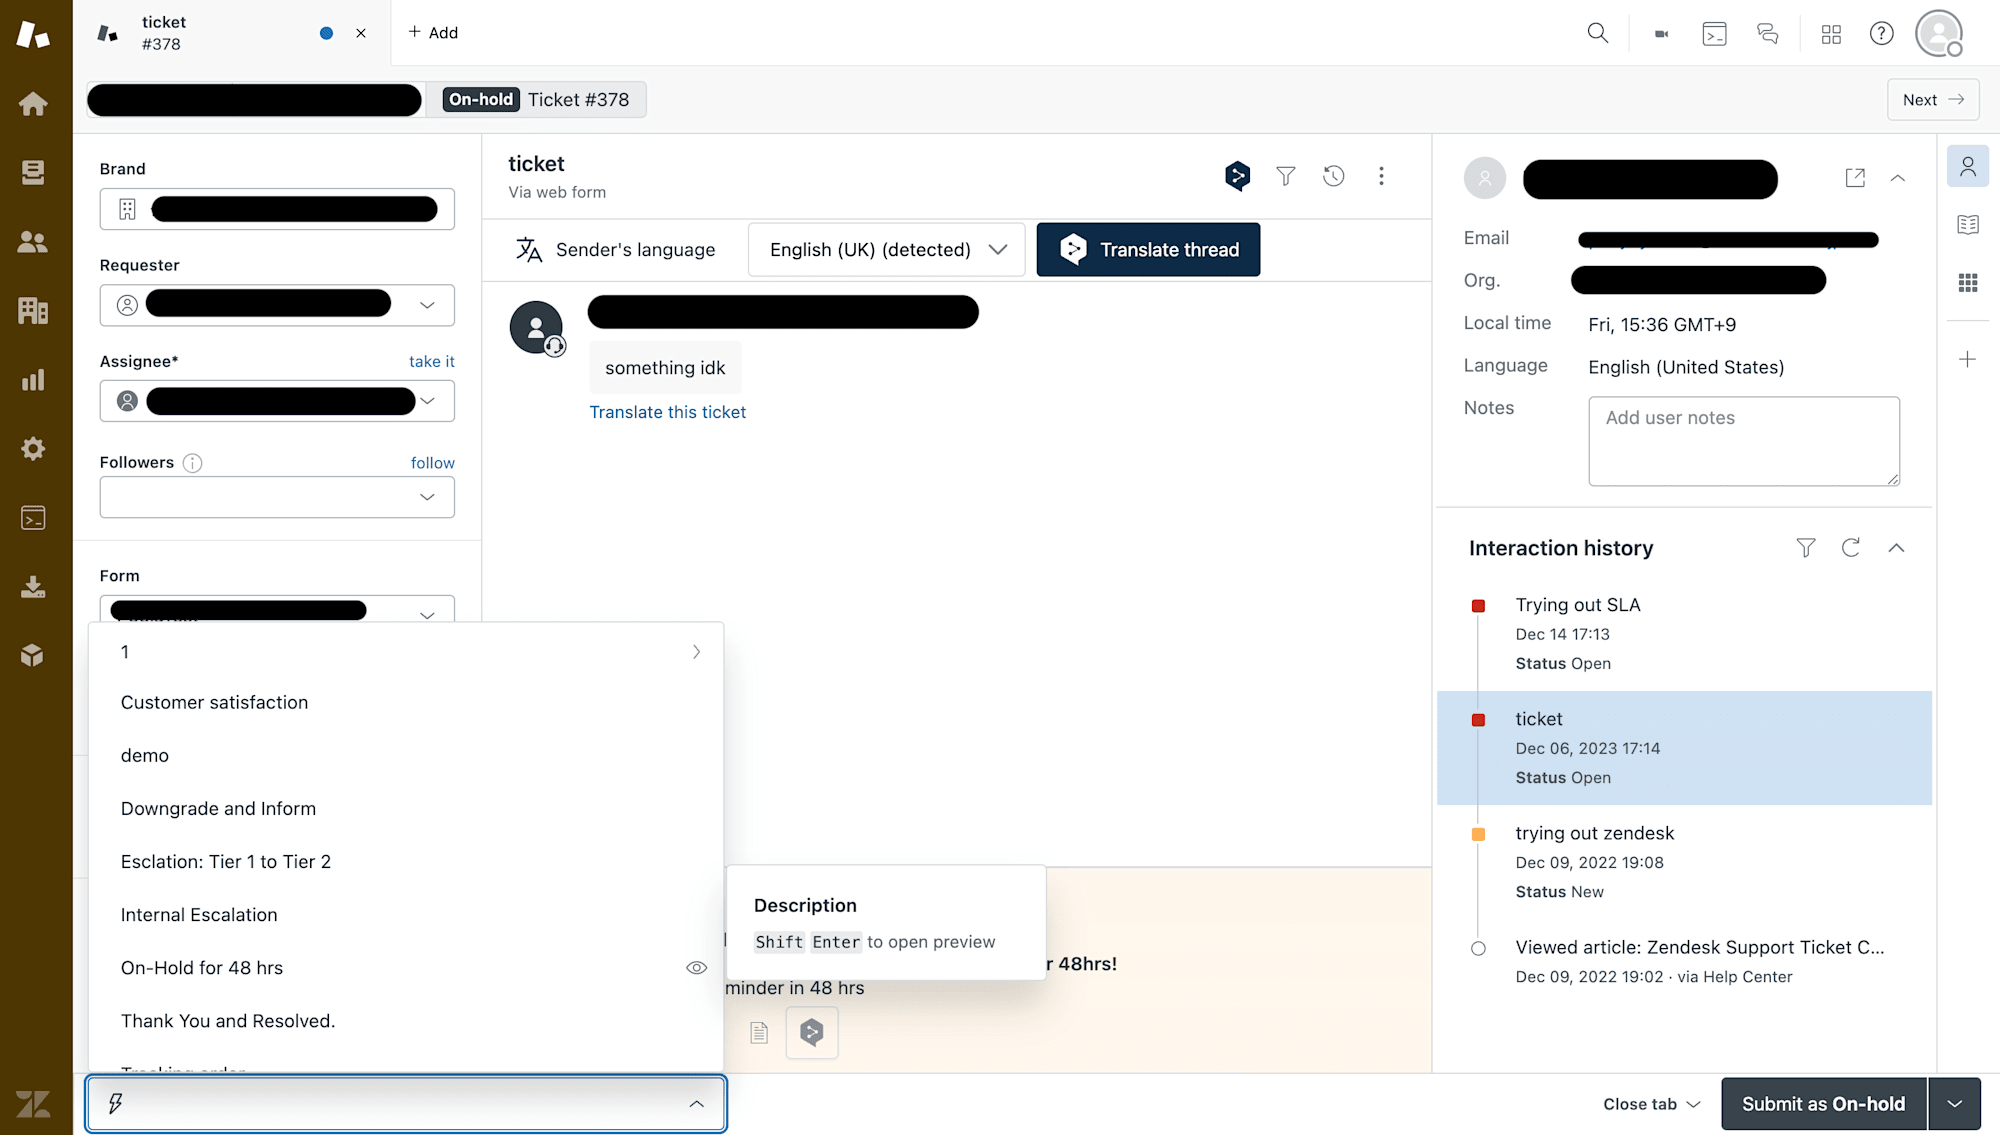
- You can either create a new ticket or add the macro to the existing ticket.
- You can either create a new ticket or add the macro to the existing ticket.
Step 3: Generating a Report for Macro Tags in Explore.
When tags are added to the existing or newly created macros, you can head to explore section and create a report to analyze it.
Follow the steps listed out below!
-
Open Explore:
- Navigate to Explore and click on the
Reportsicon.
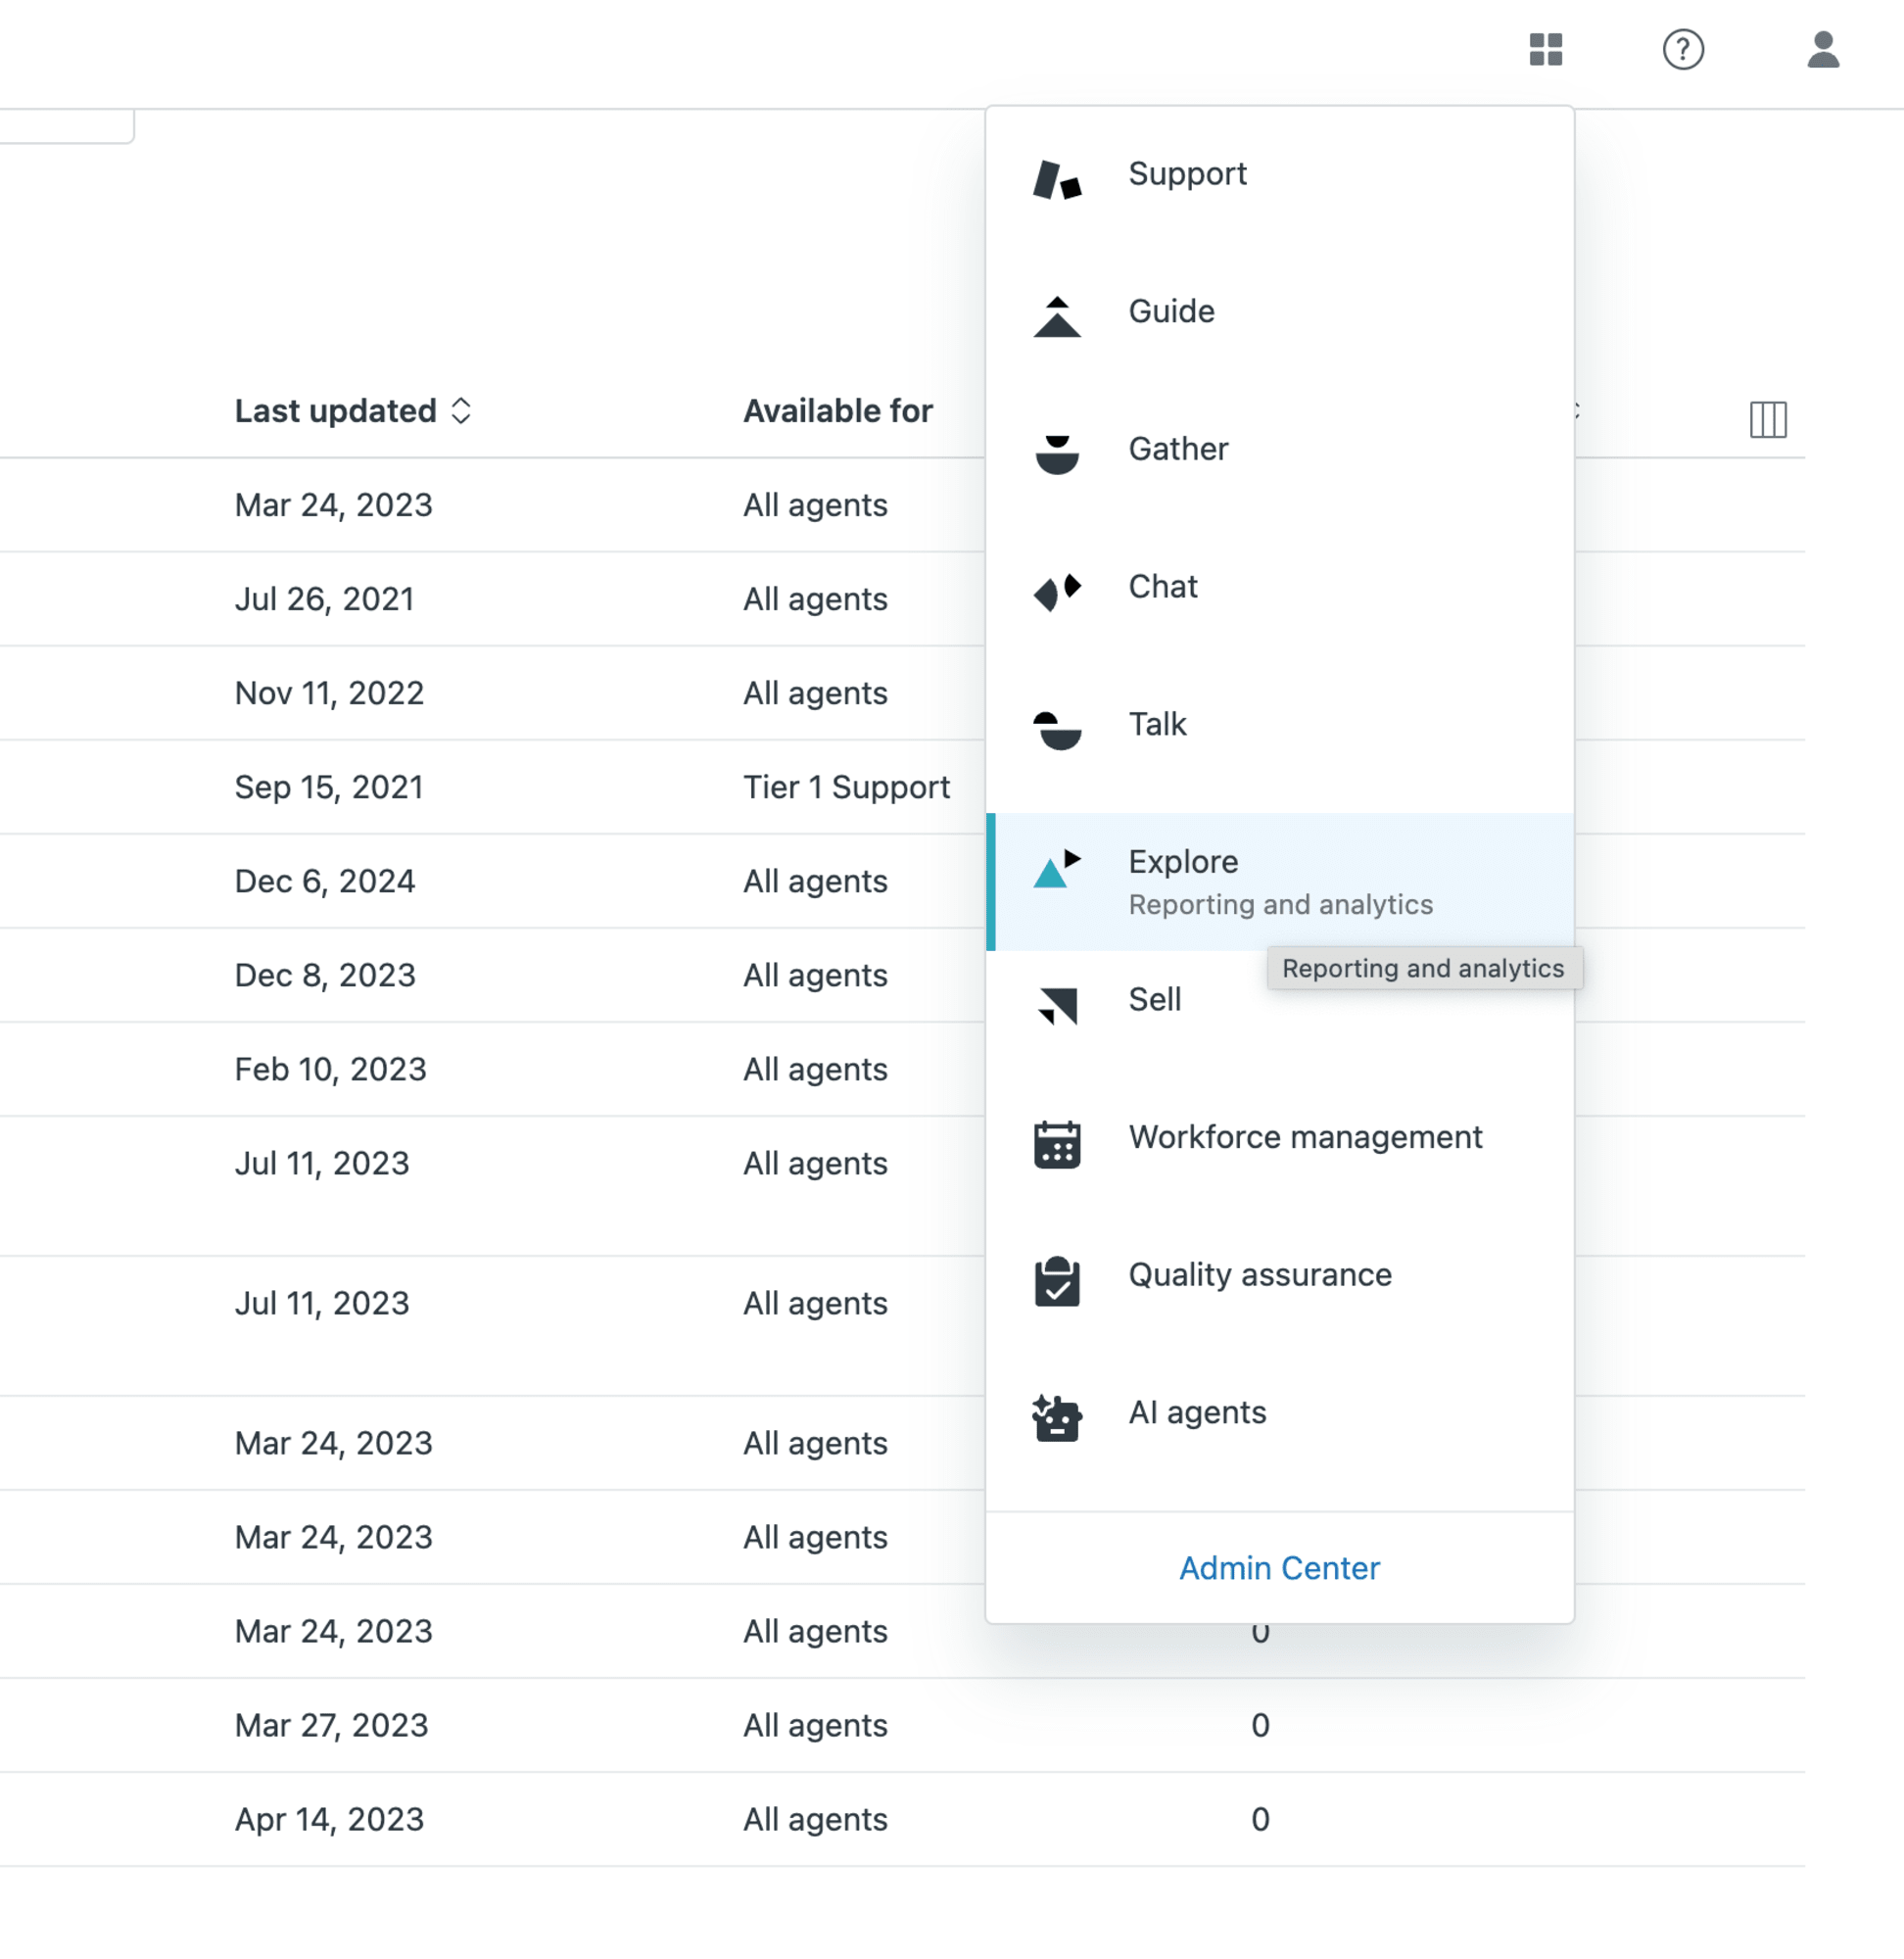
- Navigate to Explore and click on the
-
Create a New Report:
- In the Reports Library, click
New report.
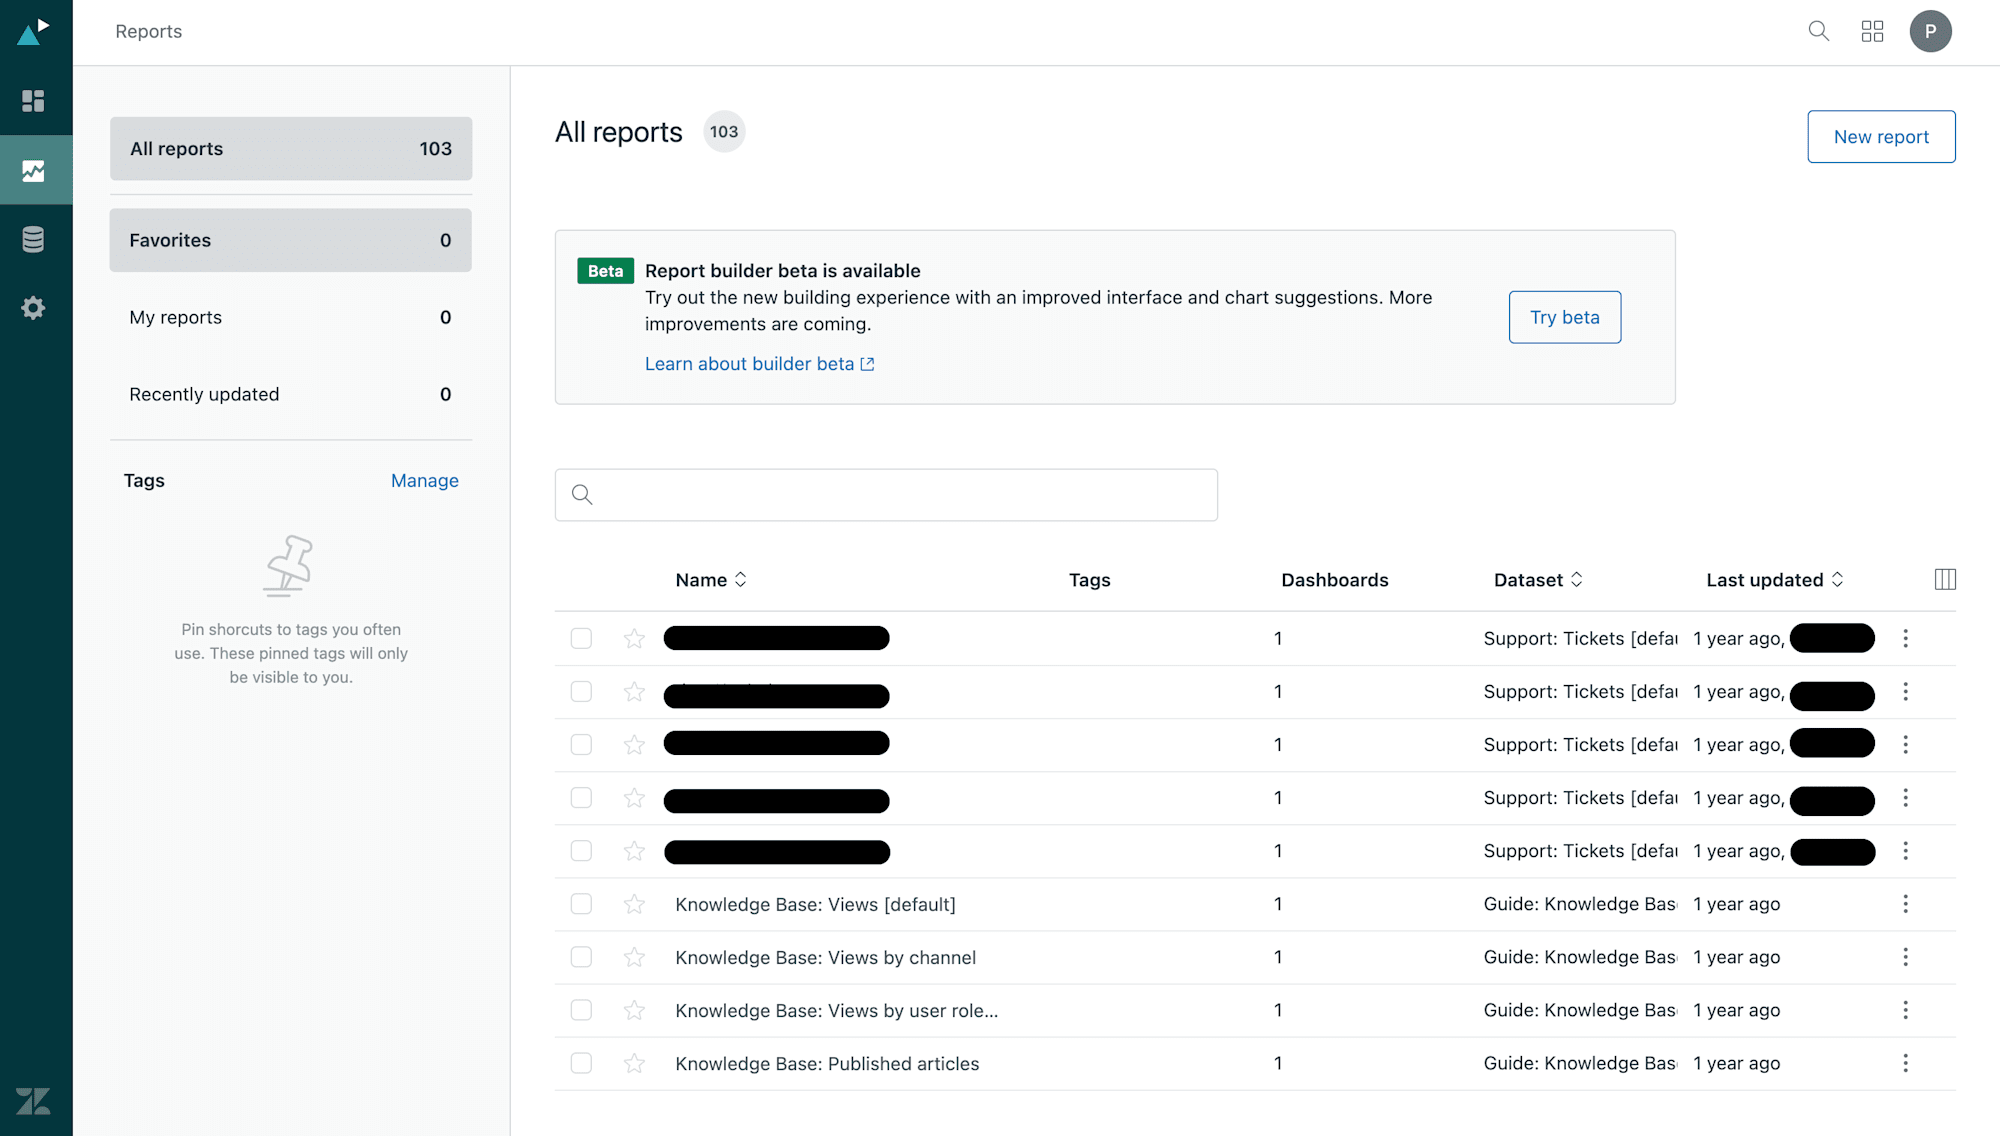
- On the
Select a datasetpage, chooseSupport - Ticketsand clickStart report.
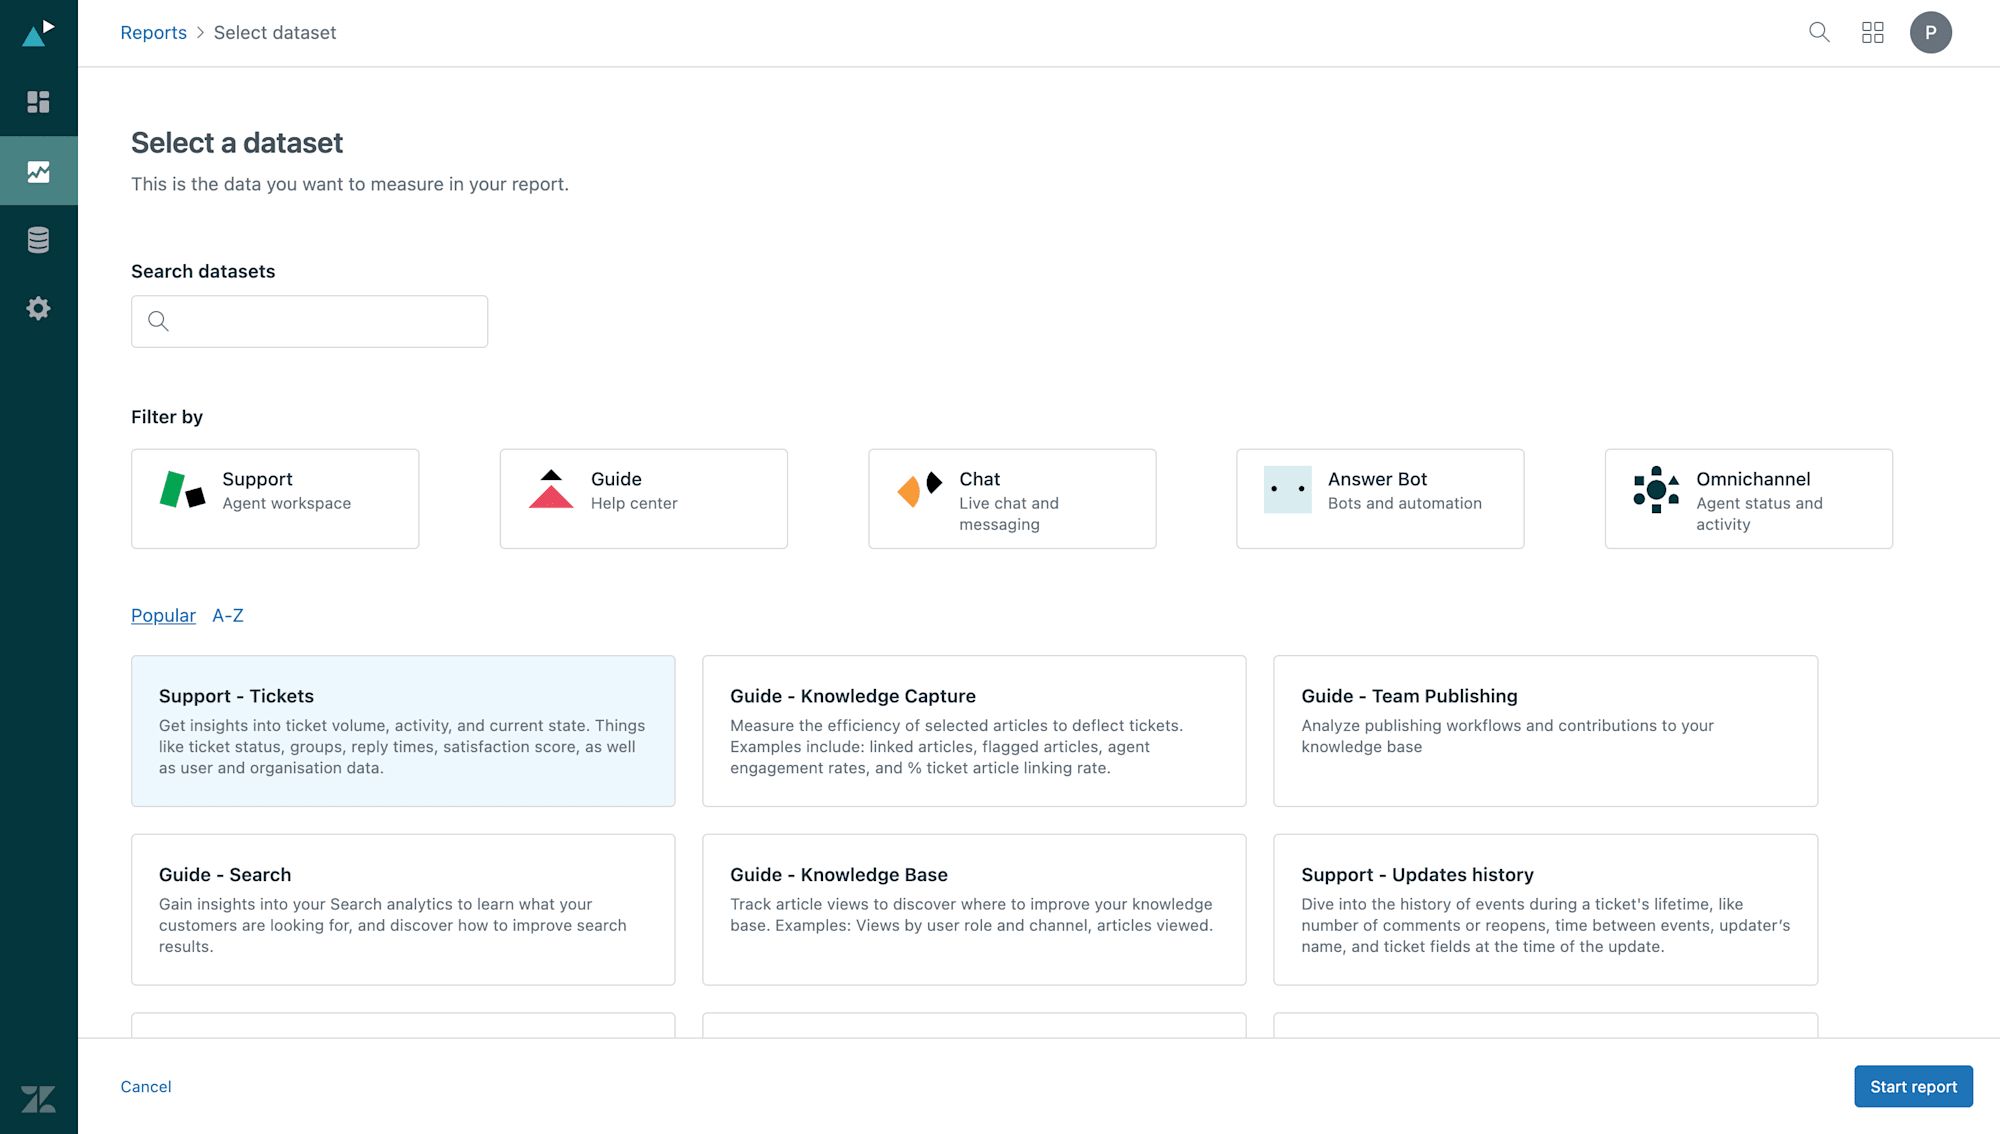
- In the Reports Library, click
-
Add a Metric:
- In the report builder, add a metric to measure the data. For this example, we’ll measure the number of tickets:
- Under the
Metricslist, selectTickets. - Click the
+button to add it to the report. This will add theTickets - Countdata.
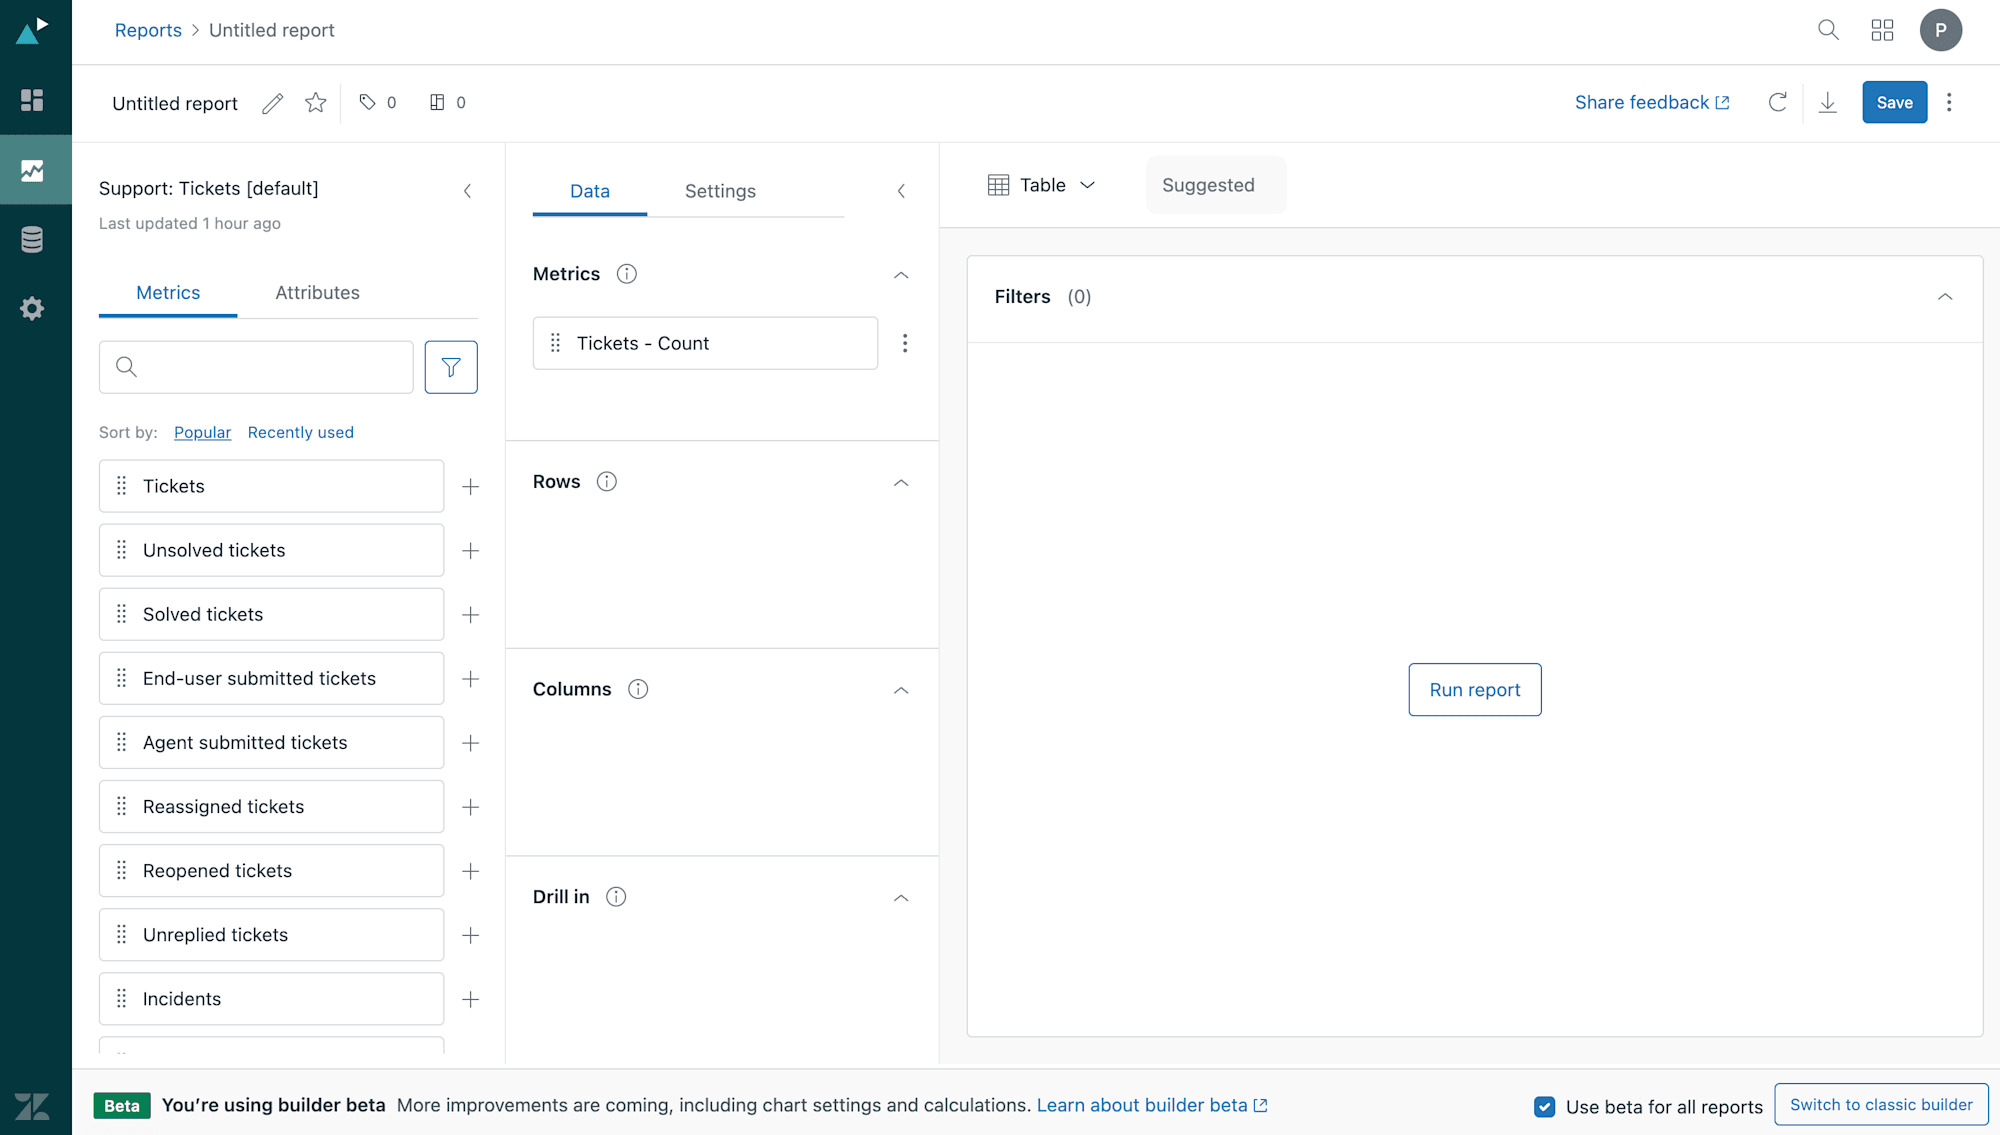
- Under the
- In the report builder, add a metric to measure the data. For this example, we’ll measure the number of tickets:
-
Add Attributes:
- Attributes help you organize your data. Add the following attributes:
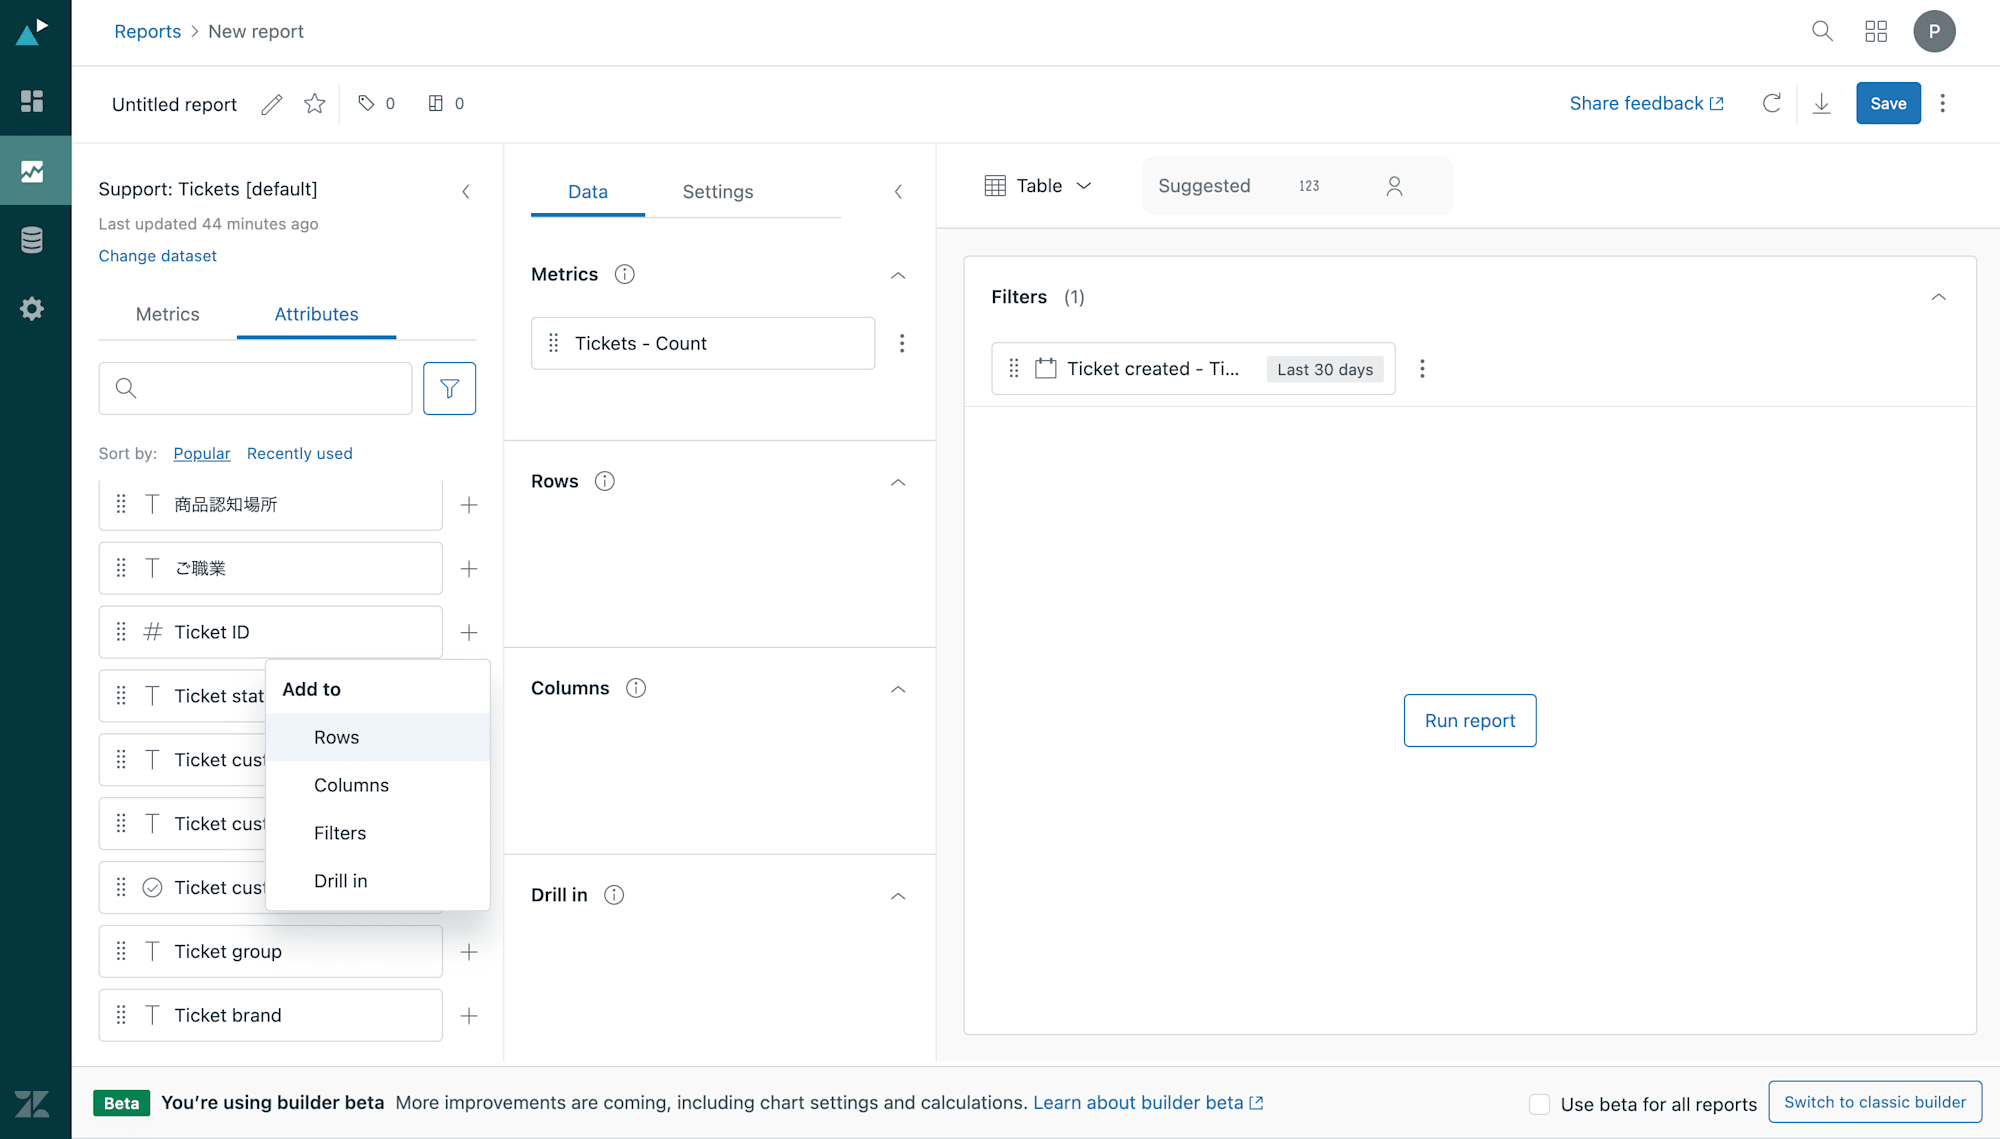
Ticket ID: SelectTicket IDfrom the Attributes list, click the+button, and chooseAdd to Rows. This generates a table of ticket IDs.
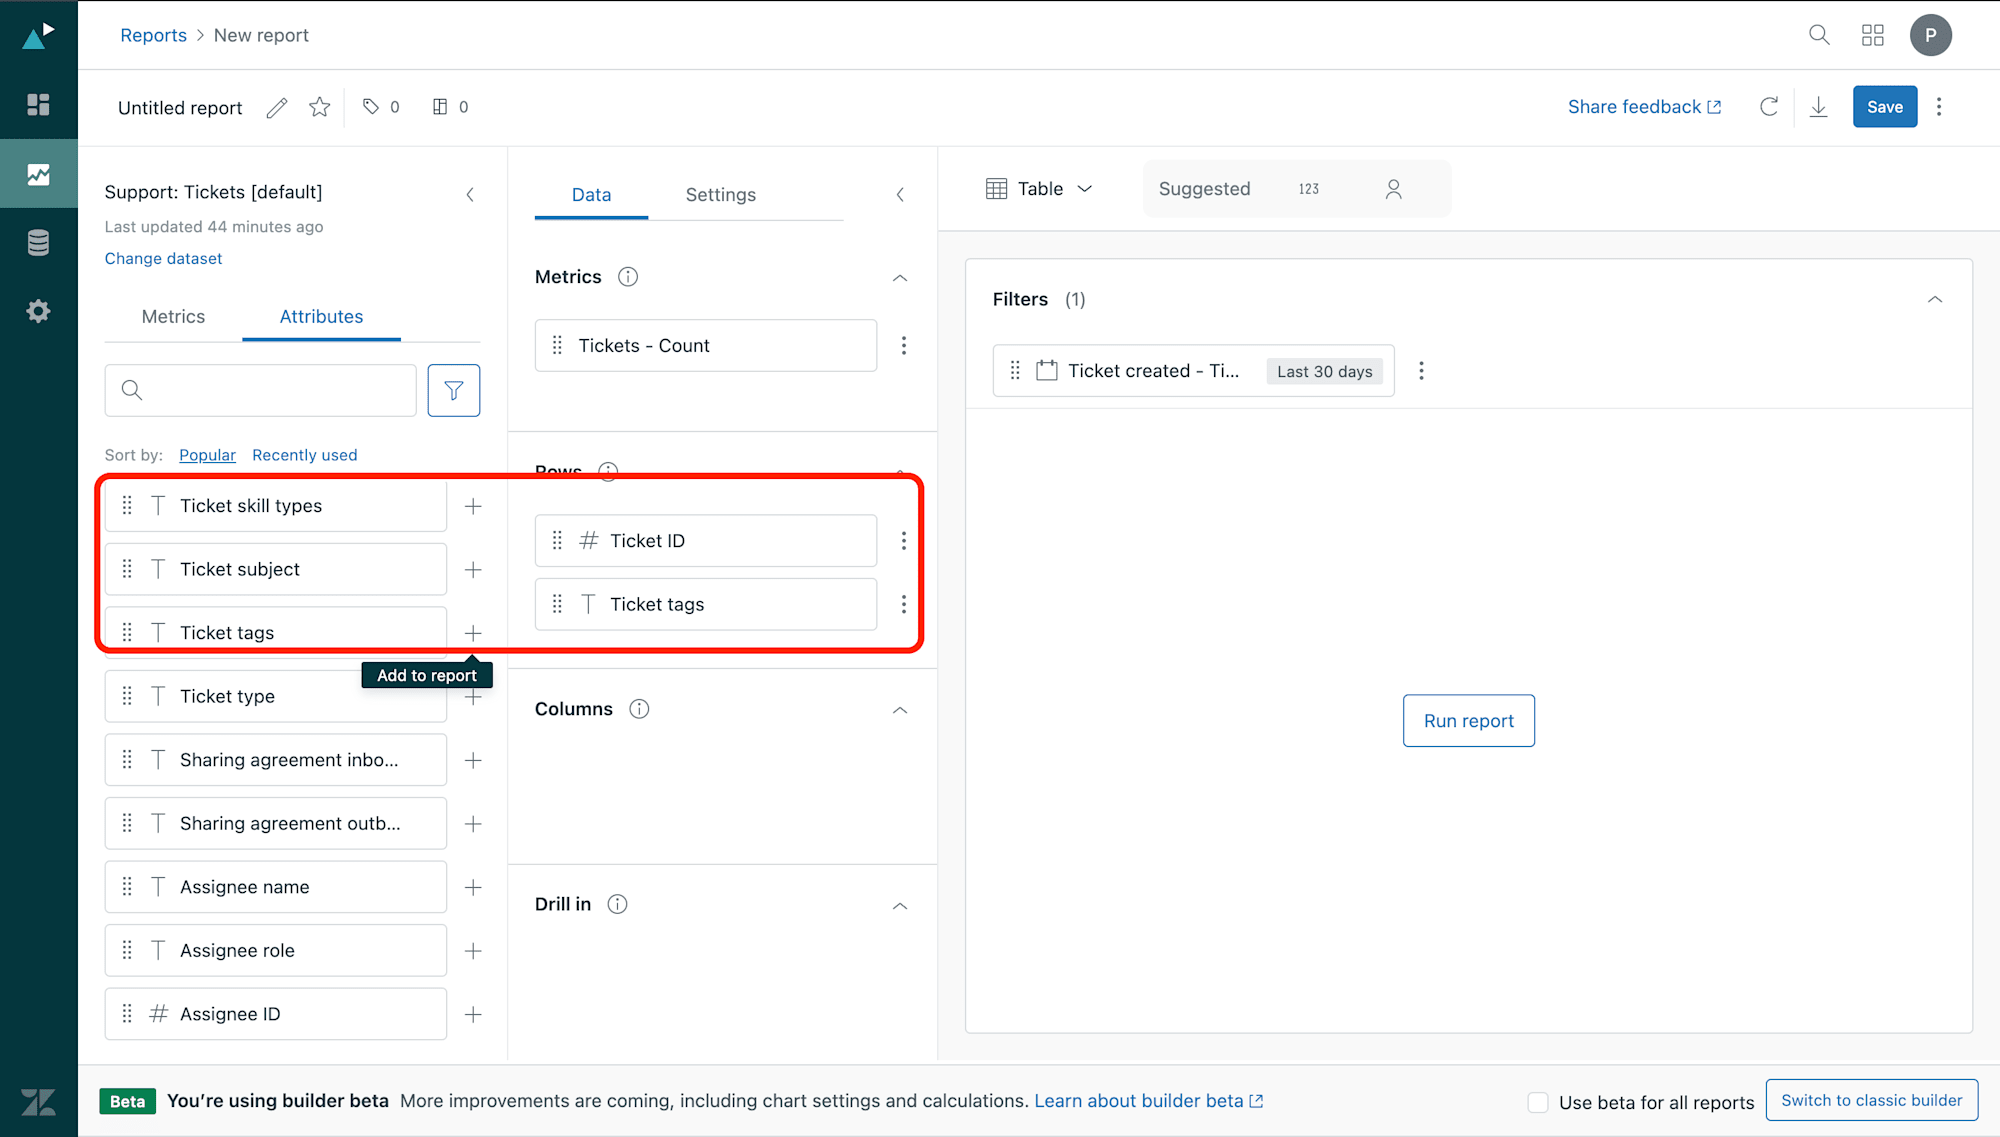
Ticket Tags: Similarly, findTicket tags, click the+button, and chooseAdd to Rows.
- Attributes help you organize your data. Add the following attributes:
-
Filter by a Specific Tag:
- To focus on tickets with a specific tag:
- Click the
+button next toTicket tagsand selectAdd to Filters.
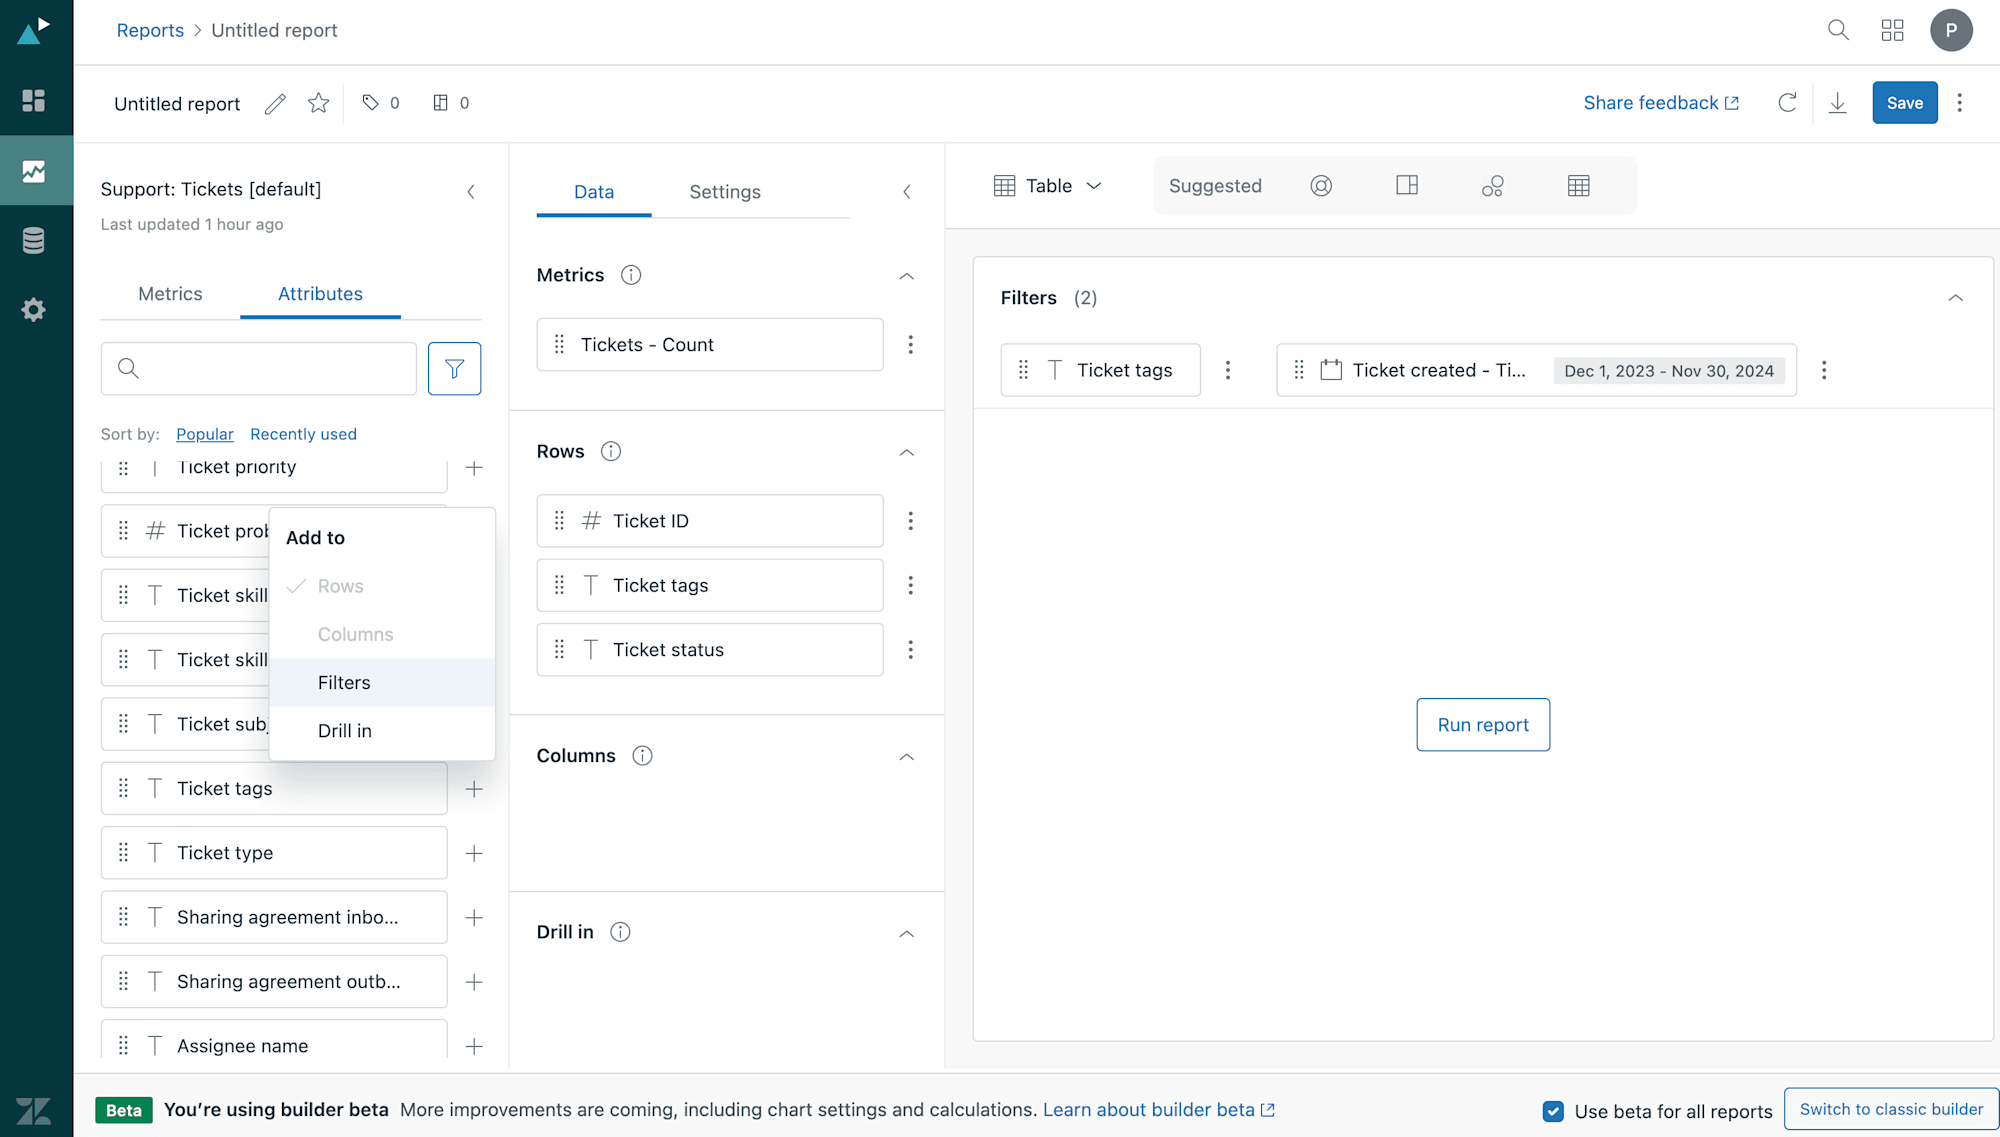
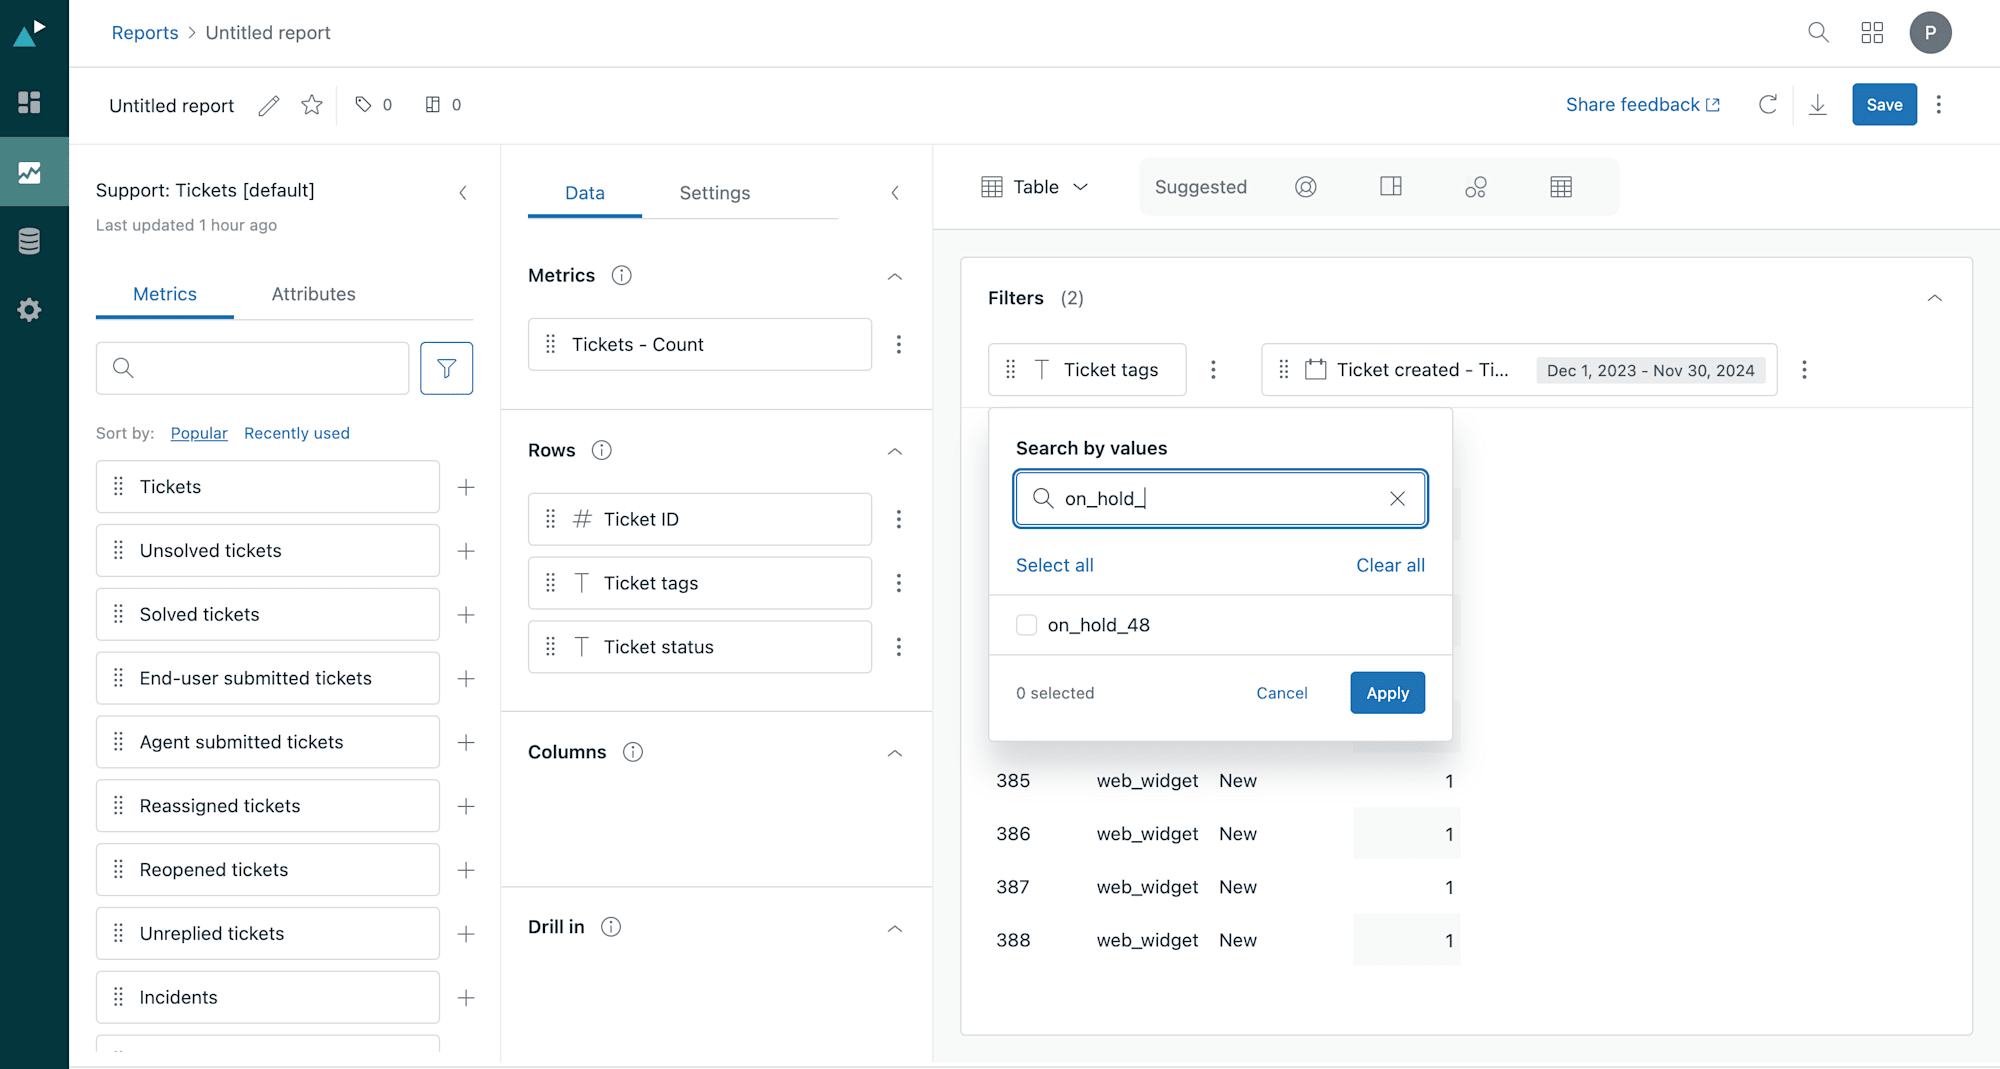
- Choose the tag you want to filter by (e.g.,
on_hold_48) and clickApply.
- Click the
- To focus on tickets with a specific tag:
-
Run the Report:
- After applying the filters, click
Run report. - This will generate a list of all tickets associated with the selected tag.
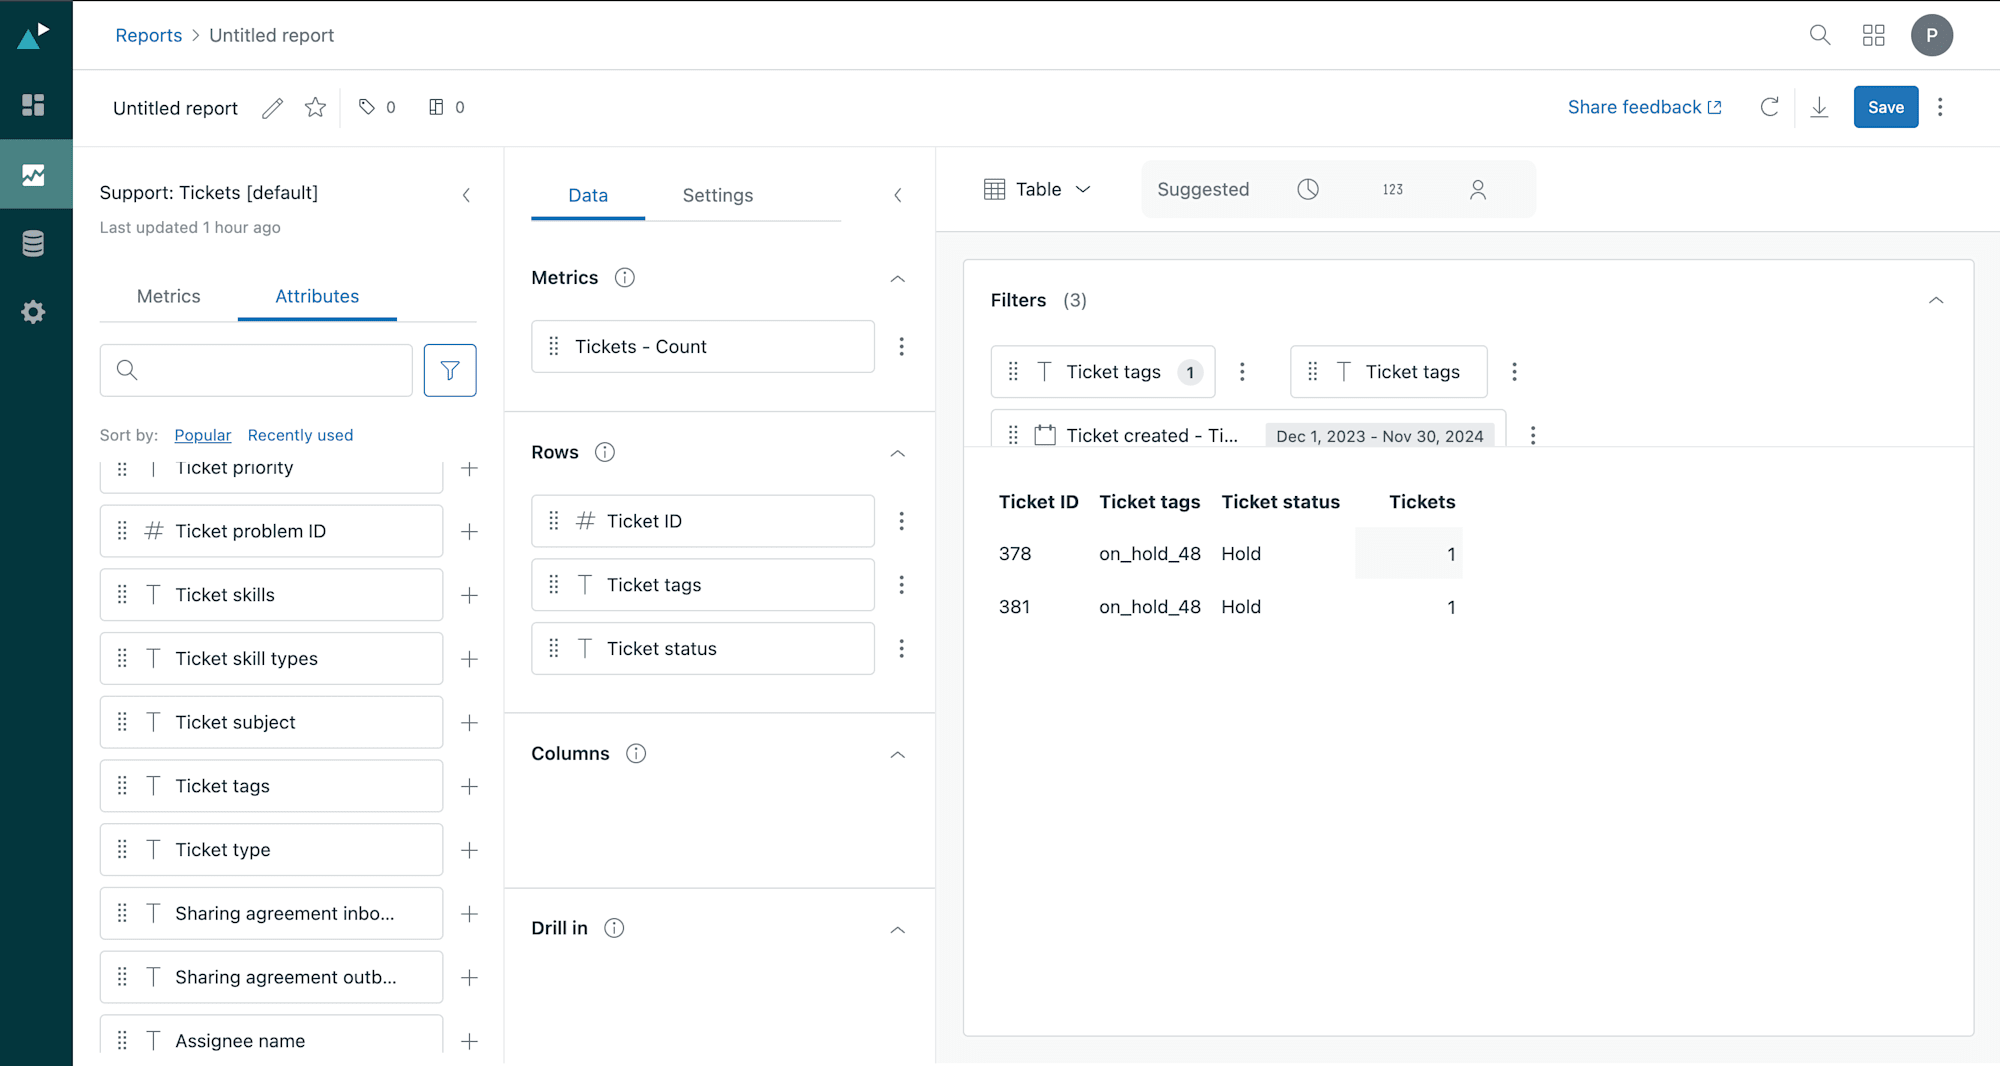
- After applying the filters, click
Conclusion
By adding tags to macros and generating reports in Explore, you can efficiently organize your macros and analyze ticket data based on those tags.
This process simplifies tracking and enhances data-driven decision-making.
Start tagging your macros today and unlock the potential of Explore reports!


