Transaction SearchのTrace indexing rateはCloudWatch Application Signalsに何か影響を与えるのか検証してみた
Transaction SearchのTrace indexing rateがApplication Signalsにどのような影響を及ぼすのか気になる
こんにちは、のんピ(@non____97)です。
皆さんはTransaction SearchのTrace indexing rateがCloudWatch Application Signals(以降、Application Signals)にどのような影響を及ぼすのか気になったことはありますか? 私はあります。
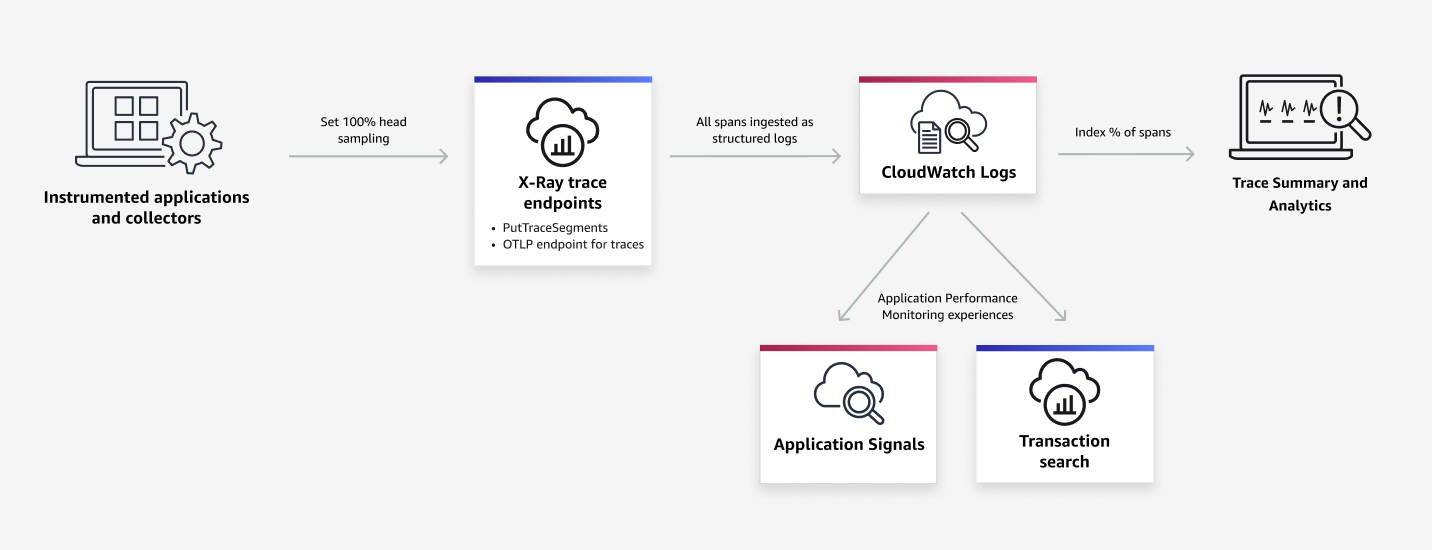
Application Signalsを使用する際、X-RayのOTLPエンドポイントへトレースを流すことが多いでしょう。
上述の記事でも紹介されているとおり、OTLPのエンドポイントを利用するにはTransaction Searchを有効化する必要があります。
Transaction Searchを有効化する際に、設定項目としてTrace indexing rateも存在しています。
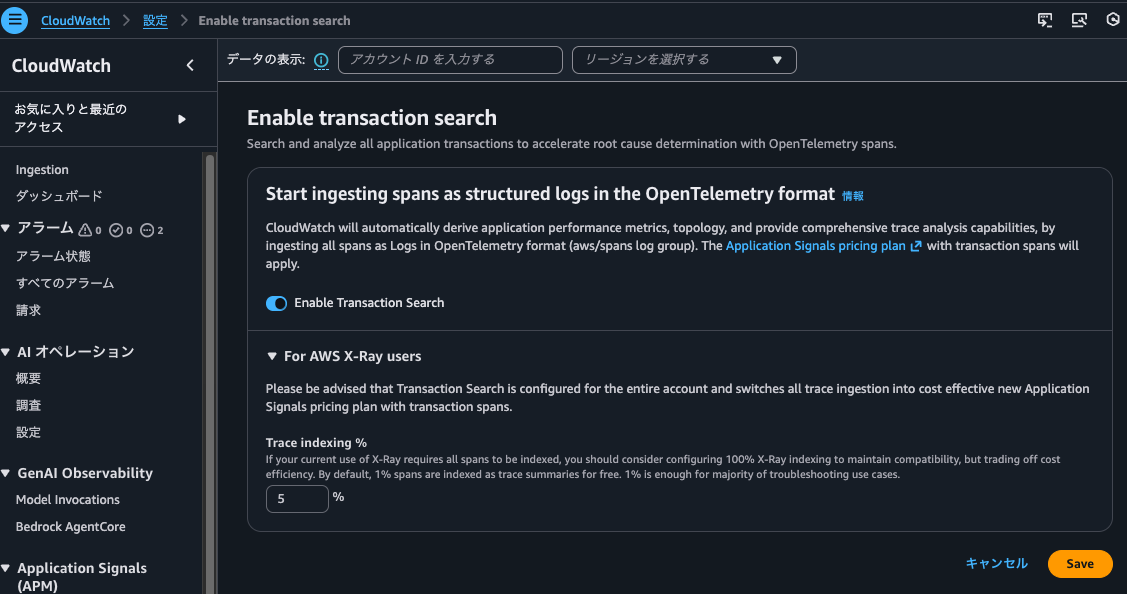
Trace indexing rateはTransaction Searchを無効にすると指定できなくなります。
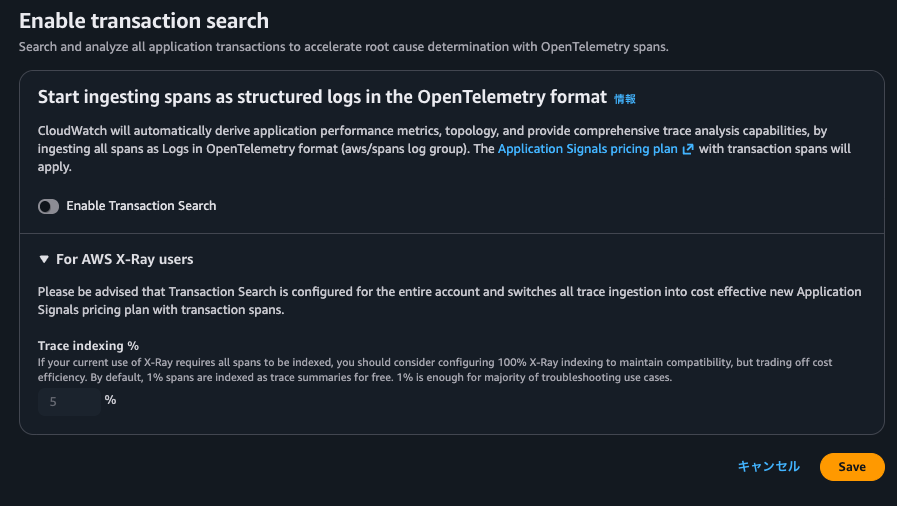
ここからTransaction SearchとTrace indexing rateは強い関係性がありそうです。
Trace indexing rateはその名の通り、そのトレースにインデックスを張るかのレートです。Trace indexing rateによってApplication Signalsのメトリクスの計算で使用するトレースが減ったり、相関スパンで表示されないスパンが出てきたりするのは避けたいです。
以下画像にTrace indexing rateについて記載がありました。
抜粋 : Transaction Search - Amazon CloudWatch
ここから推測するに、CloudWatch Logs(おそらくaws/spans)に出力されたスパンのトレースのサマリや分析用のインデックスであり、Application SignalsやTransaction Search自体に直接的な影響は与えなさそうです。
実際にTrace indexing rateの値を変えて、Application Signalsにどのような作用があるのか確認してみました。
いきなりまとめ
- Transaction SearchのTrace indexing rateがApplication Signalsに直接的な影響を及ぼさない
- インデックスはされなくとも、トレースからメトリクスは生成される
- メトリクスから元となったトレース(相関スパン)の確認も可能
- Trace indexing rateで指定した値の割合でトレースがインデックスされ、インデックスされたトレースについては以下が実施可能
- トレースのサマリー検索
- Trace Mapでの表示
- ダッシュボードの表示
- アナリティクスコンソールでのトレースの分析
- インデックスされていないトレースもTransaction Searchでは検索可能
- Transaction Searchの実態はLogs Insights
aws/spansにフィールドインデックスを張って、クエリ実行時のコストや時間を抑えよう
- Trace indexing rateが0%の場合でもStep FunctionsのX-Rayトレーシング機能で記録されたトレースは検索可能
- Application Signalsでサービスの
概要やサービスオペレーションの各メトリクスのグラフをクリックして相関スパンを表示するときはaws/spansにクエリを実行しており、依存関係タブから相関するスパンを表示する際には/aws/application-signals/dataへクエリを実行する - インデックスされたスパン数によって課金が発生するため、トレースはApplication SignalsやTransaction Searchで確認する運用とし、トレースのサマリで使用するトレースは数%分で十分なのであれば、その割合をTrace indexing rateに反映させると良さそう
やってみた
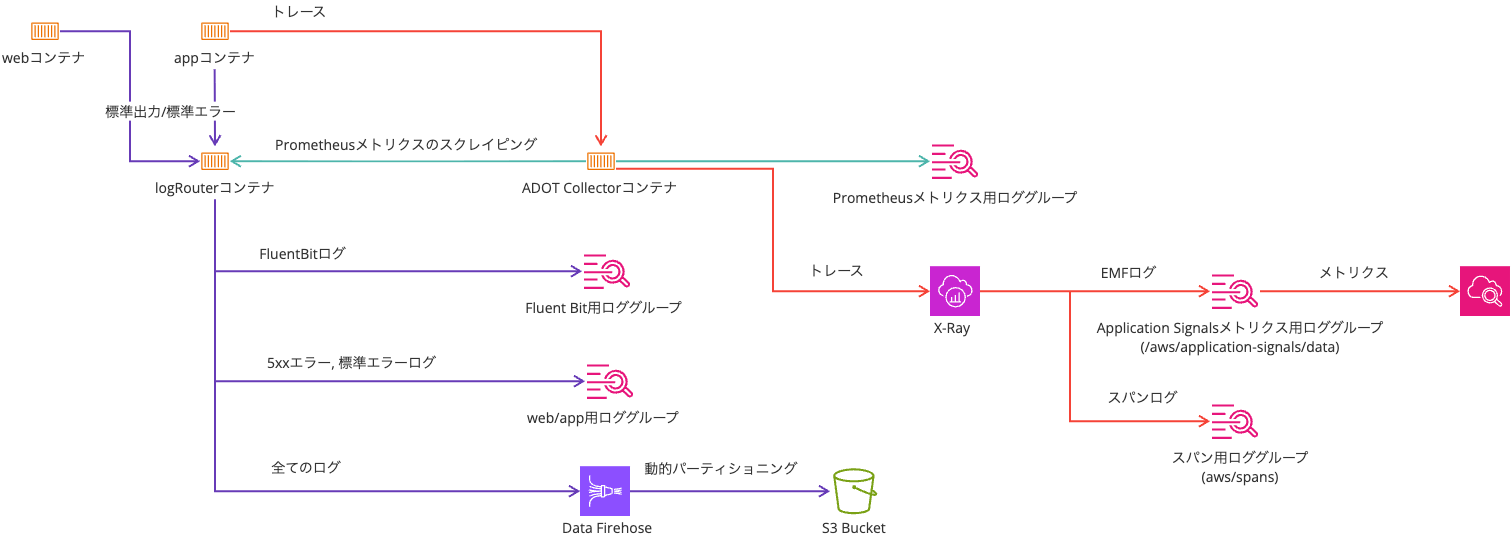
検証環境
検証環境は以下のとおりです。
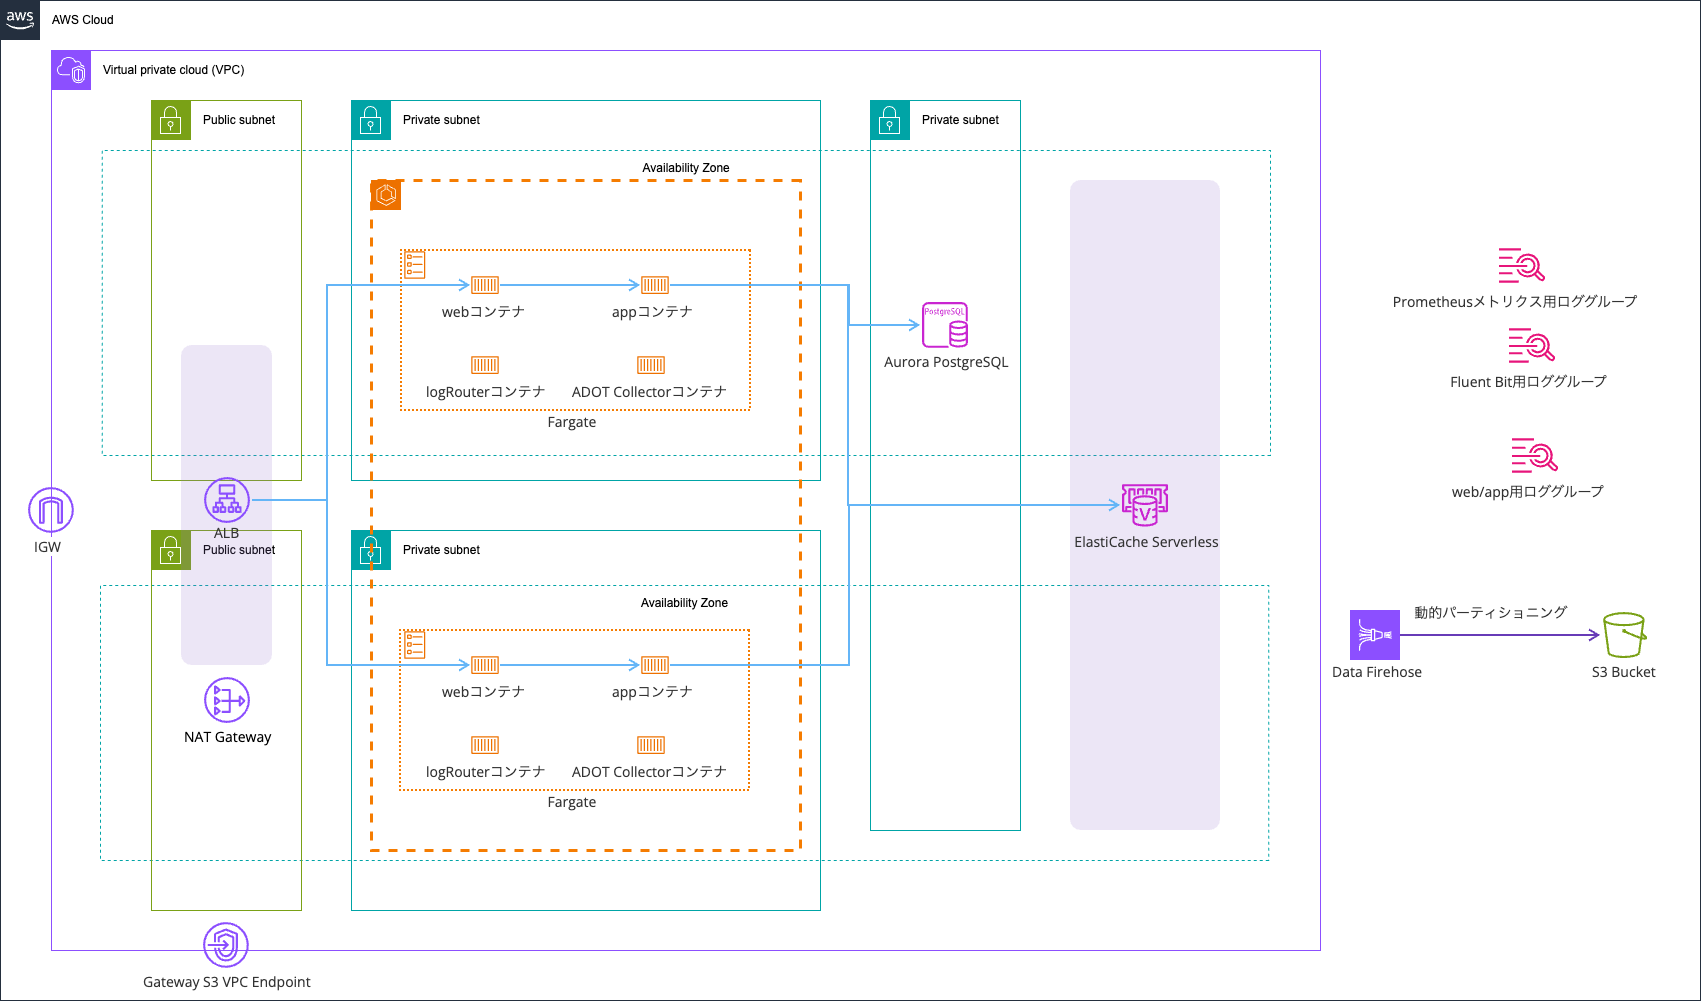
以下記事のものを利用します。
こちらの記事のものはトレースサンプラーをX-Rayにしているため、1秒間に複数回アクセスされる場合、2回目以降は5%の確率でサンプリングします。
サンプリングルールは、一連の基準に対して記録するリクエストの数を AWS Distro for OpenTelemetry (ADOT) または X-Ray SDK に指示します。デフォルトでは、SDK は 1 秒ごとに最初のリクエストを記録し、追加のリクエストの 5% を記録します。1 秒あたり 1 つのリクエストがリザーバです。これにより、サービスがリクエストを処理している限り、毎秒少なくとも 1 つのトレースが記録されます。5% は、リザーバサイズを超えて追加リクエストがサンプリングされるレートです。
この検証では1秒間に複数回アクセスする想定はないのですが、全てのアクセスに対するトレースを記録したかったため、always_onとしています。
Application SignalsやOTel周りの環境変数は以下のとおりです。
| 環境変数名 | 値 |
|---|---|
| OTEL_AWS_APPLICATION_SIGNALS_ENABLED | false |
| OTEL_EXPORTER_OTLP_ENDPOINT | http://localhost:4318 |
| OTEL_EXPORTER_OTLP_PROTOCOL | http/protobuf |
| OTEL_LOGS_EXPORTER | none |
| OTEL_METRICS_EXPORTER | none |
| OTEL_PROPAGATORS | tracecontext,baggage,xray |
| OTEL_RESOURCE_ATTRIBUTES | service.name=ecs-express-app,deployment.environment=ecs:EcsNativeBlueGreenStack-EcsConstructCluster14AE103B-GxDEV566XVyC |
| OTEL_TRACES_EXPORTER | otlp |
| OTEL_TRACES_SAMPLER | always_on |
Trace indexing rateが0%の場合
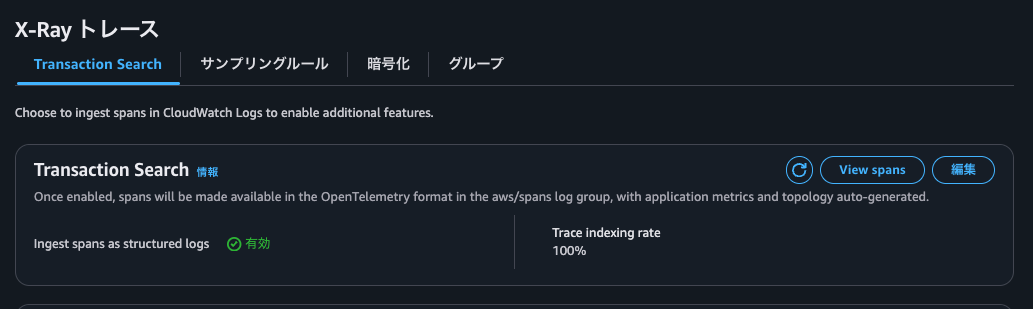
まずはTrace indexing rateが0%の場合です。
マネジメントコンソールから確認すると、以下のようになっています。
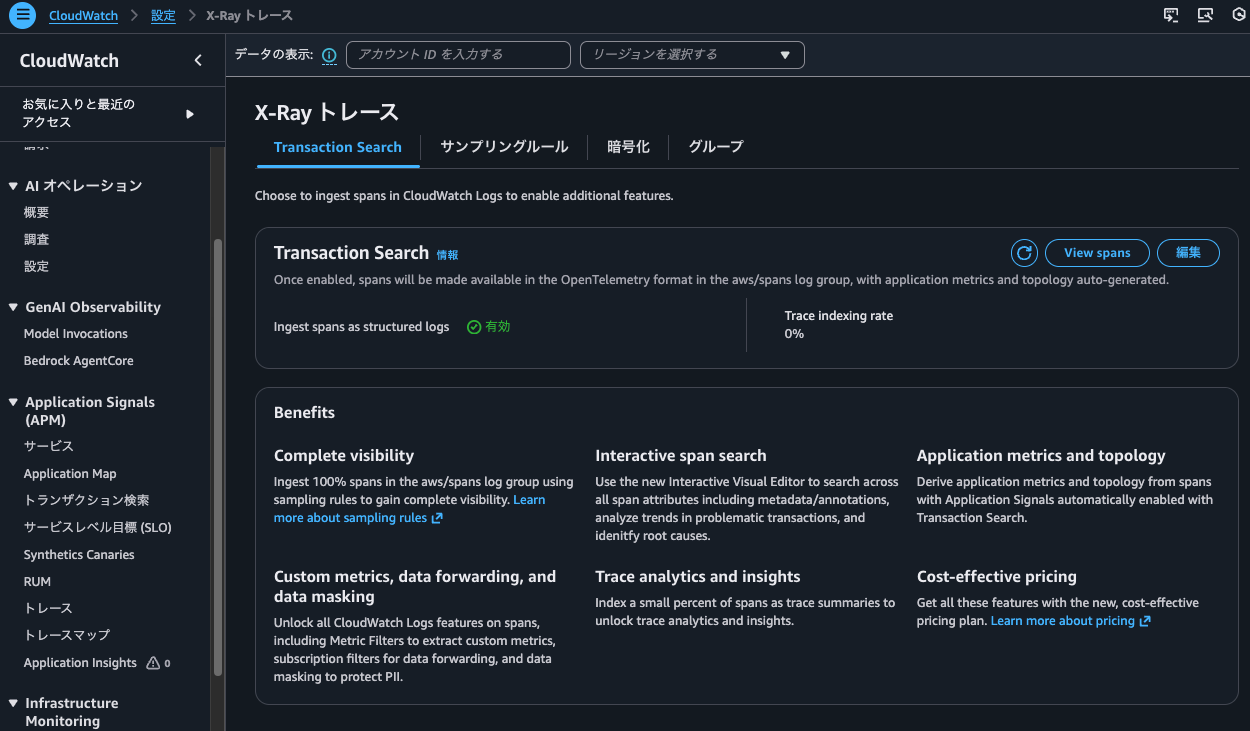
AWS CLIからも確認しました。
> aws xray get-trace-segment-destination
{
    "Destination": "CloudWatchLogs",
    "Status": "ACTIVE"
}

> aws xray get-indexing-rules
{
    "IndexingRules": [
        {
            "Name": "Default",
            "ModifiedAt": "2026-02-06T18:07:26+09:00",
            "Rule": {
                "Probabilistic": {
                    "DesiredSamplingPercentage": 0.0
                }
            }
        }
    ]
}
それでは、この状態で以下のコマンドを実行し、しばらくアクセスし続けます。
> while true; do
  curl -c cookie.txt -b cookie.txt http://EcsNat-AlbCo-cqUiql4hqrPT-641057317.us-east-1.elb.amazonaws.com/app/ --get -s
  echo ""
  sleep $((RANDOM % 10 + 1))
  done
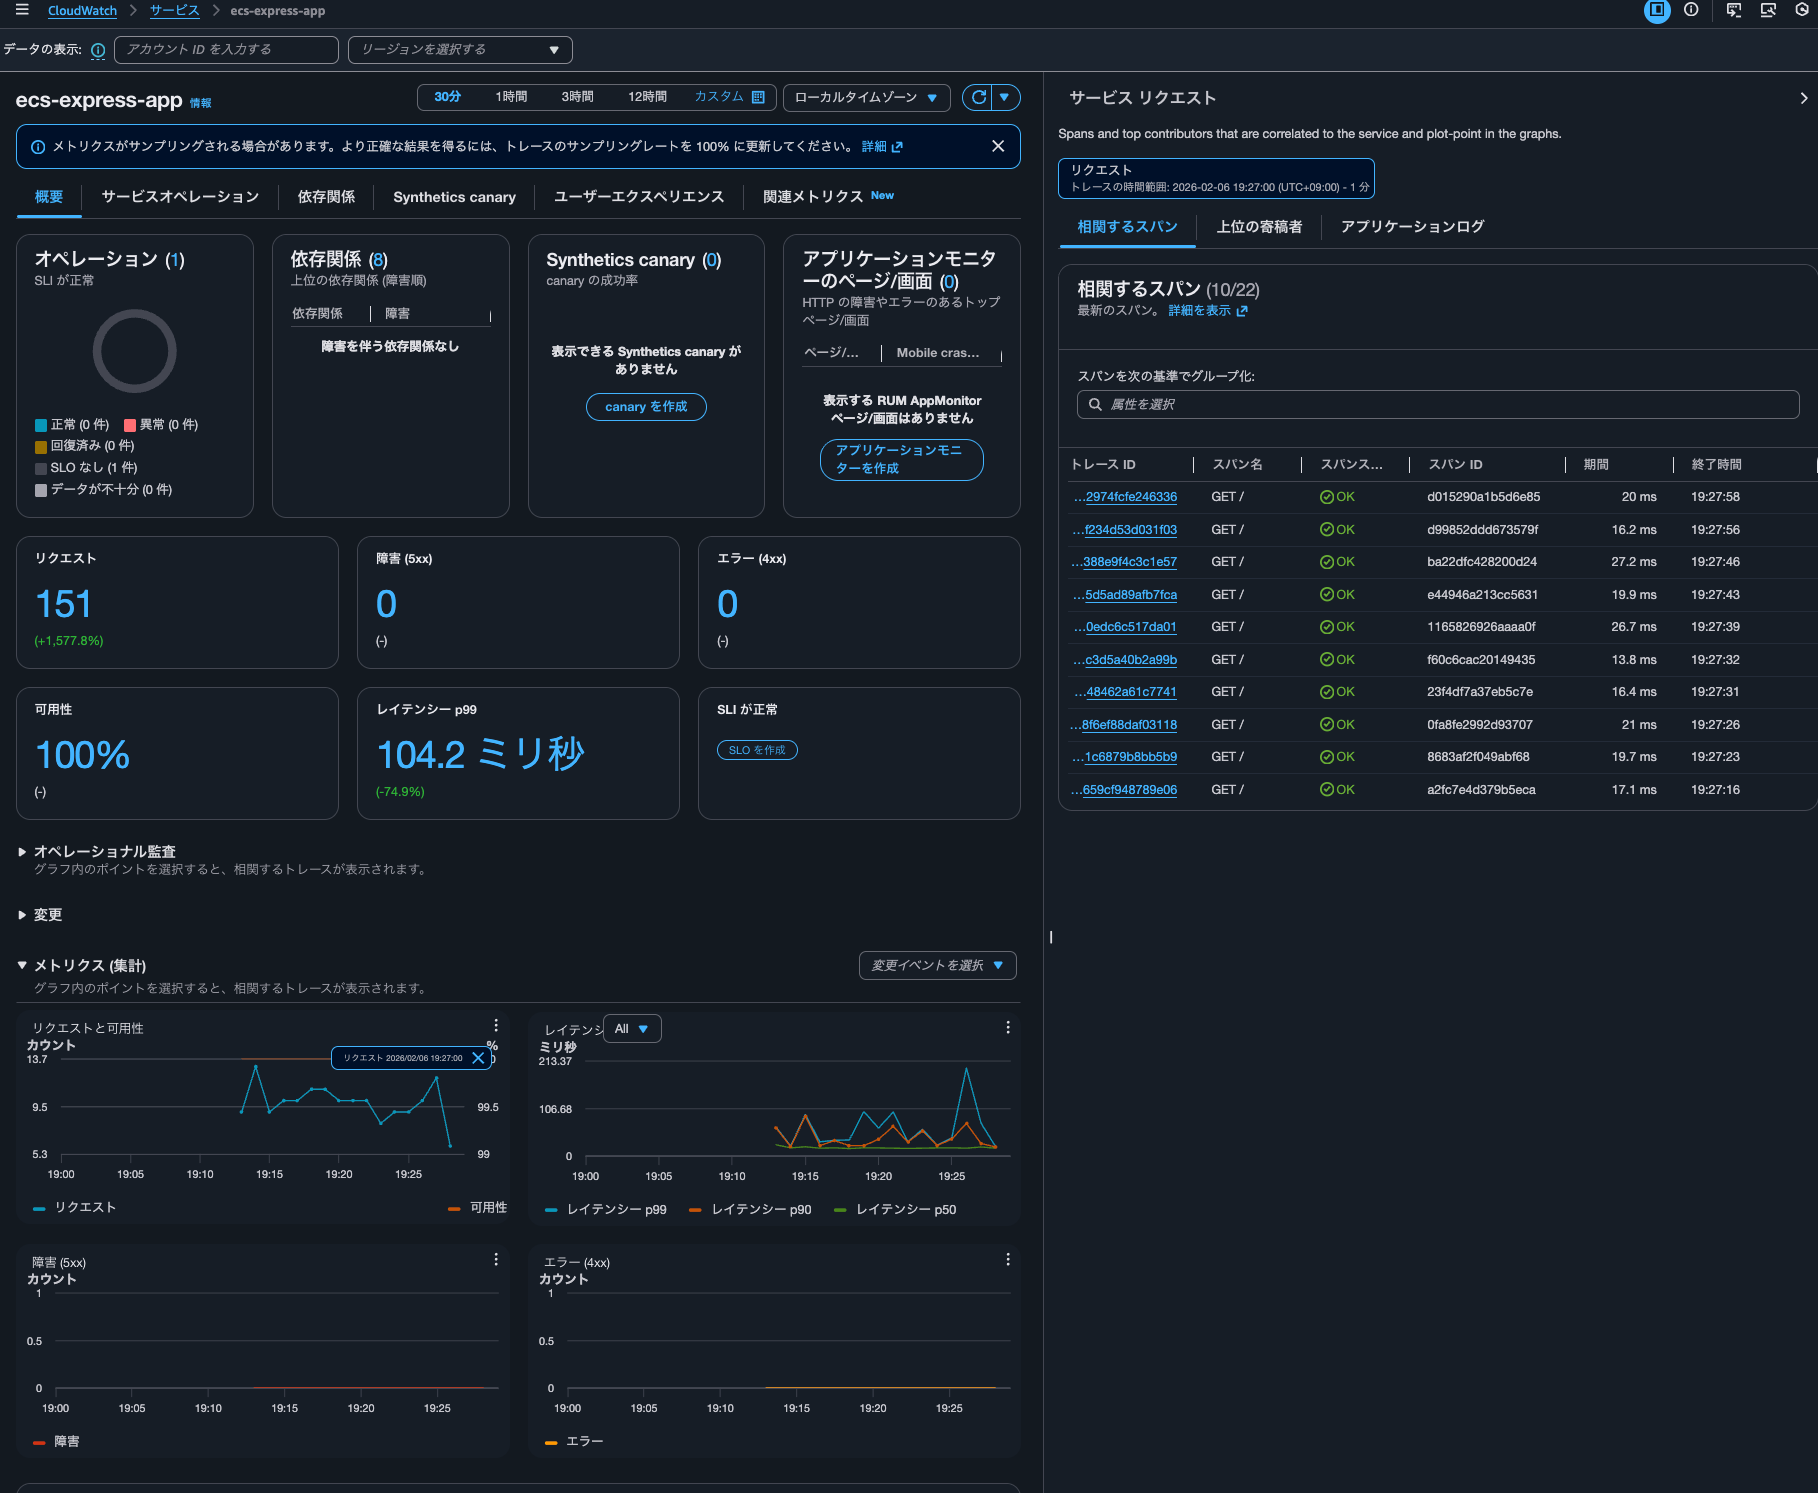
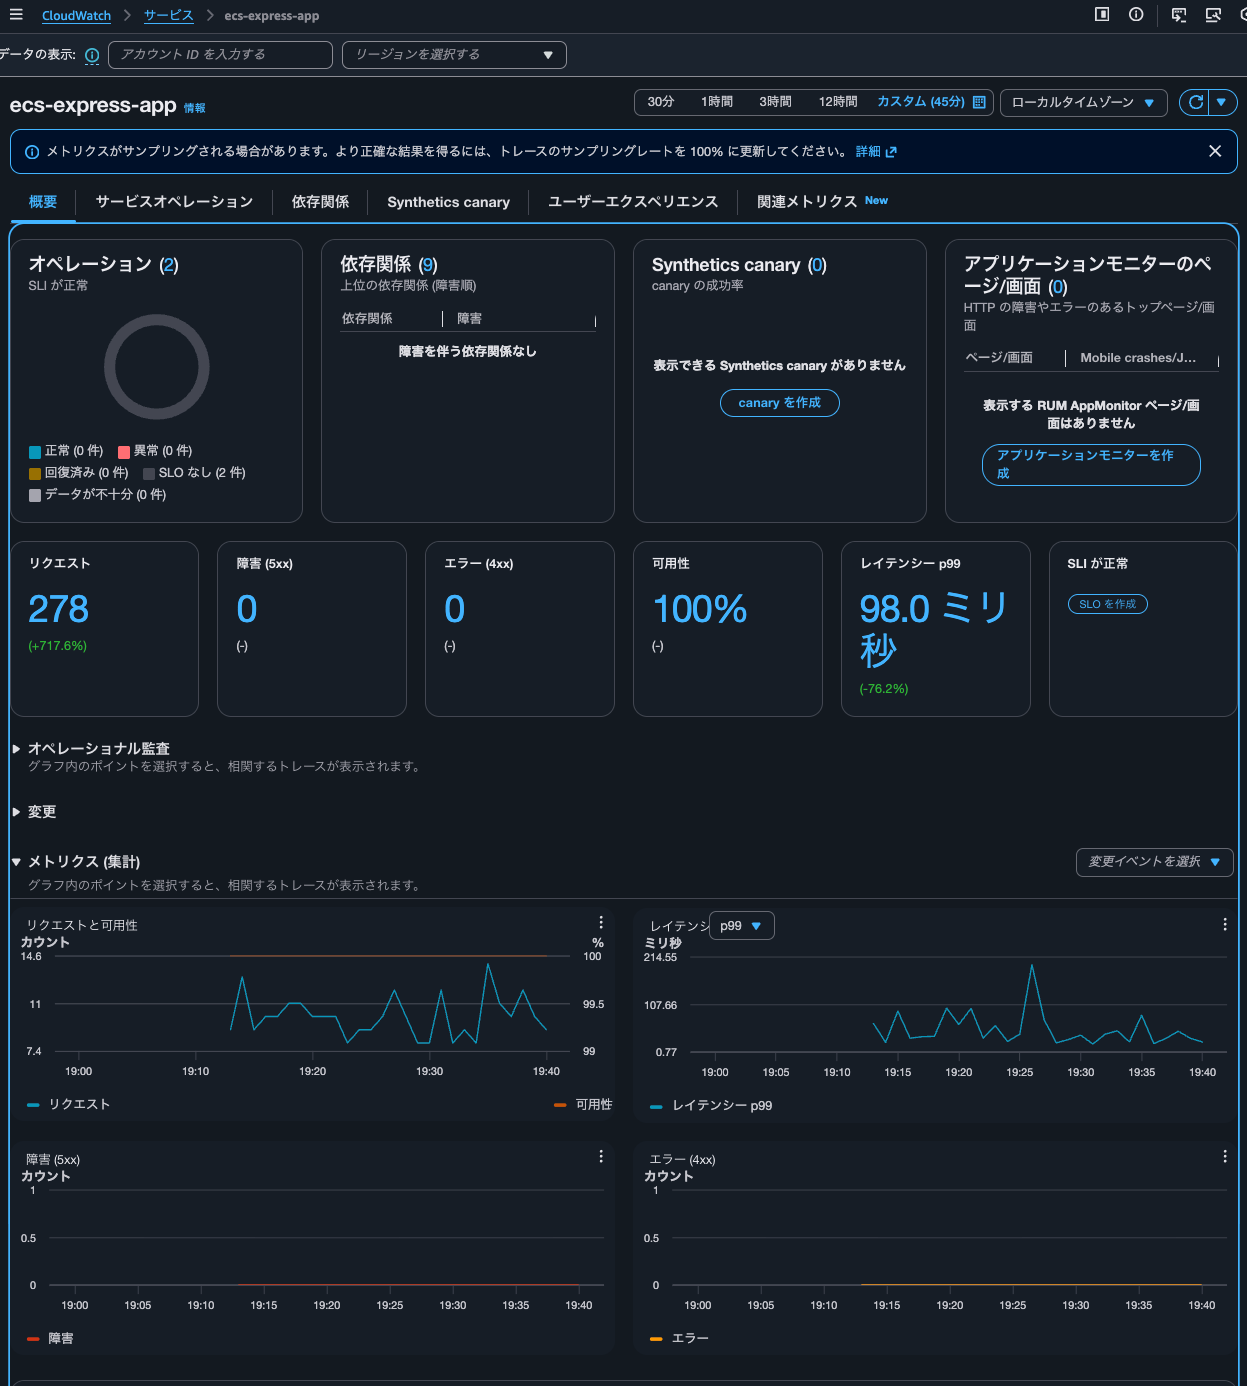
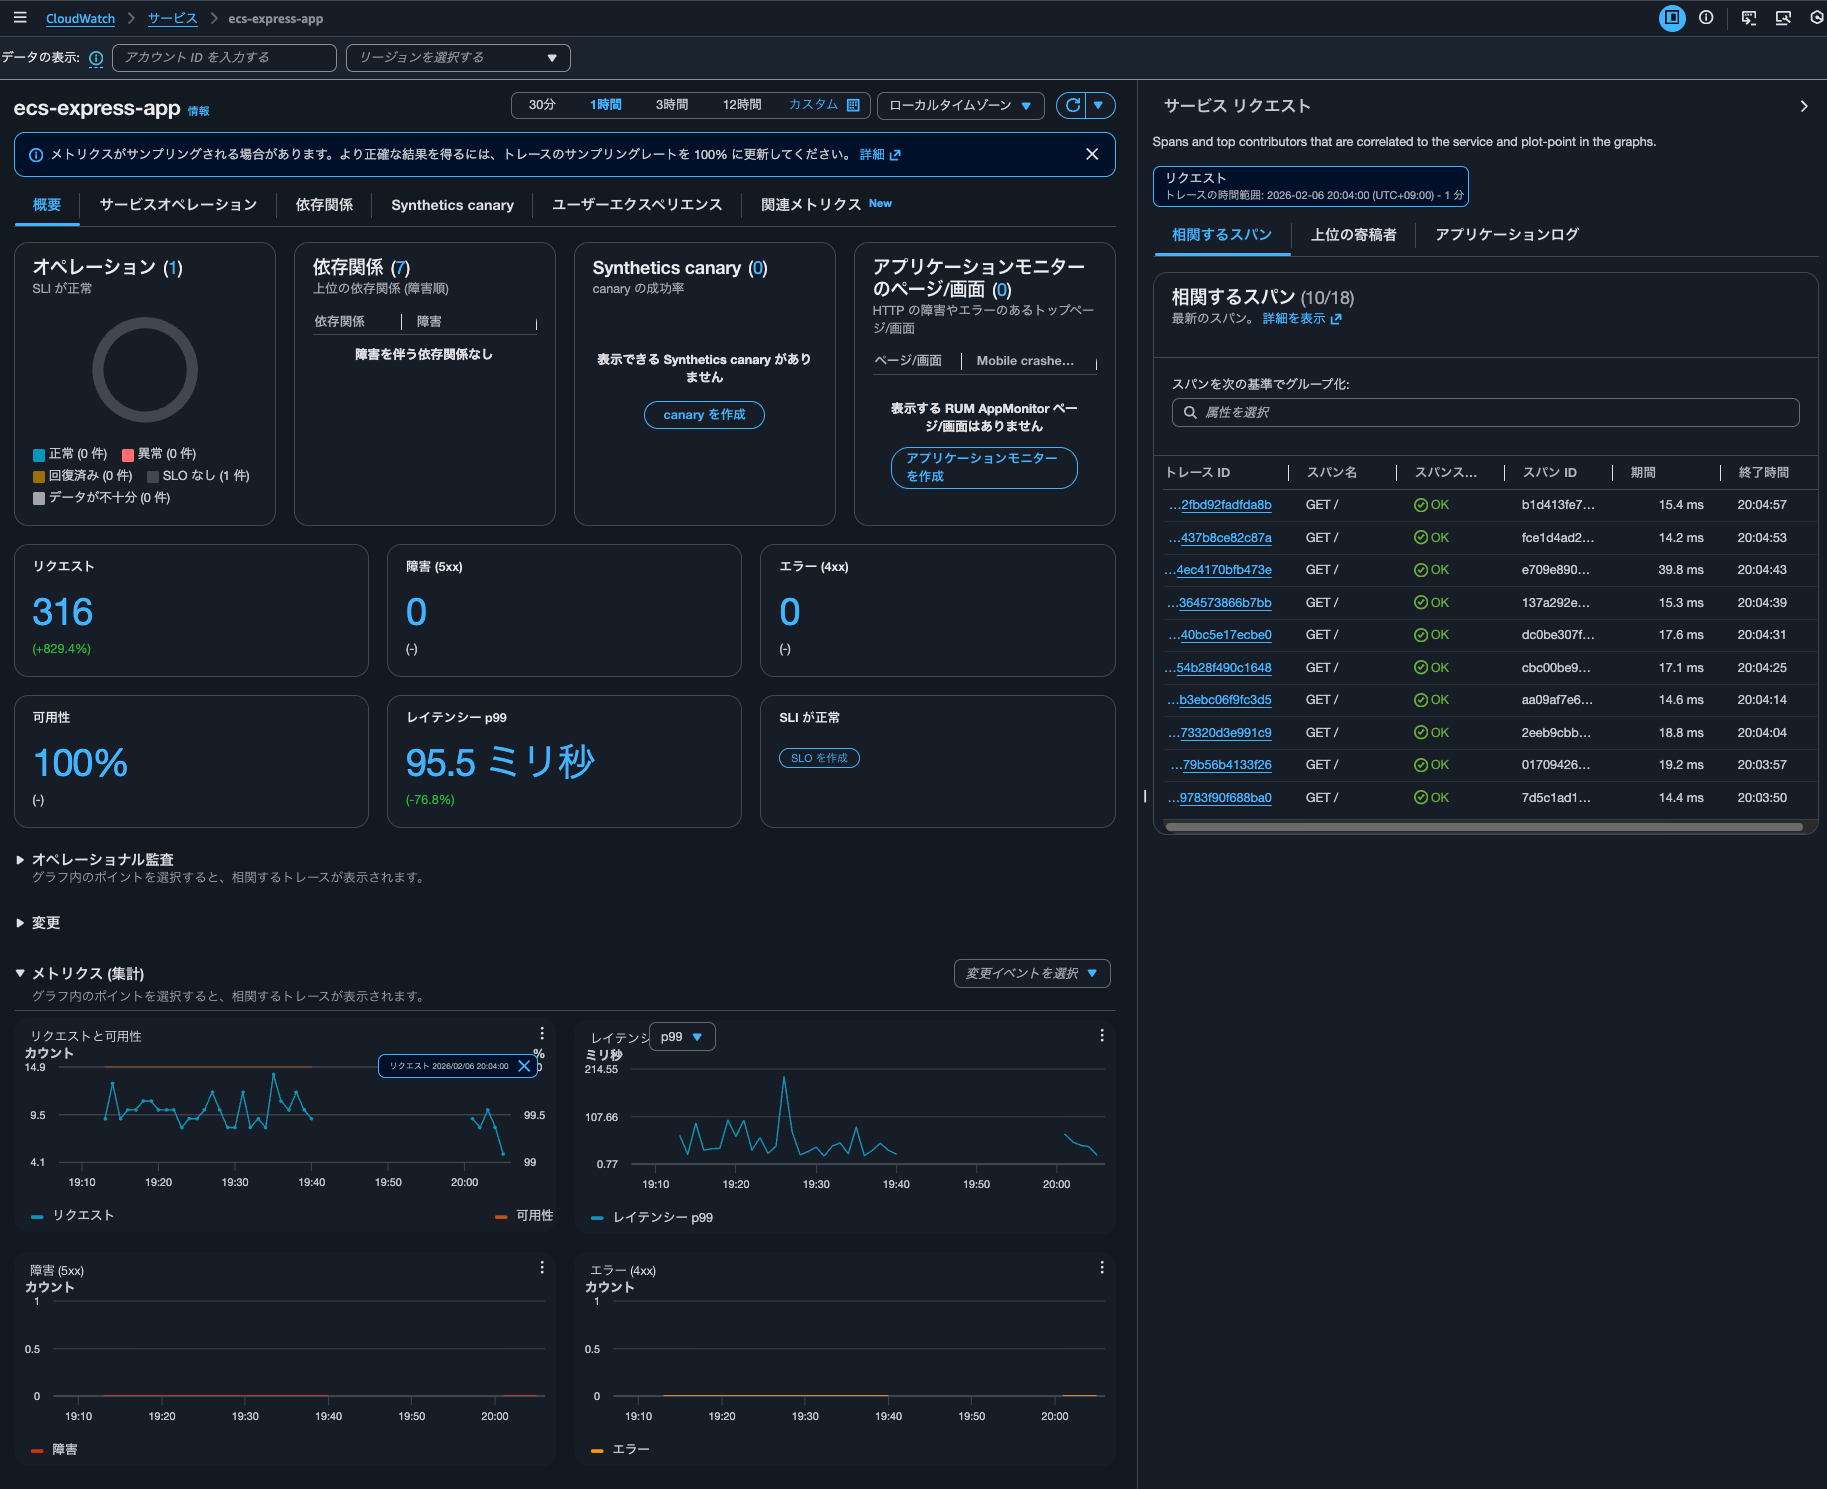
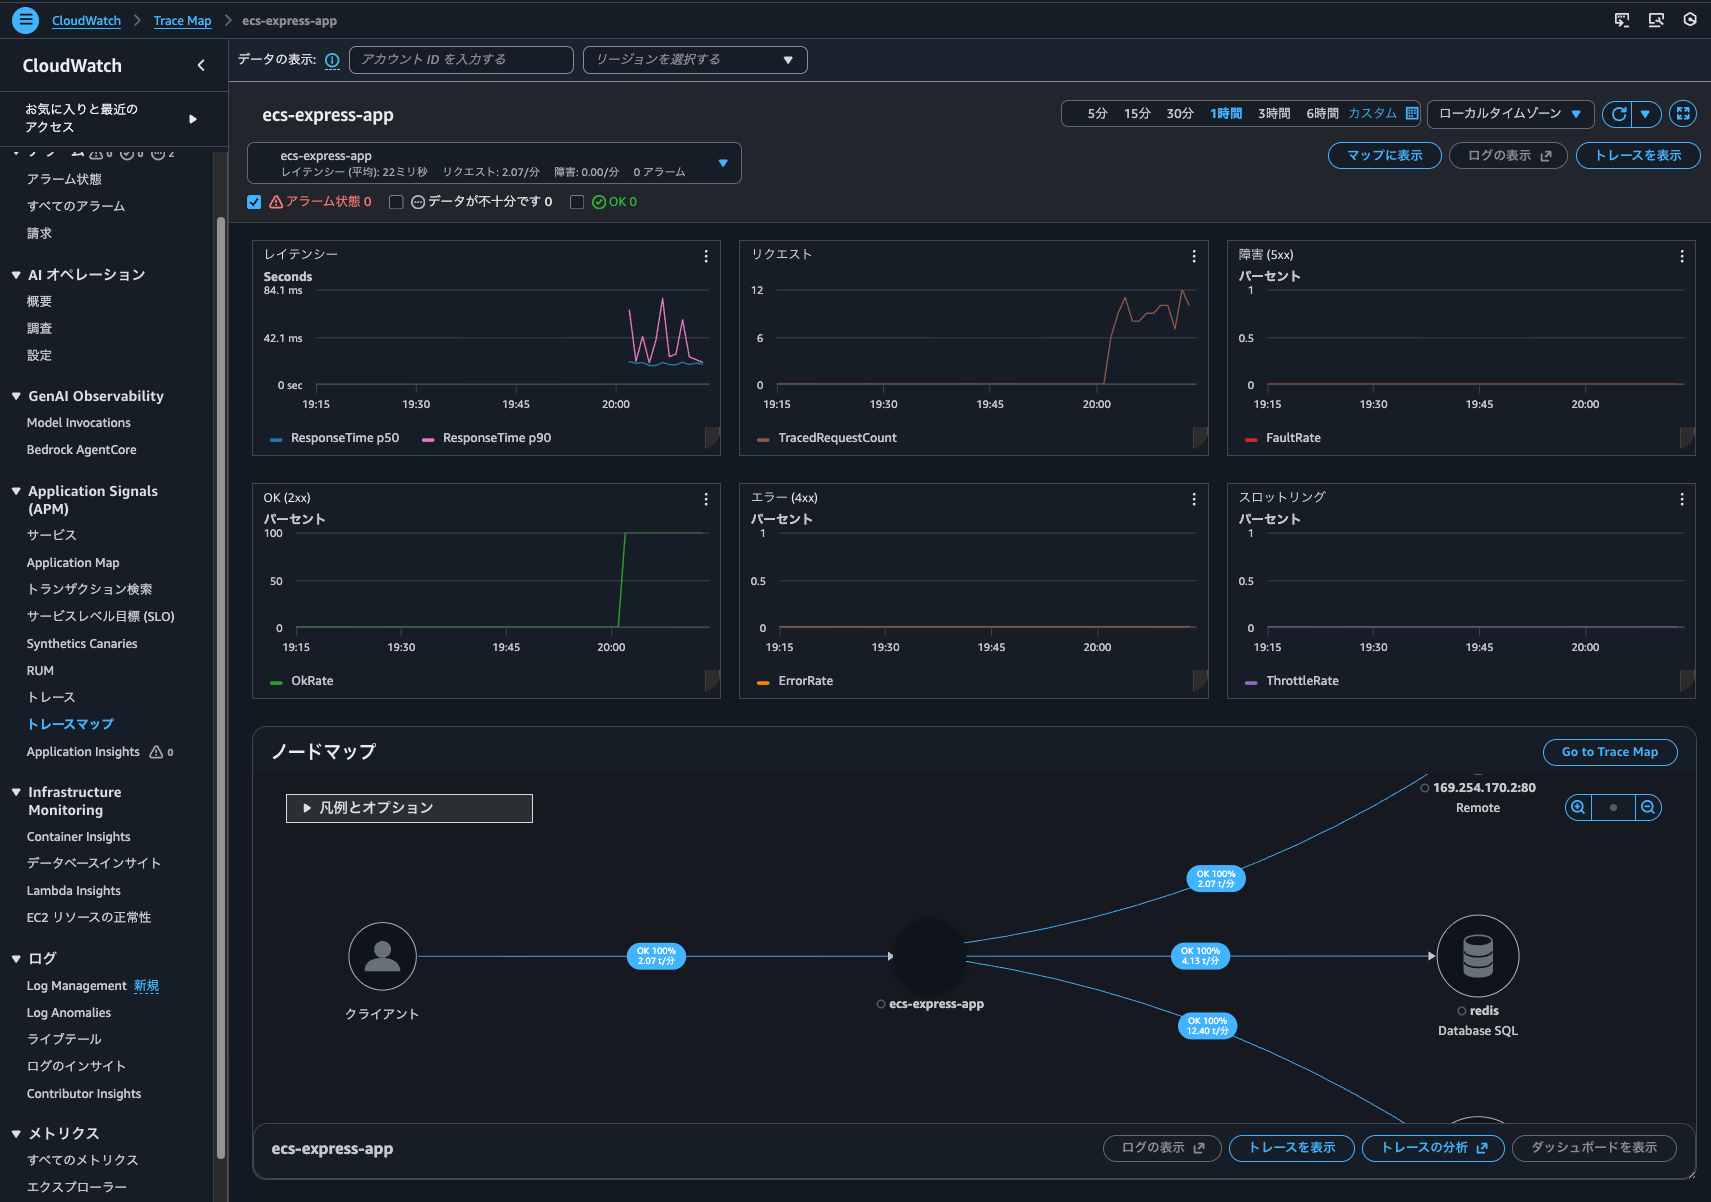
15分ほど待ったのち、Application Signalsでサービスのメトリクスを確認します。
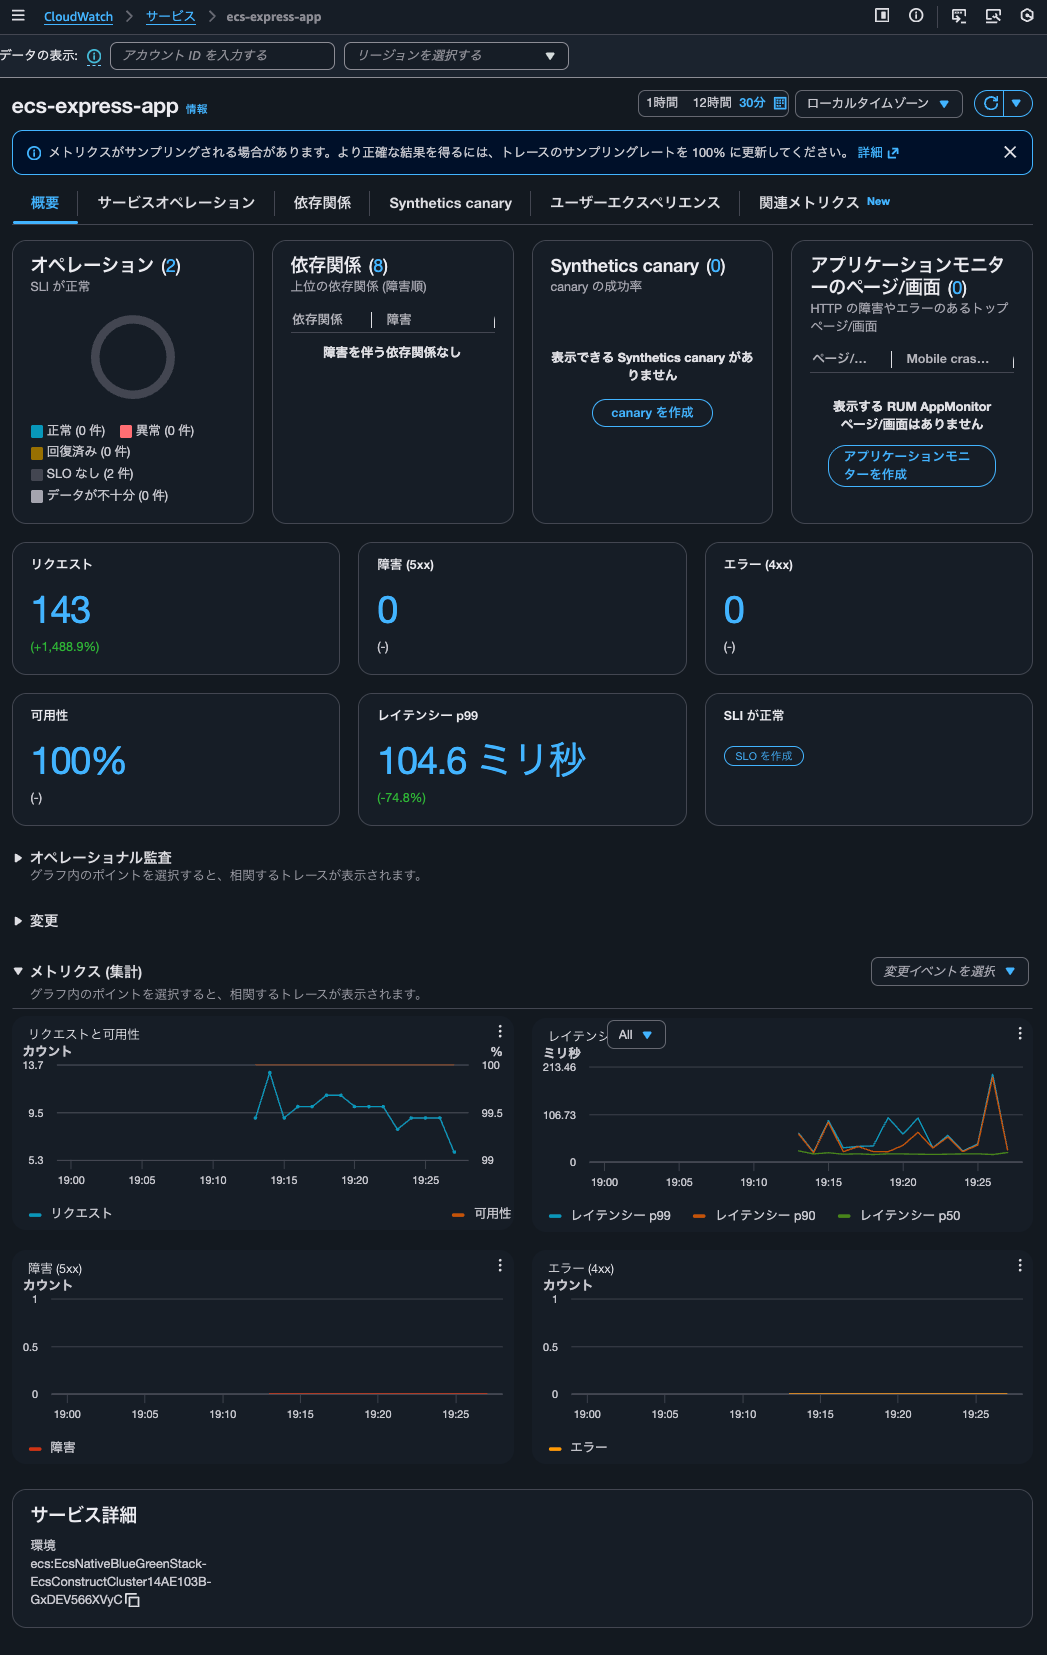
正しくカウントされていますね。
アクセス時のレスポンスには以下のようにアクセス回数が記録されているのですが、一致していました。
{"message":"Hello from Express App with Session!","version":"2.0.0","timestamp":"2026-02-06T10:13:05.848Z","taskId":"d66493dfc651492fbff67623020a0600","session":{"sessionId":"aX7rWfB1xPBLsaWzLDrawnC1ojmkm11P","views":1,"firstVisit":"2026-02-06T10:13:05.793Z","lastVisit":"2026-02-06T10:13:05.793Z"},"database":{"totalSiteVisits":10,"currentVisitId":10,"recentVisits":[{"id":10,"path":"/","createdAt":"2026-02-06T10:13:05.794Z"}]}}
つまりはTrace indexing rateの設定値はApplication Signalsのメトリクスの計算には影響を与えないようです。
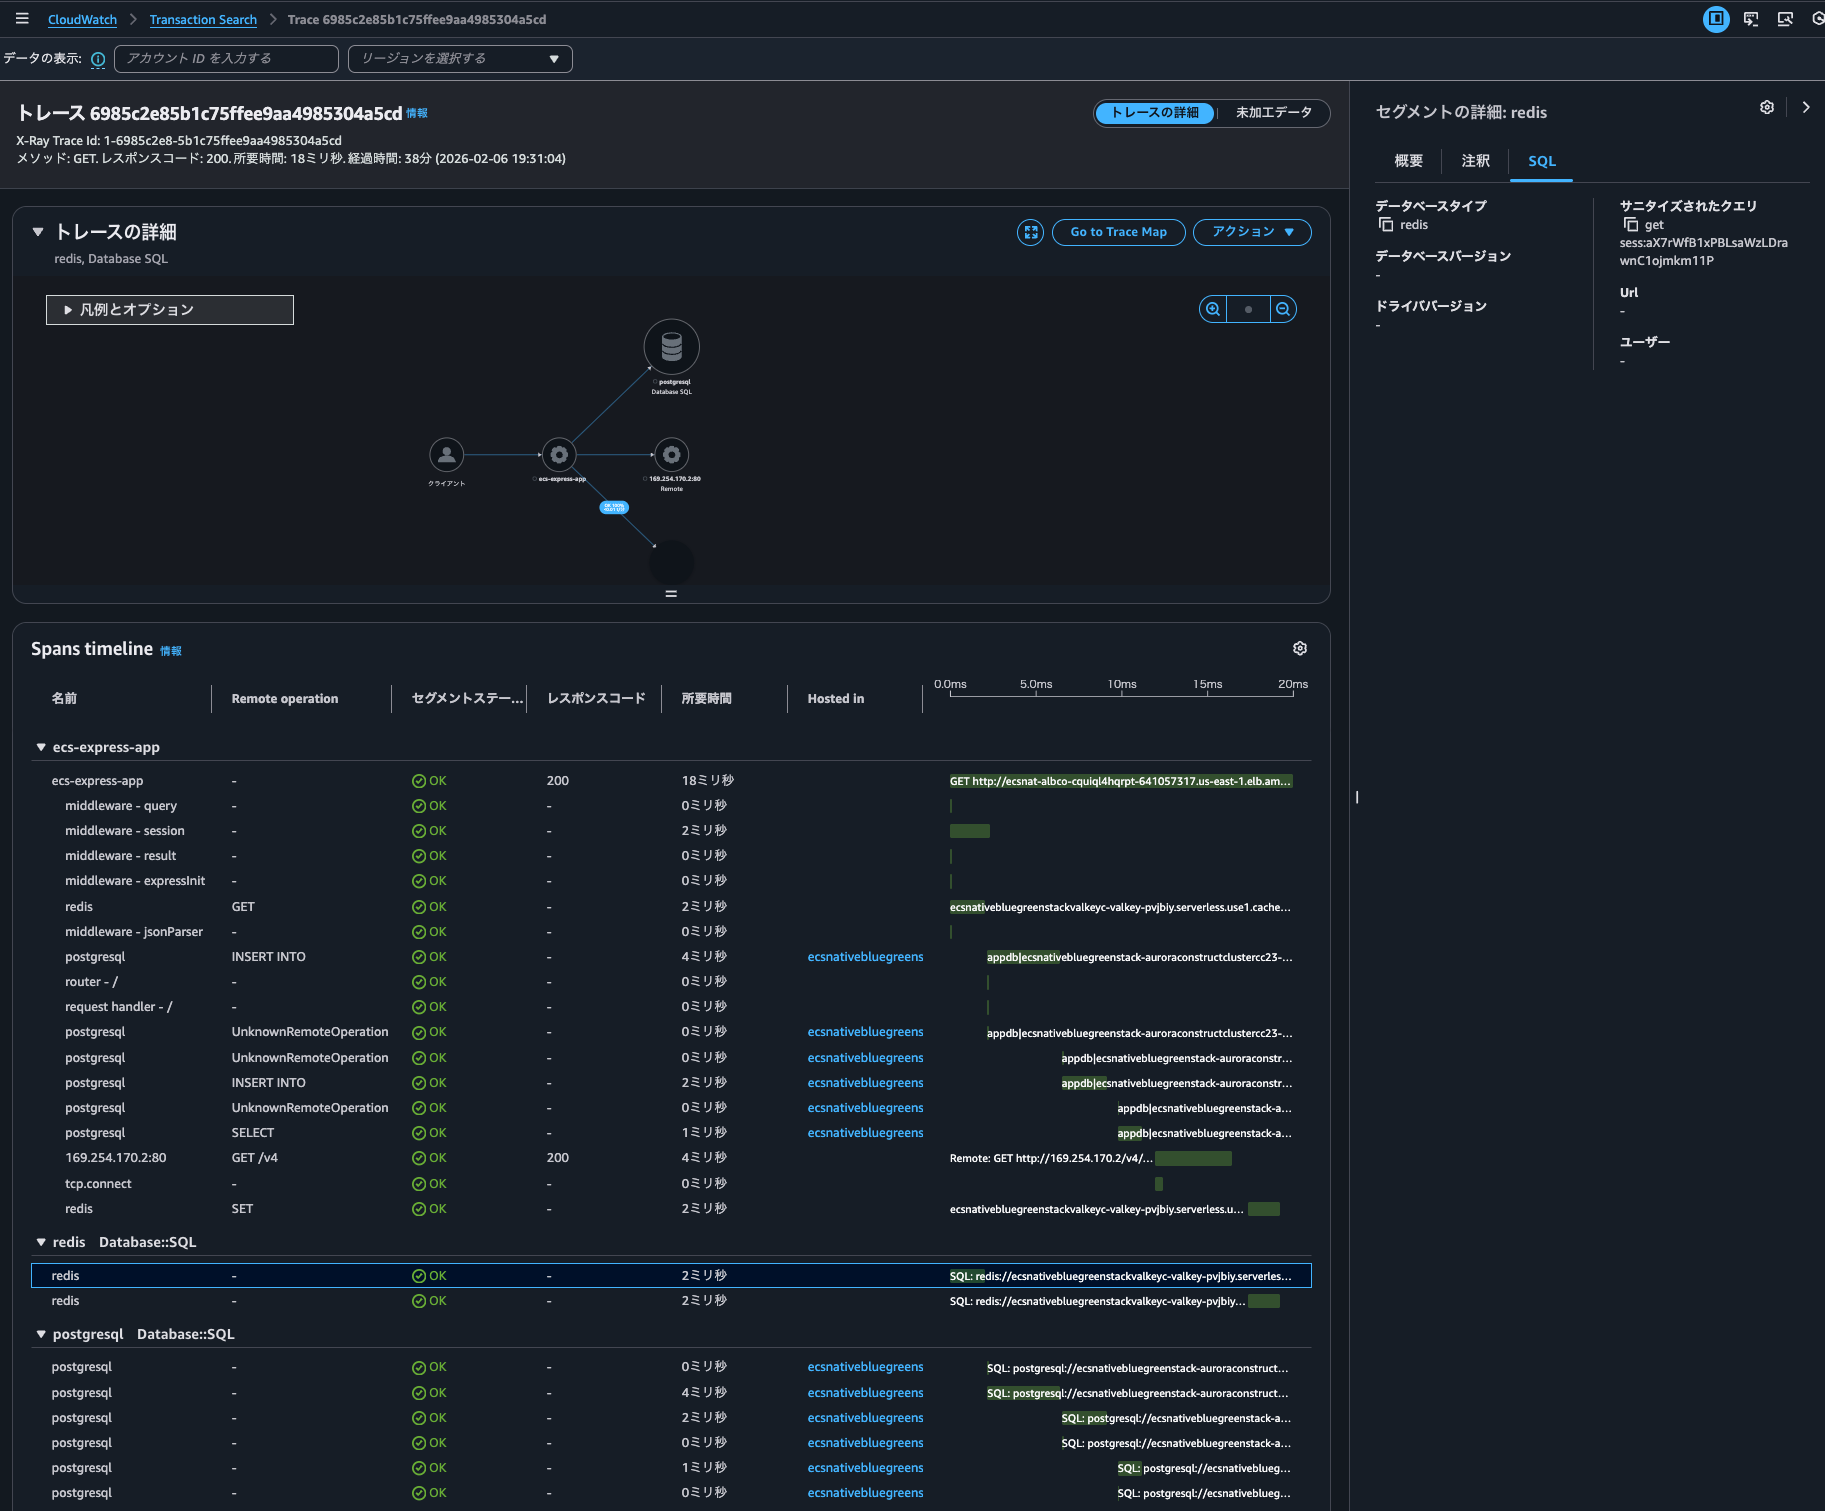
グラフをクリックすると、クリックした日時の該当トレースも表示されました。
トレースの詳細も確認できます。CloudWatch > Transaction Searchと裏側ではTransaction Searchが使われているようです。
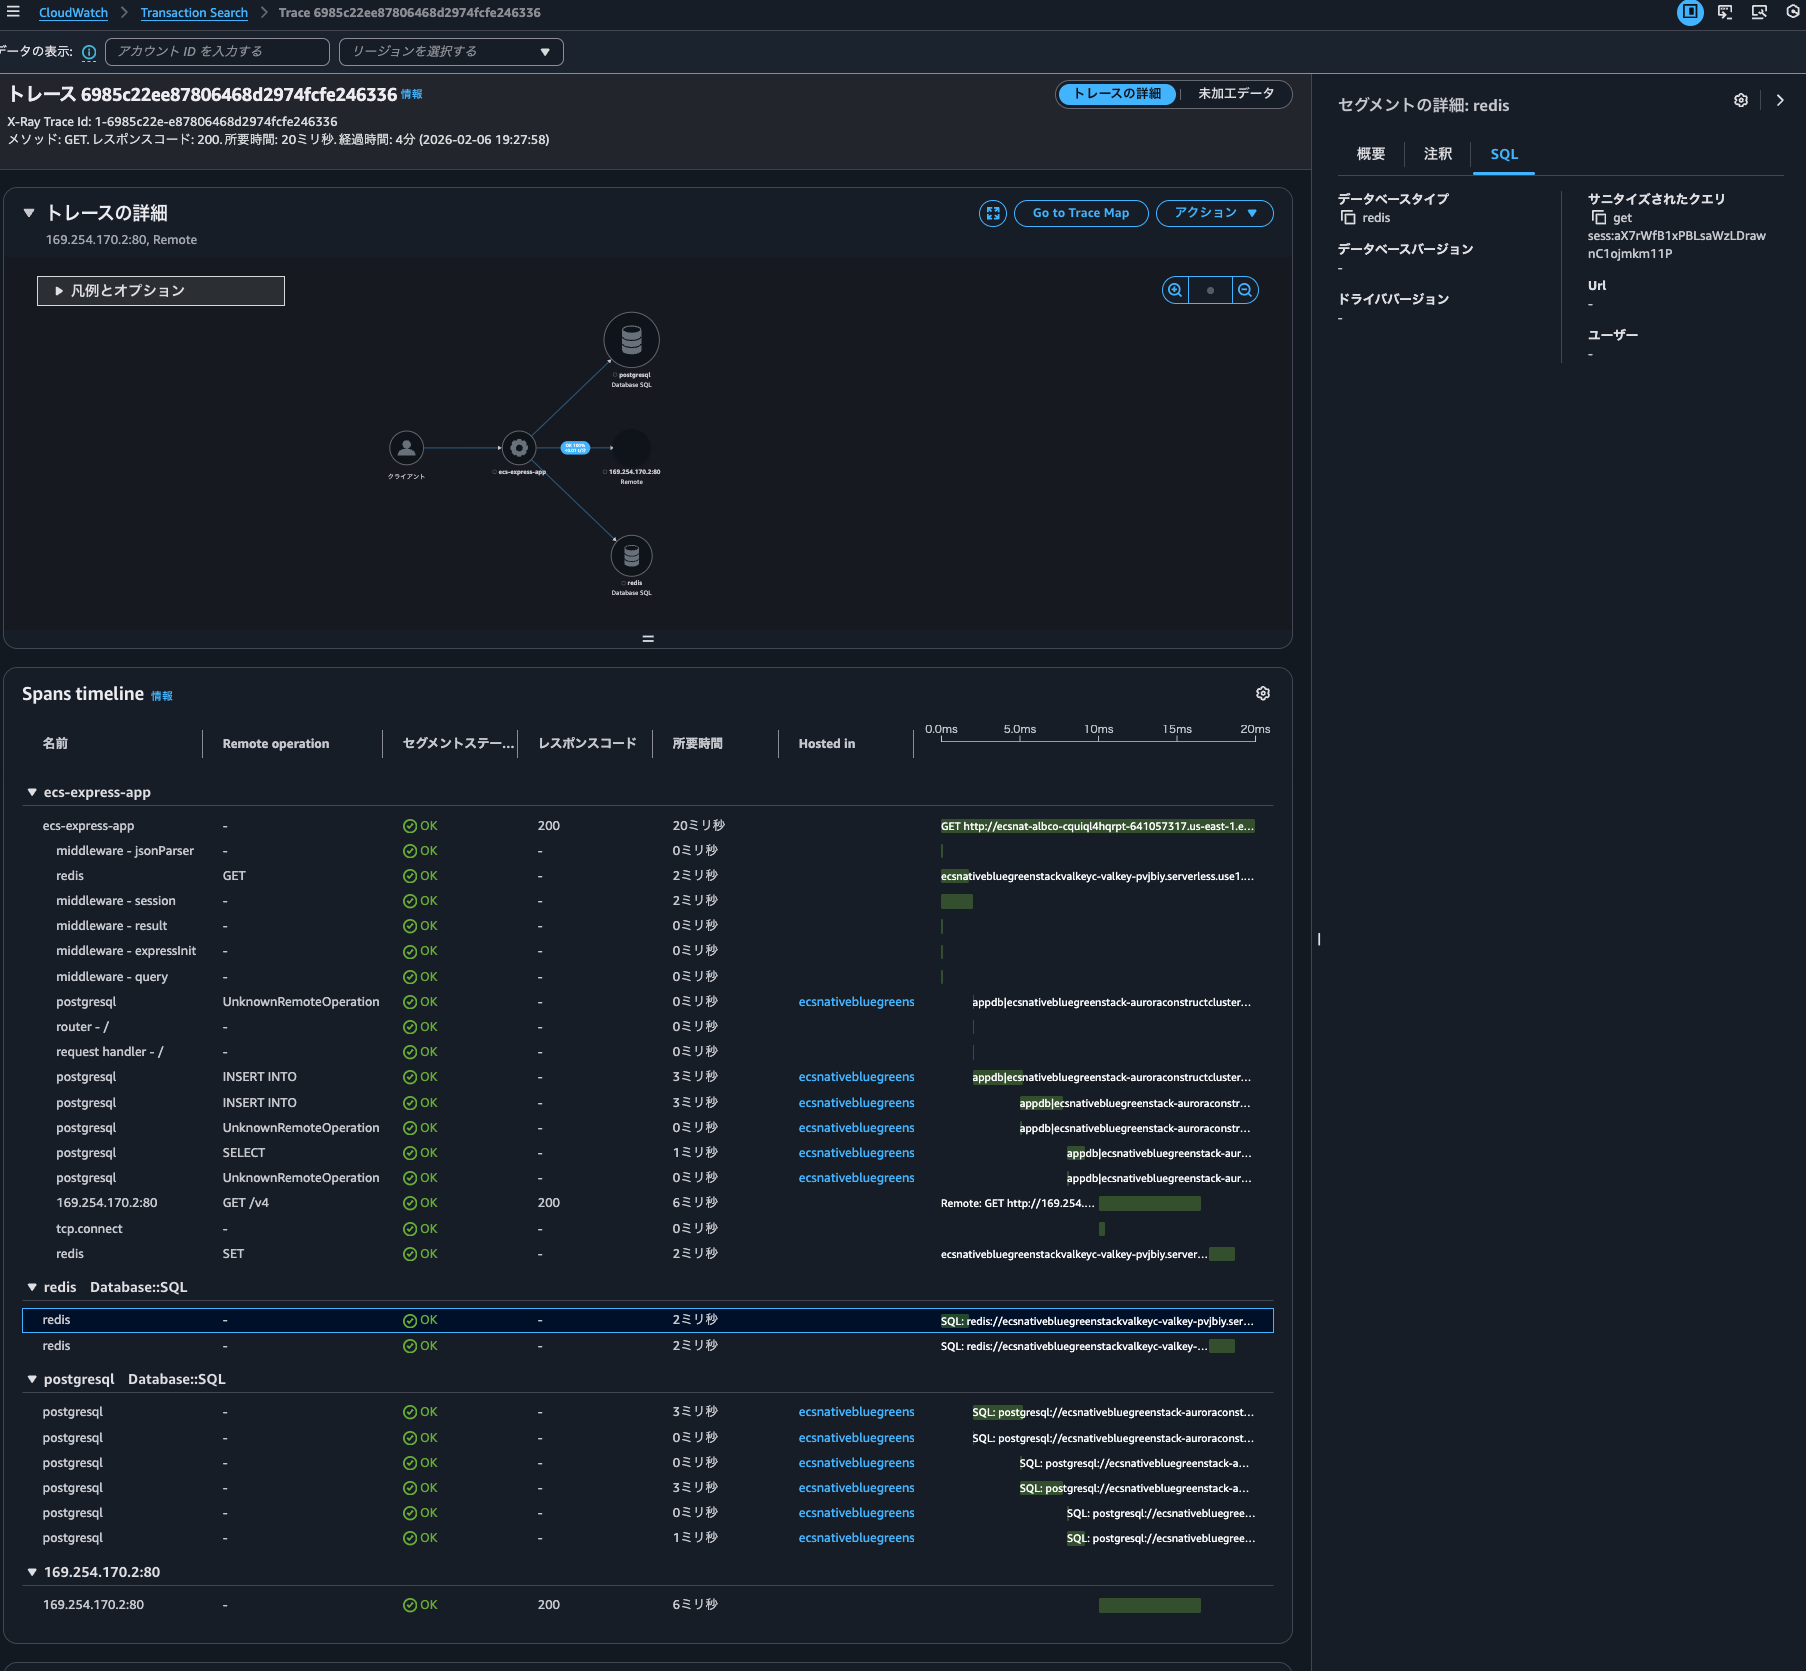
Transaction Searchの機能を使うにあたってはトレースのインデックスは不要ということのなのでしょうか。ちなみに未加工データで表示されるJSONを確認しましたが、インデックスされているかどうかを表すフィールドはありませんでした。
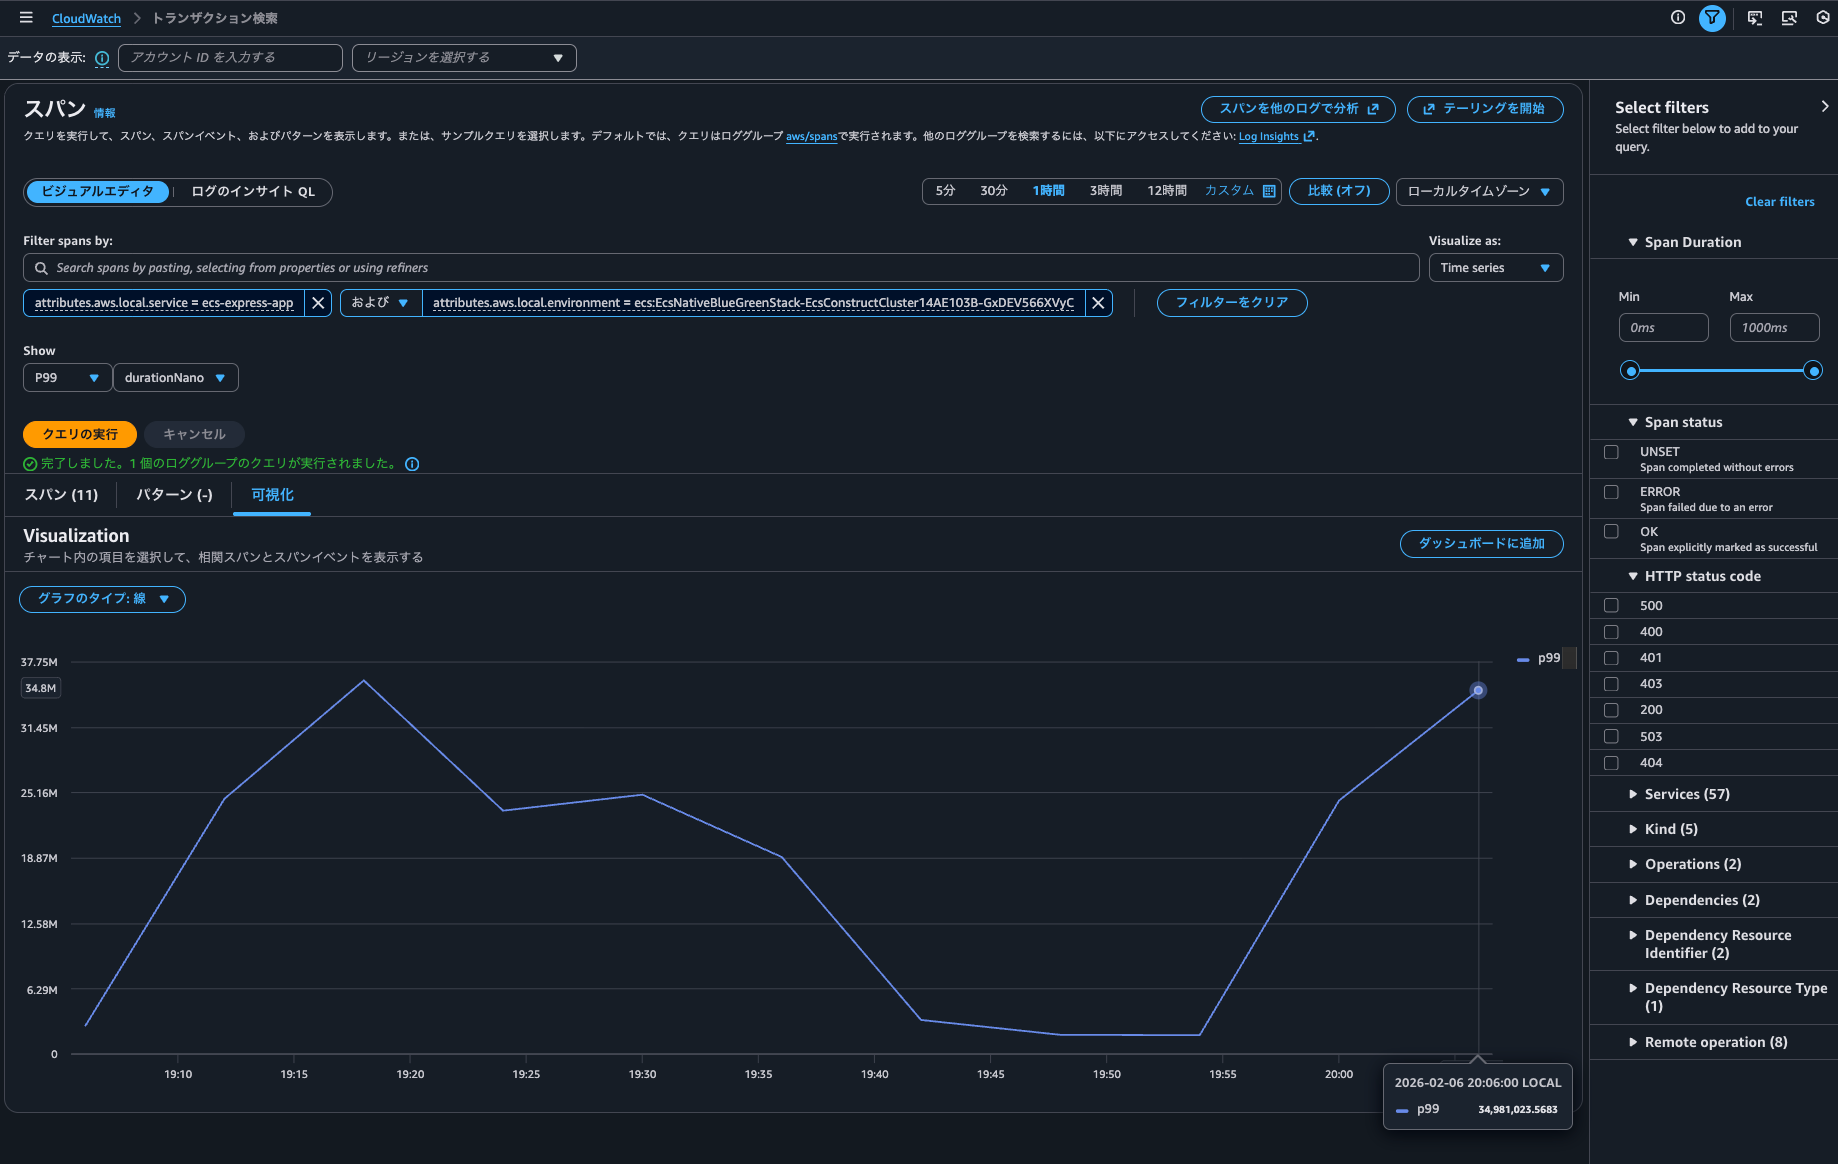
Transaction Searchでecs-express-appサービスのスパンを検索してみましょう。
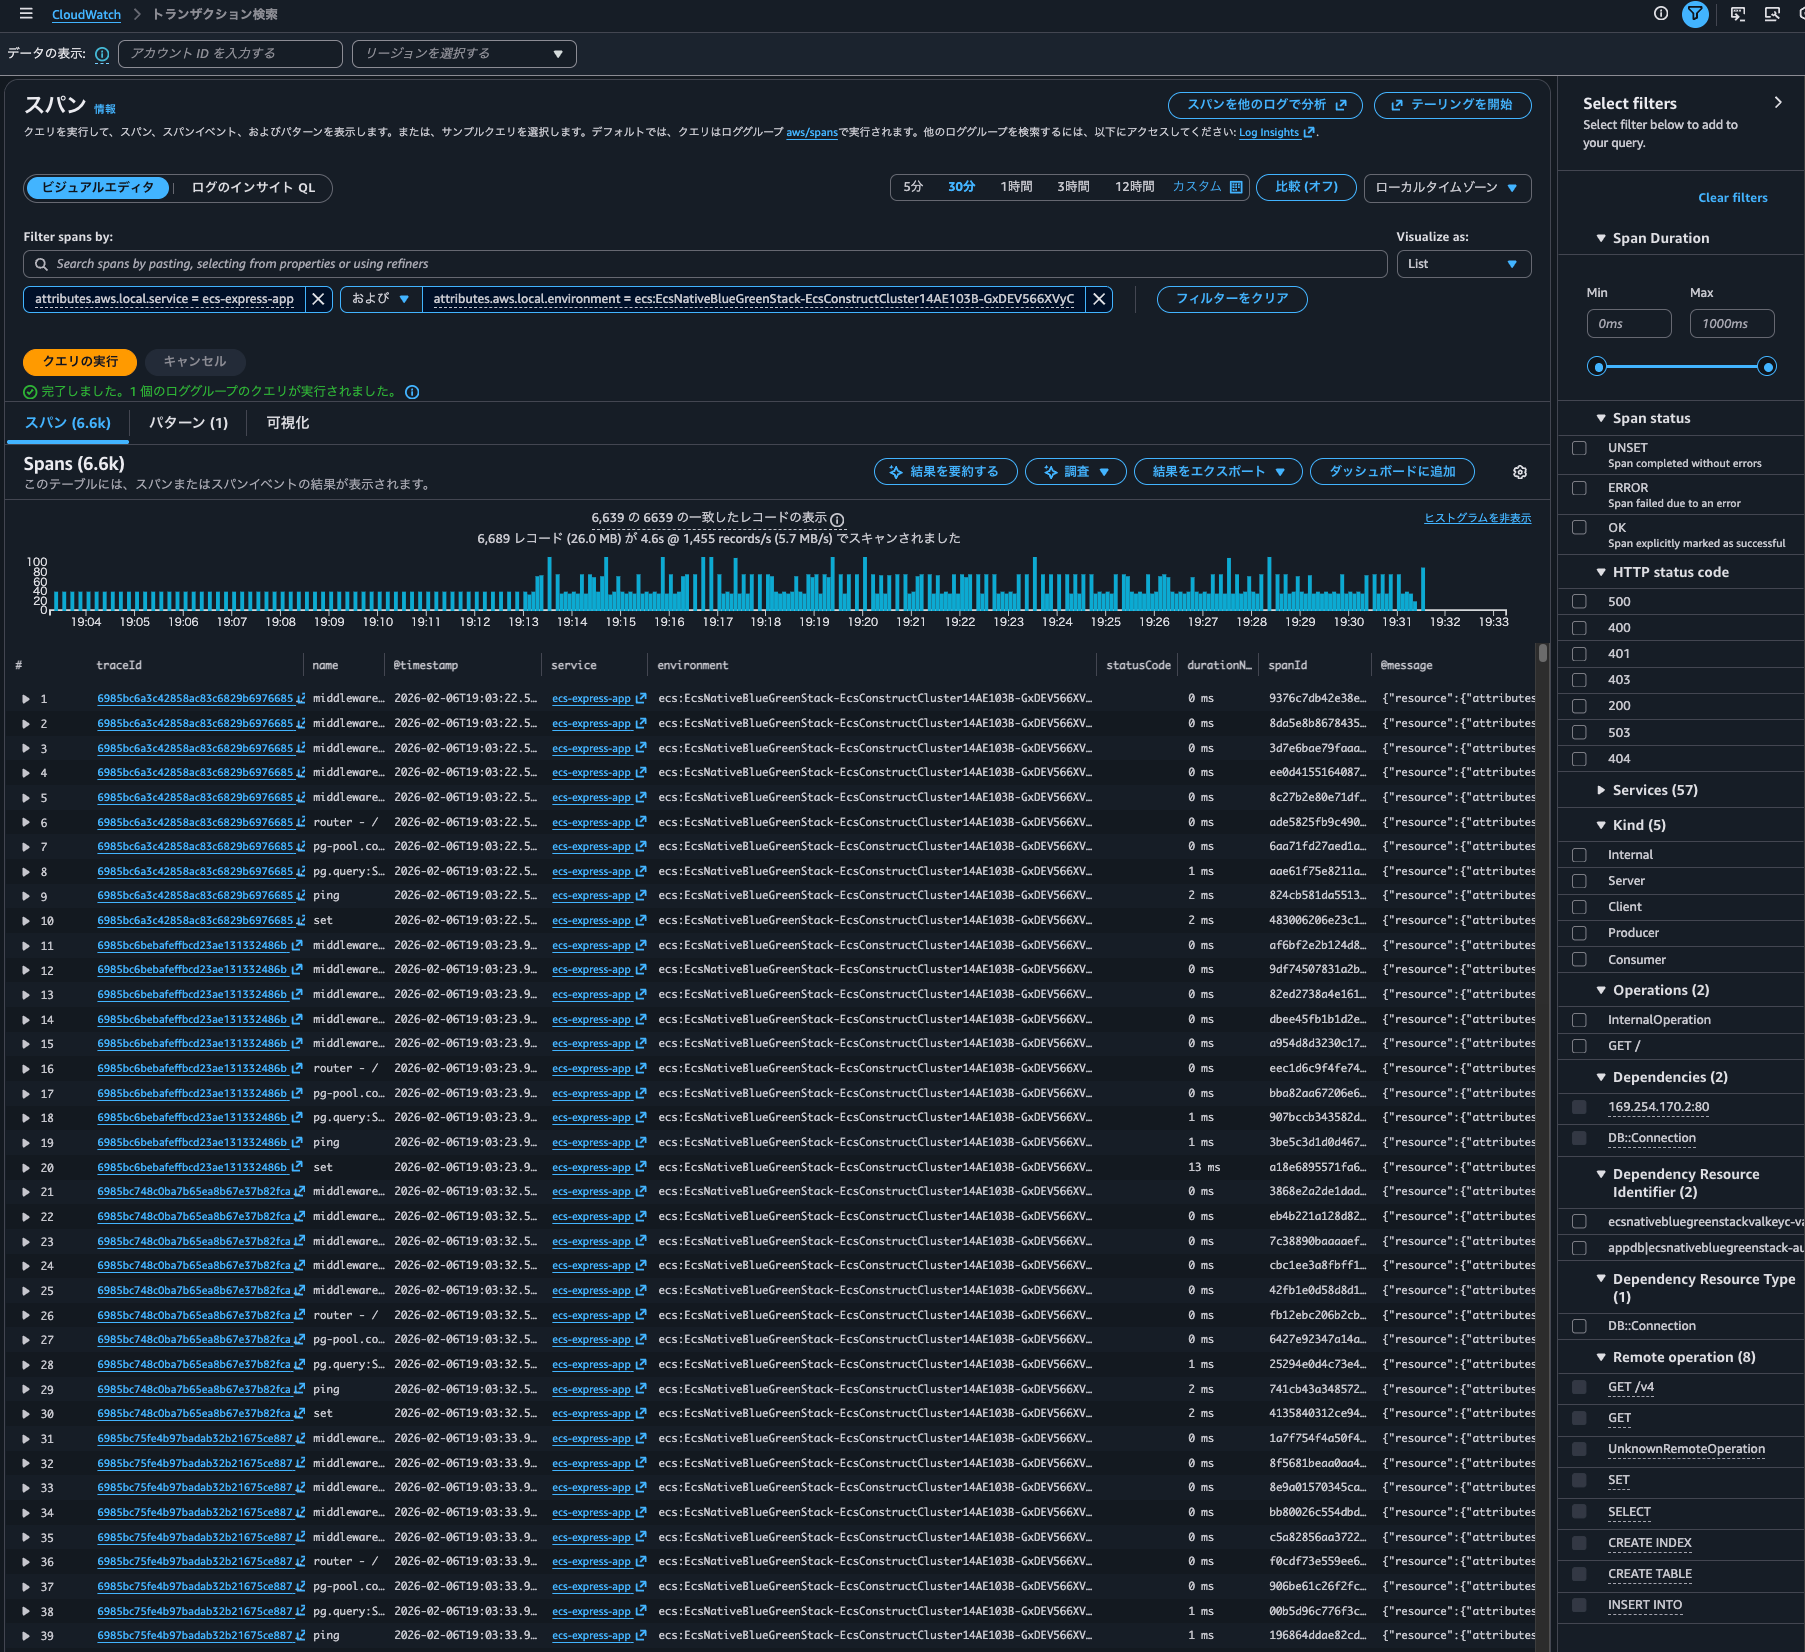
問題なく表示されました。
Time seriesも表示できます。
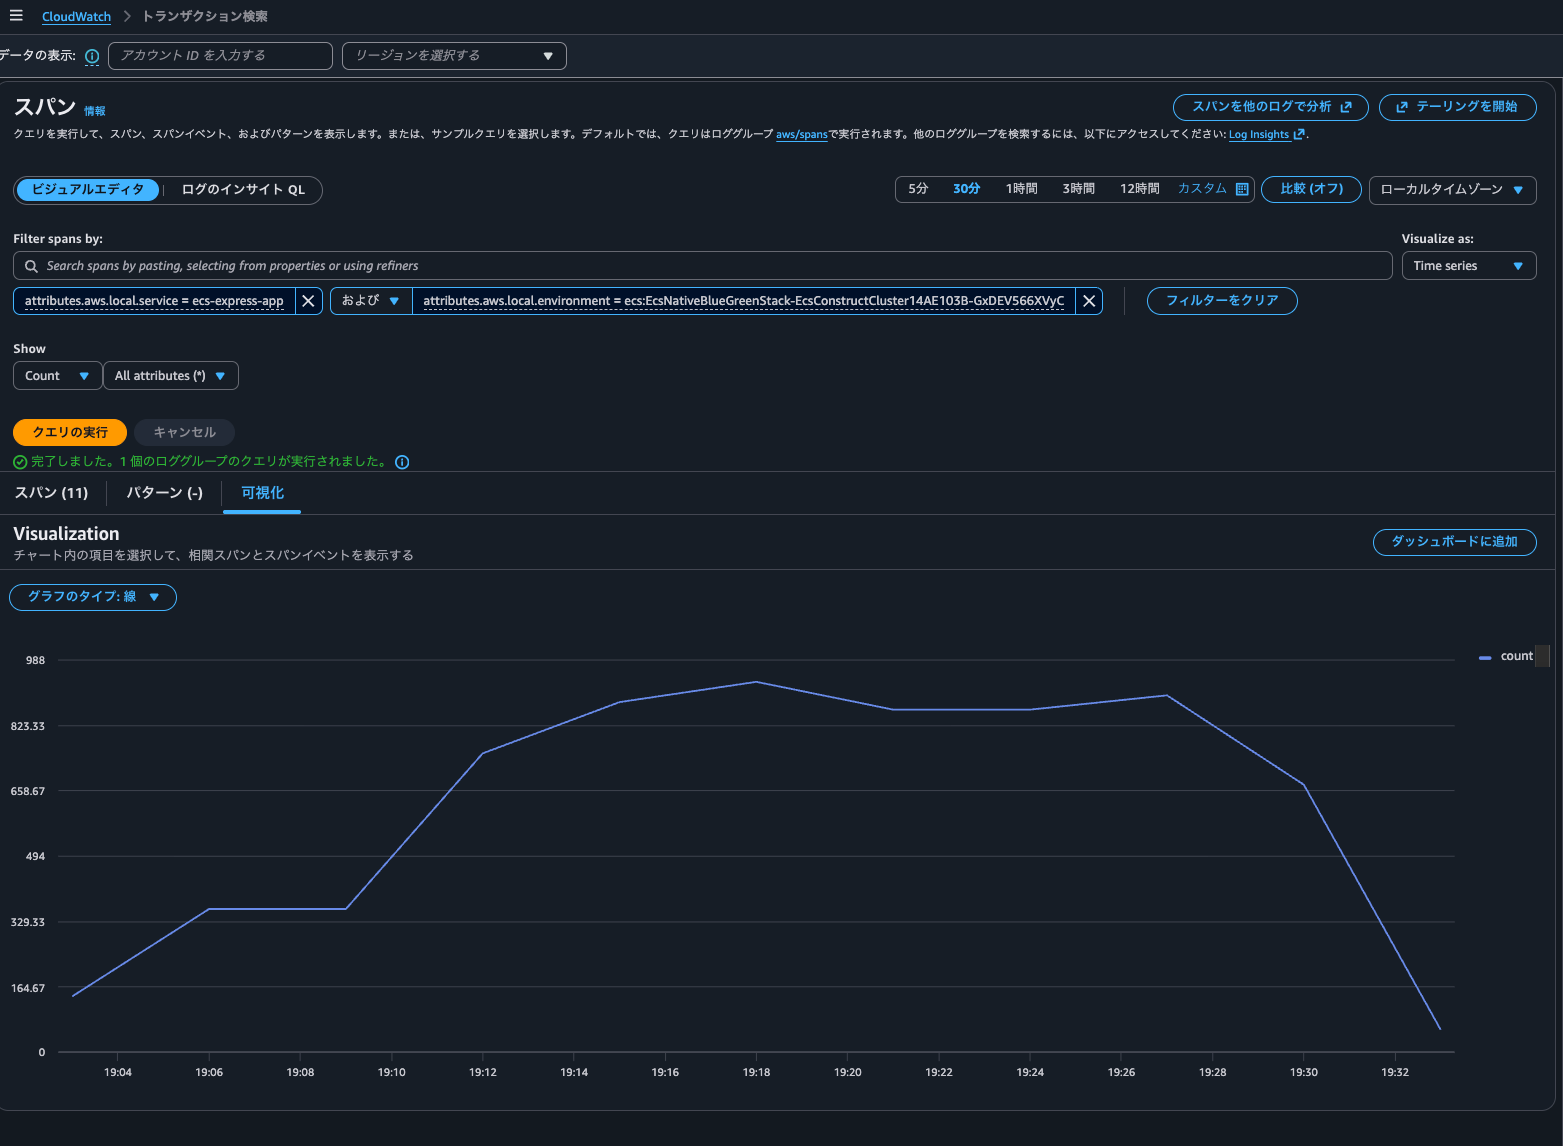
Trace indexing rateはTransaction Searchのクエリに特に影響を与えなさそうです。
Transaction Searchのコンソールでクエリ実行した際にどのようなAPIが叩かれたのかを確認すると、以下のようにCloudWatch LogsのStartQuery API = Logs Insightsaws/spansロググループへが実行されていました。
{
    "eventVersion": "1.11",
    "userIdentity": {
        "type": "AssumedRole",
        "principalId": "<プリンシパルID>",
        "arn": "arn:aws:sts::<AWSアカウントID>:assumed-role/<IAMロール名>/<セッション名>",
        "accountId": "<AWSアカウントID>",
        "accessKeyId": "<アクセスキー>",
        "sessionContext": {
            "sessionIssuer": {
                "type": "Role",
                "principalId": "<プリンシパルID>",
                "arn": "arn:aws:iam::<AWSアカウントID>:role/<IAMロール名>",
                "accountId": "<AWSアカウントID>",
                "userName": "<IAMユーザー名>"
            },
            "attributes": {
                "creationDate": "2026-02-07T08:32:00Z",
                "mfaAuthenticated": "true"
            }
        }
    },
    "eventTime": "2026-02-07T08:56:34Z",
    "eventSource": "logs.amazonaws.com",
    "eventName": "StartQuery",
    "awsRegion": "us-east-1",
    "sourceIPAddress": "<送信元IPアドレス>",
    "userAgent": "Mozilla/5.0 (Macintosh; Intel Mac OS X 10_15_7) AppleWebKit/537.36 (KHTML, like Gecko) Chrome/144.0.0.0 Safari/537.36",
    "requestParameters": {
        "startTime": 1770450993,
        "endTime": 1770454593,
        "queryString": "SOURCE logGroups(namePrefix: [\"aws/spans\"], class: \"STANDARD\") START=-3600s END=0s |\nFIELDS traceId,name,@timestamp,attributes.aws.local.service as service,attributes.aws.local.environment as environment,attributes.http.response.status_code as statusCode,durationNano,spanId,@message,@log as accountId\n| SORT @timestamp ASC\n| LIMIT 10000",
        "dryRun": false
    },
    "responseElements": null,
    "additionalEventData": {
        "queryId": "a3ef5ee4-41a9-41ab-9fc8-b90ba5670ea9"
    },
    "requestID": "1182ee24-5b75-468d-b154-ecc35a60e624",
    "eventID": "d24010f9-1525-4296-83e2-076a49baa4a3",
    "readOnly": true,
    "eventType": "AwsApiCall",
    "apiVersion": "20140328",
    "managementEvent": true,
    "recipientAccountId": "<AWSアカウントID>",
    "eventCategory": "Management",
    "tlsDetails": {
        "tlsVersion": "TLSv1.3",
        "cipherSuite": "TLS_AES_128_GCM_SHA256",
        "clientProvidedHostHeader": "logs.us-east-1.amazonaws.com"
    },
    "sessionCredentialFromConsole": "true"
}
Logs Insightsが動作しているため、インデックスが張られていなくとも相関スパンを抽出できるということですね。
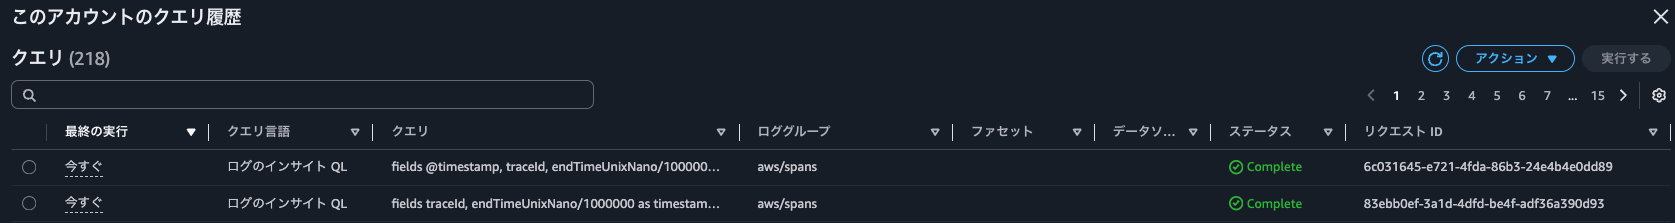
サービスでグラフをクリックし相関スパン表示した後に、Logs Insightsのクエリ実行履歴を確認すると以下2つのクエリが実行されていました。
fields traceId, endTimeUnixNano/1000000 as timestamp, spanId, name, coalesce(attributes.http.response.status_code, attributes.http.status_code, status.code) as statusCode, durationNano/1000000 as duration
| filter attributes.aws.local.service="ecs-express-app" and attributes.aws.local.environment = "ecs:EcsNativeBlueGreenStack-EcsConstructCluster14AE103B-GxDEV566XVyC"  and not ispresent(attributes.aws.remote.service) and (attributes.aws.span.kind = "LOCAL_ROOT" or kind = "SERVER")  #no-attribute-selected
| stats count(*) as count
fields @timestamp, traceId, endTimeUnixNano/1000000 as timestamp, spanId, name, coalesce(attributes.http.response.status_code, attributes.http.status_code, status.code) as statusCode, durationNano/1000000 as duration
| filter attributes.aws.local.service="ecs-express-app" and attributes.aws.local.environment = "ecs:EcsNativeBlueGreenStack-EcsConstructCluster14AE103B-GxDEV566XVyC"  and not ispresent(attributes.aws.remote.service) and (attributes.aws.span.kind = "LOCAL_ROOT" or kind = "SERVER")
| limit 10
コスト削減や検索時間を短くするためにフィールドインデックスを貼ってあげると良いでしょう。フィールドインデックスについては以下記事が参考になります。
AWS公式ドキュメントを確認すると、インデックスが張られることによって使用できる機能について以下のように言及がありました。
トレース概要を使用したスパンインデックス作成の設定
トレースの概要はトランザクションのデバッグに役立ち、非同期プロセスに有益です。トレース概要として、スパンのごく一部のみのインデックスを作成する必要があります。
コンソールまたは API でトランザクション検索を有効にするときに、スパンインデックス作成を設定します。トランザクション検索を有効にするには、「トランザクション検索の開始方法」を参照してください。
トレースの概要でロック解除された機能
X-Ray トレースの概要の主な機能は次のとおりです。
- トレースサマリー検索 — トレースサマリーからトレースを検索して見つけます。
- トレースサマリー分析 — トレースデータを解釈します。
- トレースインサイト — トレースデータを分析してアプリケーションの問題を特定します。
実際に試してみましょう。
トレースサマリー検索はマネジメントコンソールのCloudWatch > トレースから行えます。
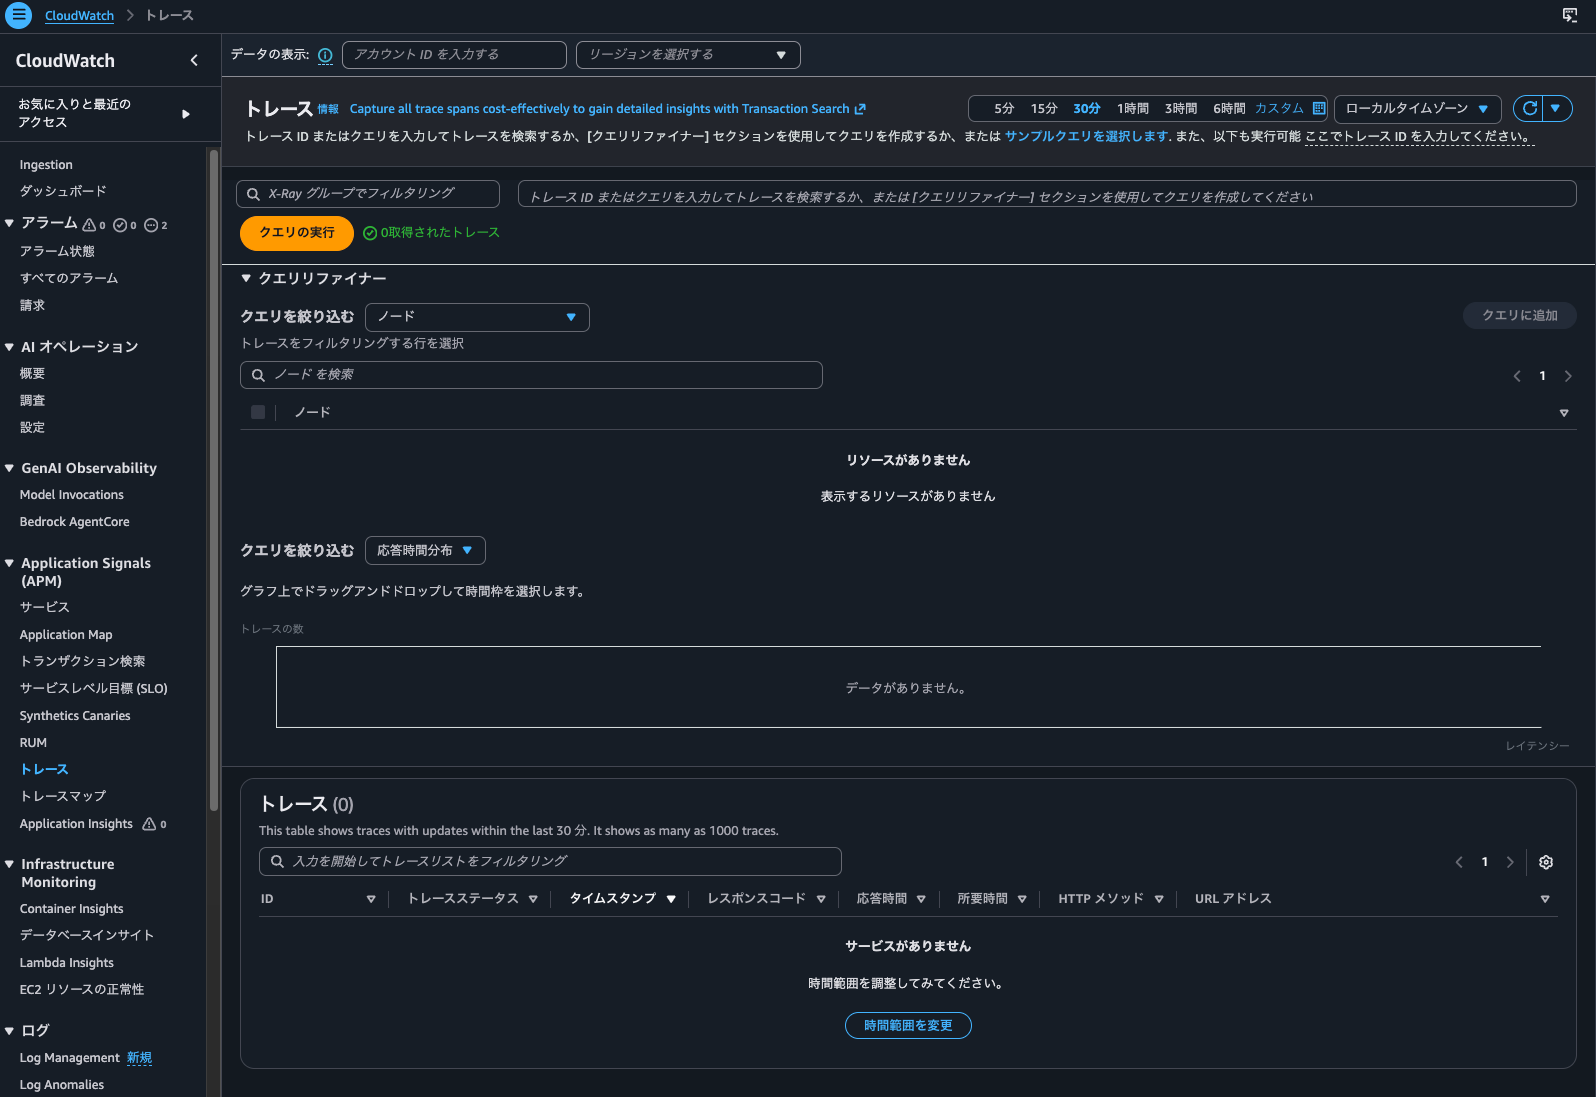
はい、何も表示されません。
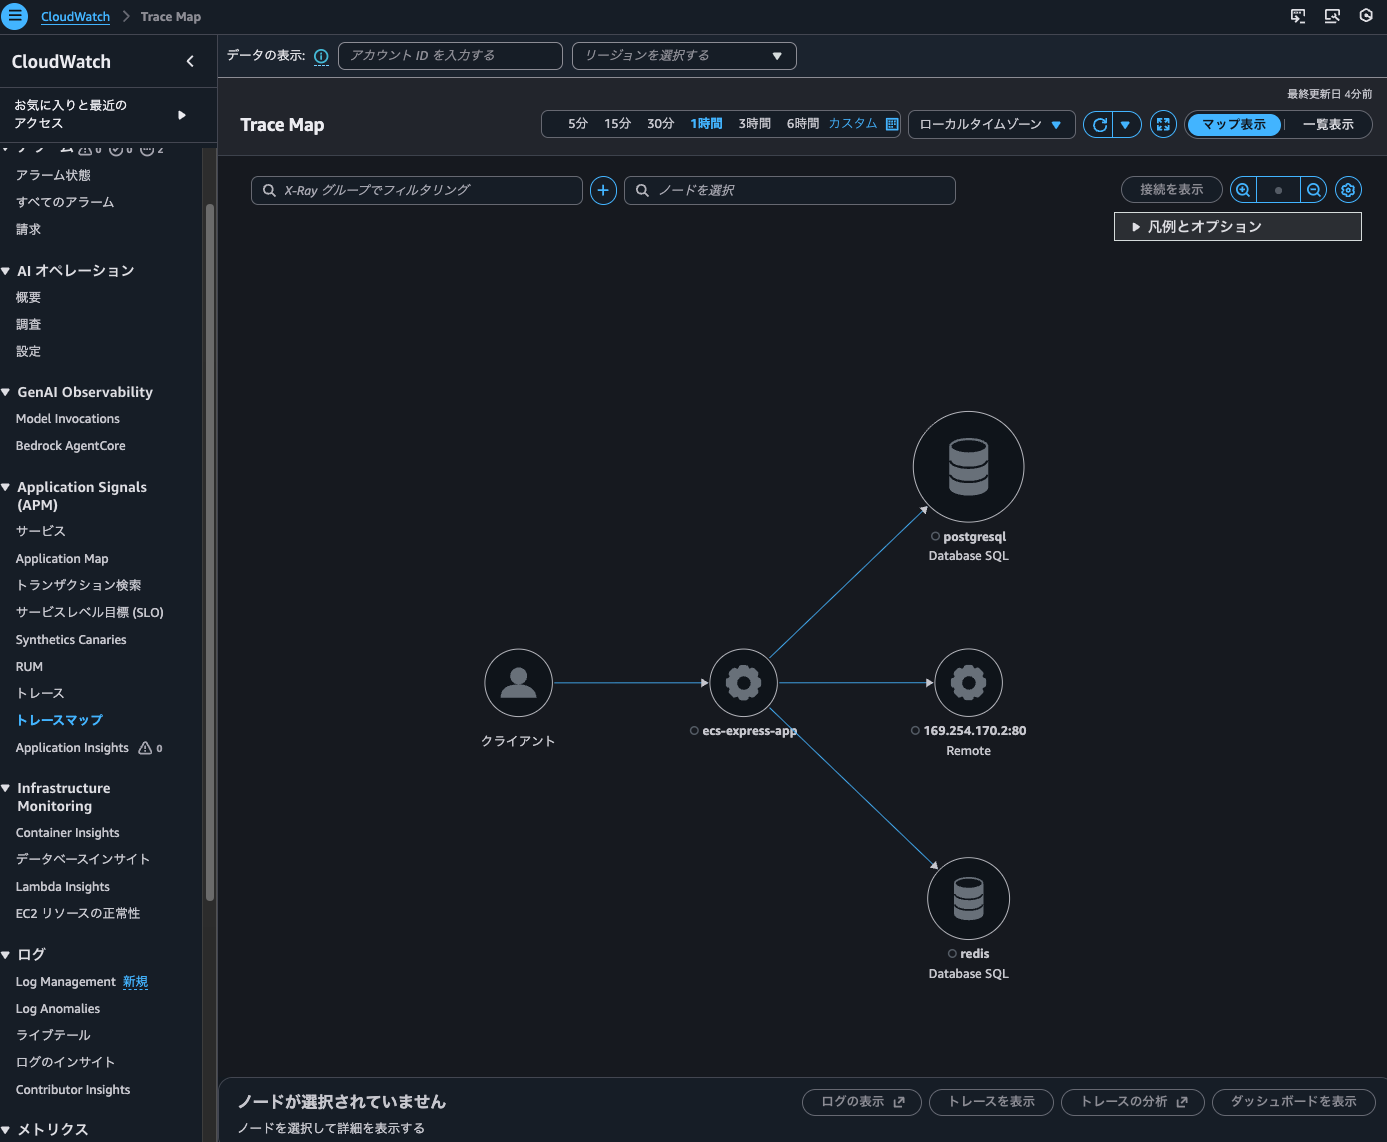
続いて、Trace Mapを確認します。
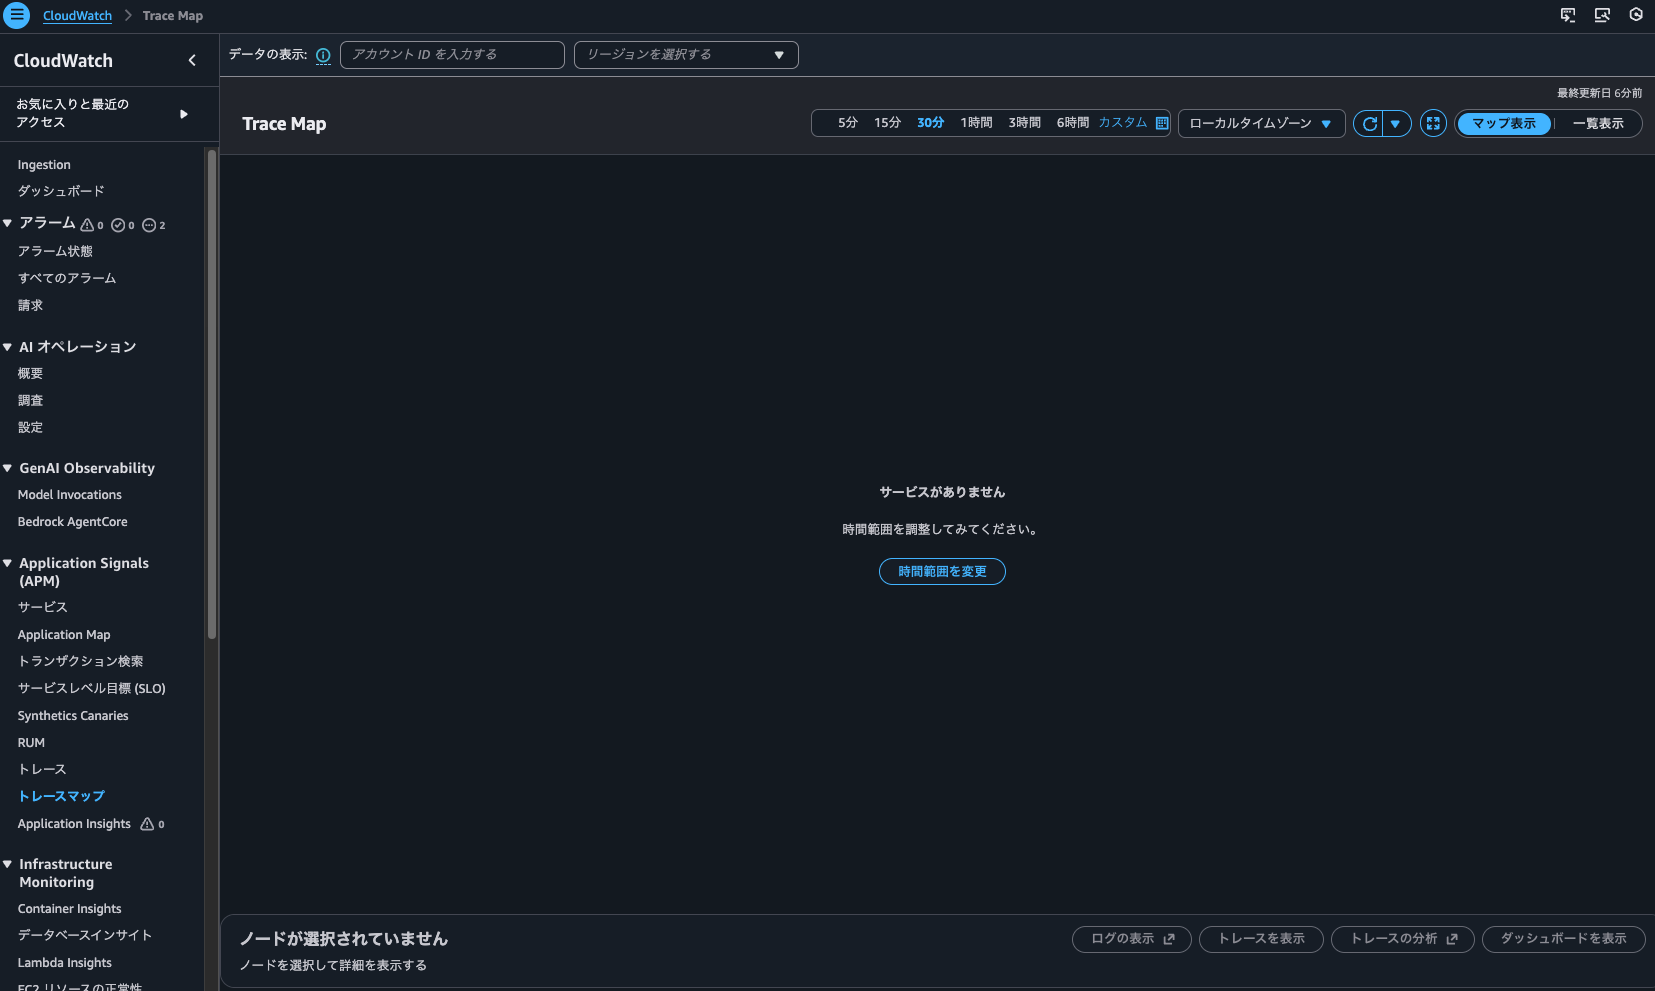
こちらも何も表示されませんでした。
get-trace-summariesによる検索も試しましたが、結果は空でした。
> aws xray get-trace-summaries \
    --start-time 2026-02-06T10:00:00Z \
    --end-time 2026-02-06T11:00:00Z \
    --filter-expression 'service("ecs-express-app")' \
    --region us-east-1
{
    "TraceSummaries": [],
    "TracesProcessedCount": 0,
    "ApproximateTime": "2026-02-06T20:00:00+09:00"
}
ということで、インデックスが張られていないトレースはTrace MapやTransaction Searchを使わないトレースの検索はできないようです。
ちなみに最終的には278回アクセスしていました。
Trace indexing rateが100%の場合
続いて、Trace indexing rateが100%の場合です。
AWS CLIでも確認します。
> aws xray get-trace-segment-destination
{
    "Destination": "CloudWatchLogs",
    "Status": "ACTIVE"
}

> aws xray get-indexing-rules
{
    "IndexingRules": [
        {
            "Name": "Default",
            "ModifiedAt": "2026-02-06T19:44:58+09:00",
            "Rule": {
                "Probabilistic": {
                    "DesiredSamplingPercentage": 100.0
                }
            }
        }
    ]
}
先ほどと同じように数十分間アクセスし続けます。
再開後、Application Signalsのサービスを確認すると、メトリクスも記録されていまいした。
トレースの確認できました。
Transaction Searchにて、トレースのTime seriesも描画できました。
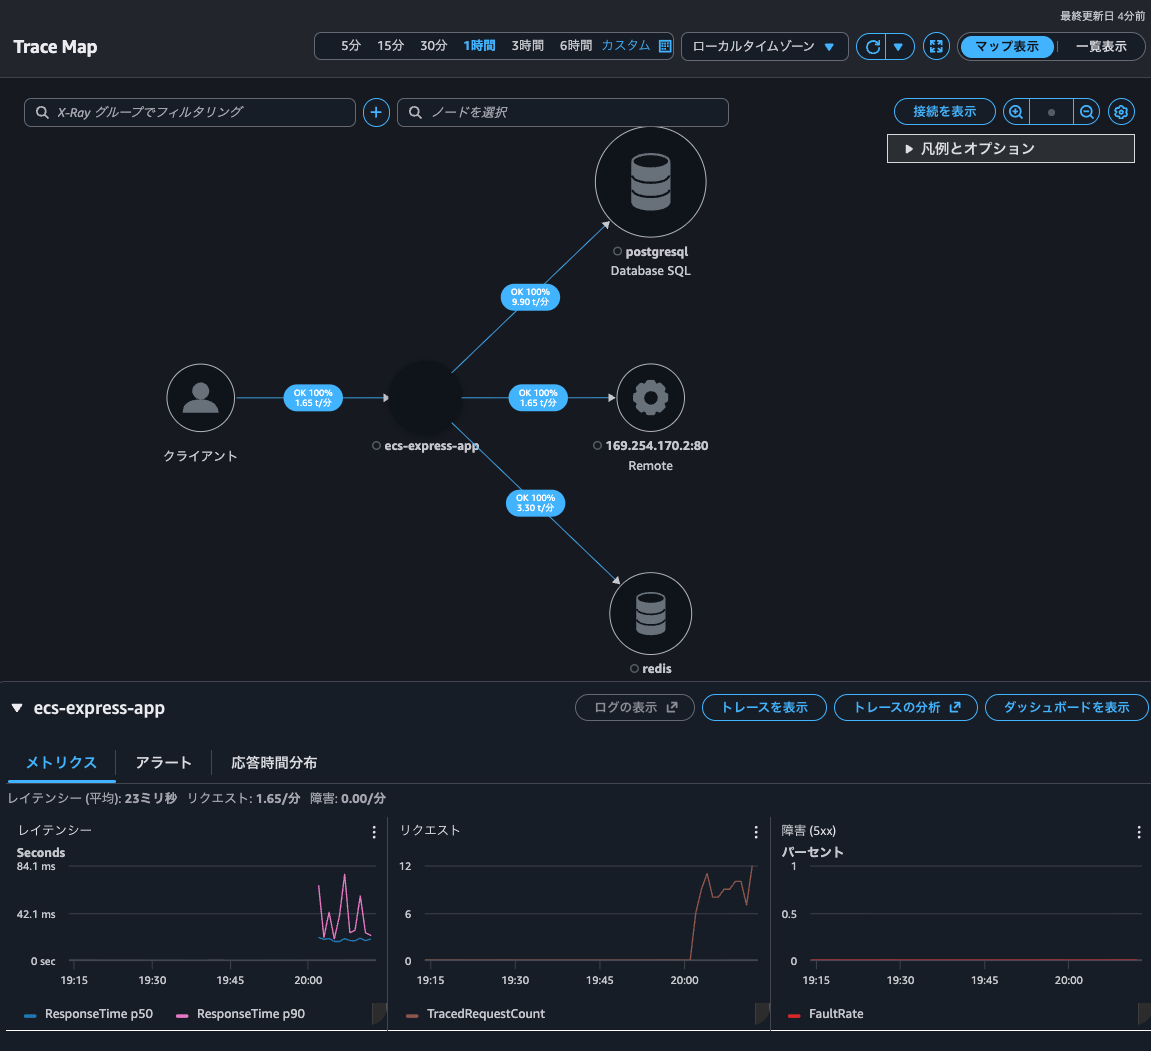
Trace Mapも表示できるようになっていました。Trace indexing rateが0%の場合は表示されなかったのでインデックスされたもののみ表示されるのでしょう。
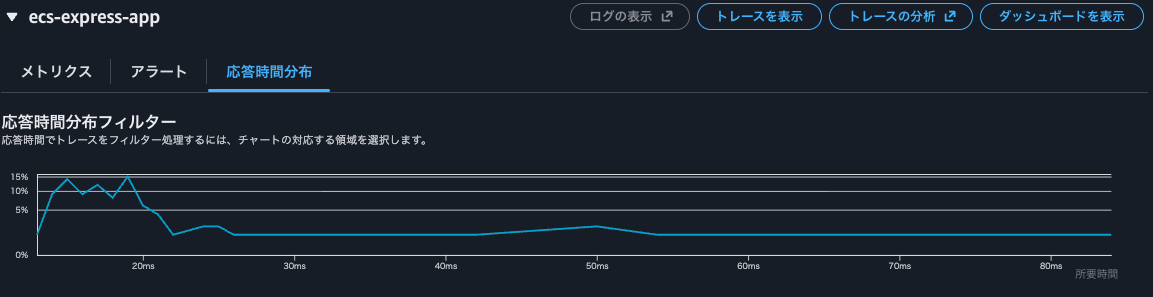
Trace Mapからメトリクスも応答時間分布も確認できました。
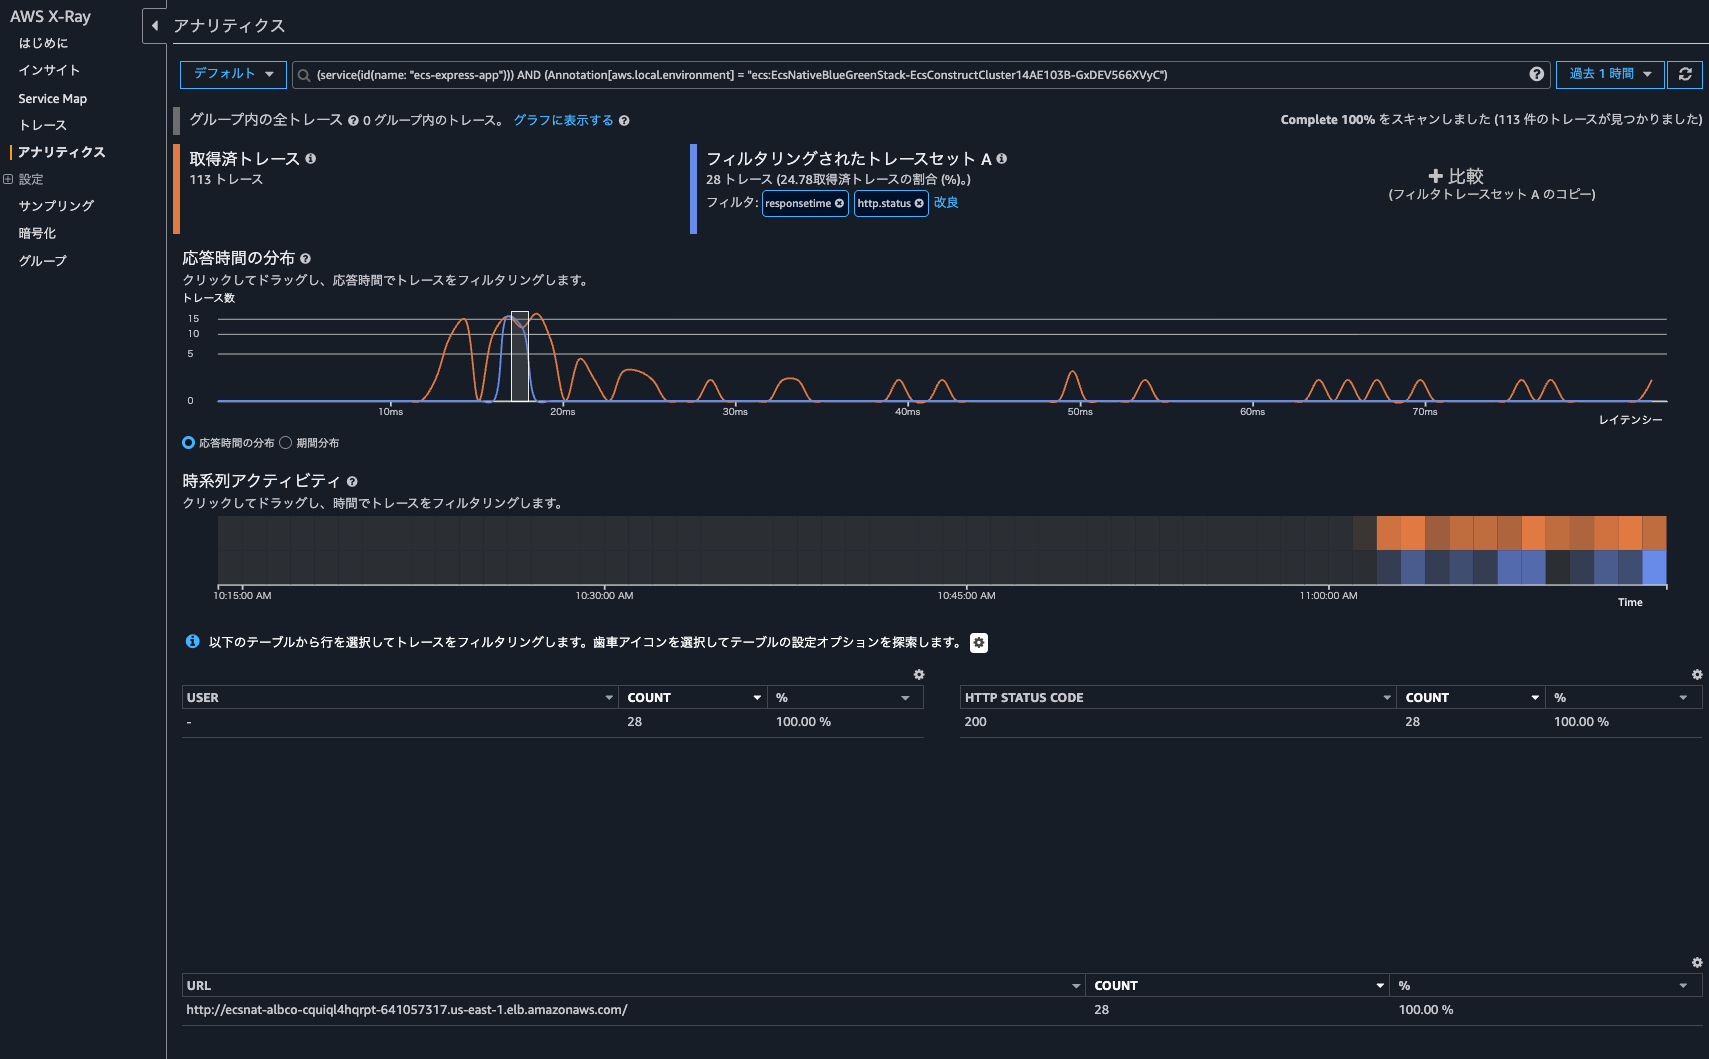
トレースの分析をクリックすると、CloudWatchのコンソールではなくX-Rayのアナリティクスコンソールが開き、より詳細な情報を確認できました。
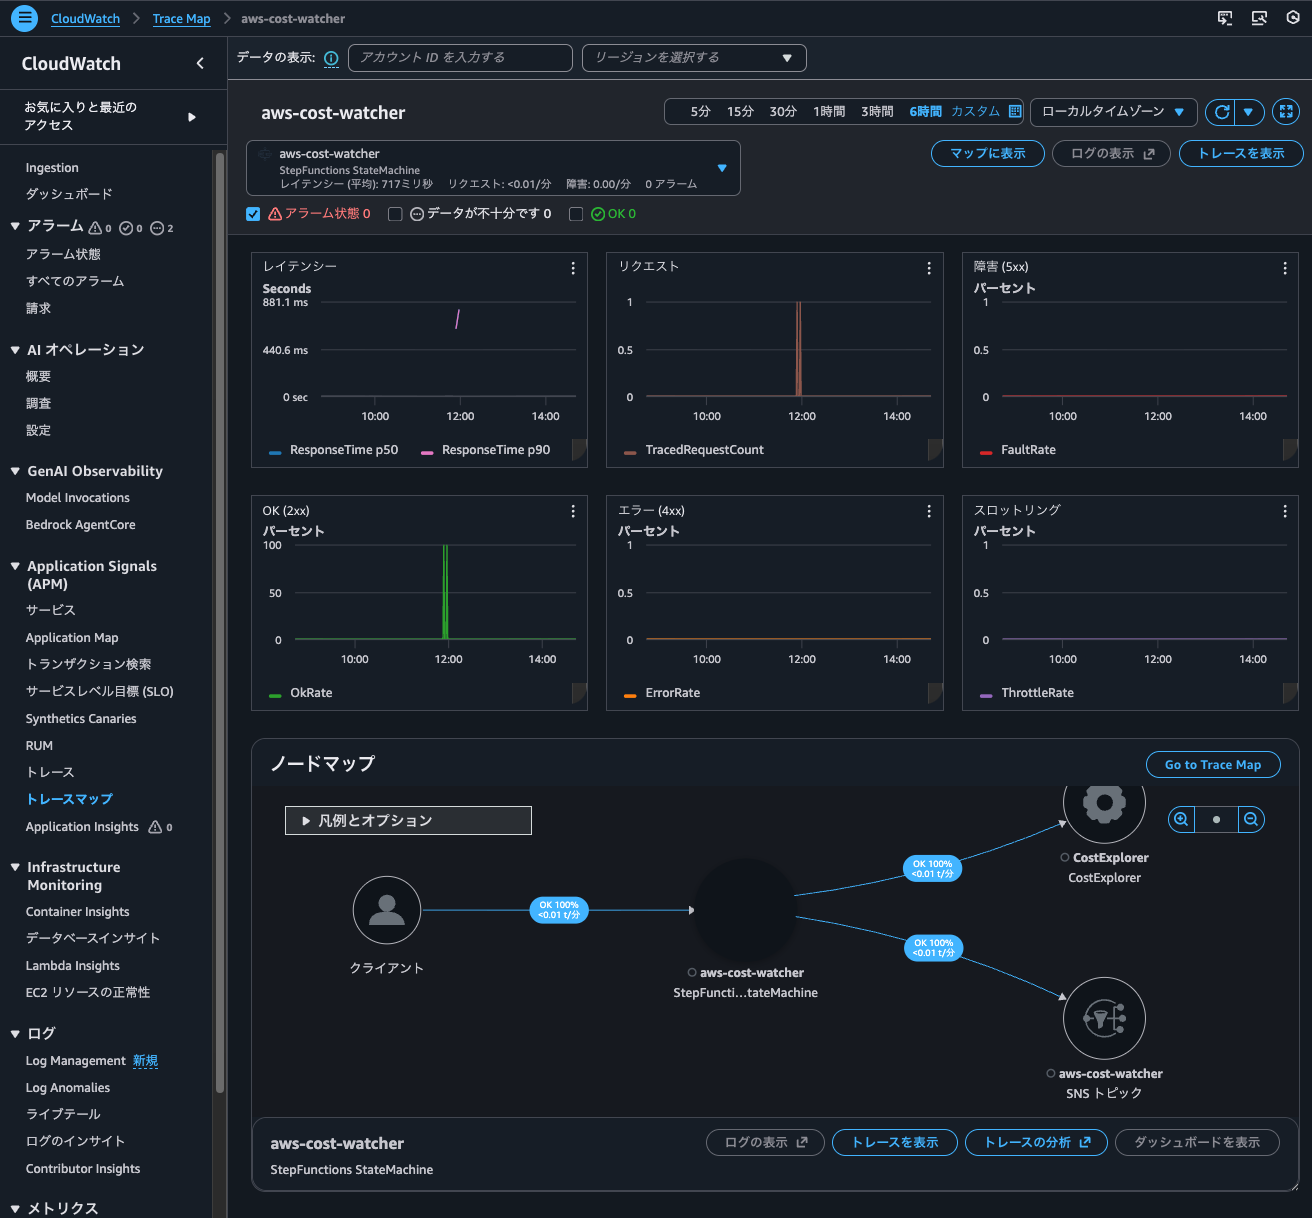
Trace Mapの画面に戻ってダッシュボードの表示をクリックすると以下のように各種メトリクスやノードマップが記載されているダッシュボードを確認できました。
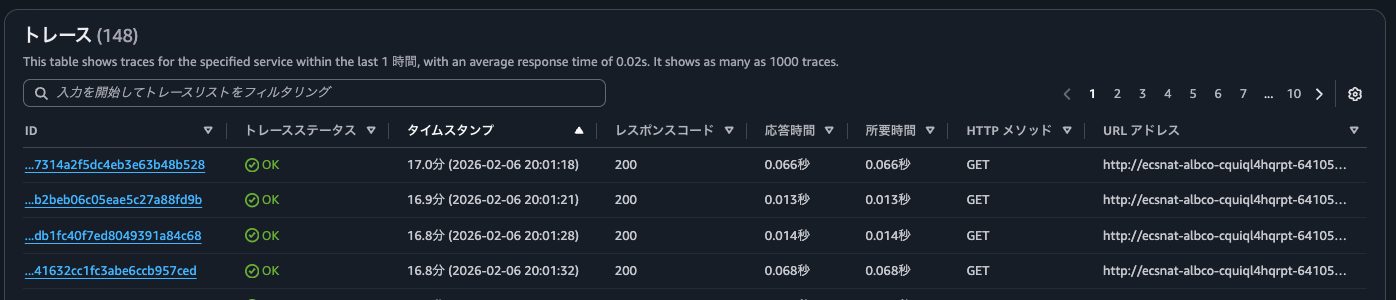
CloudWatch > トレースからトレース一覧も確認できました。
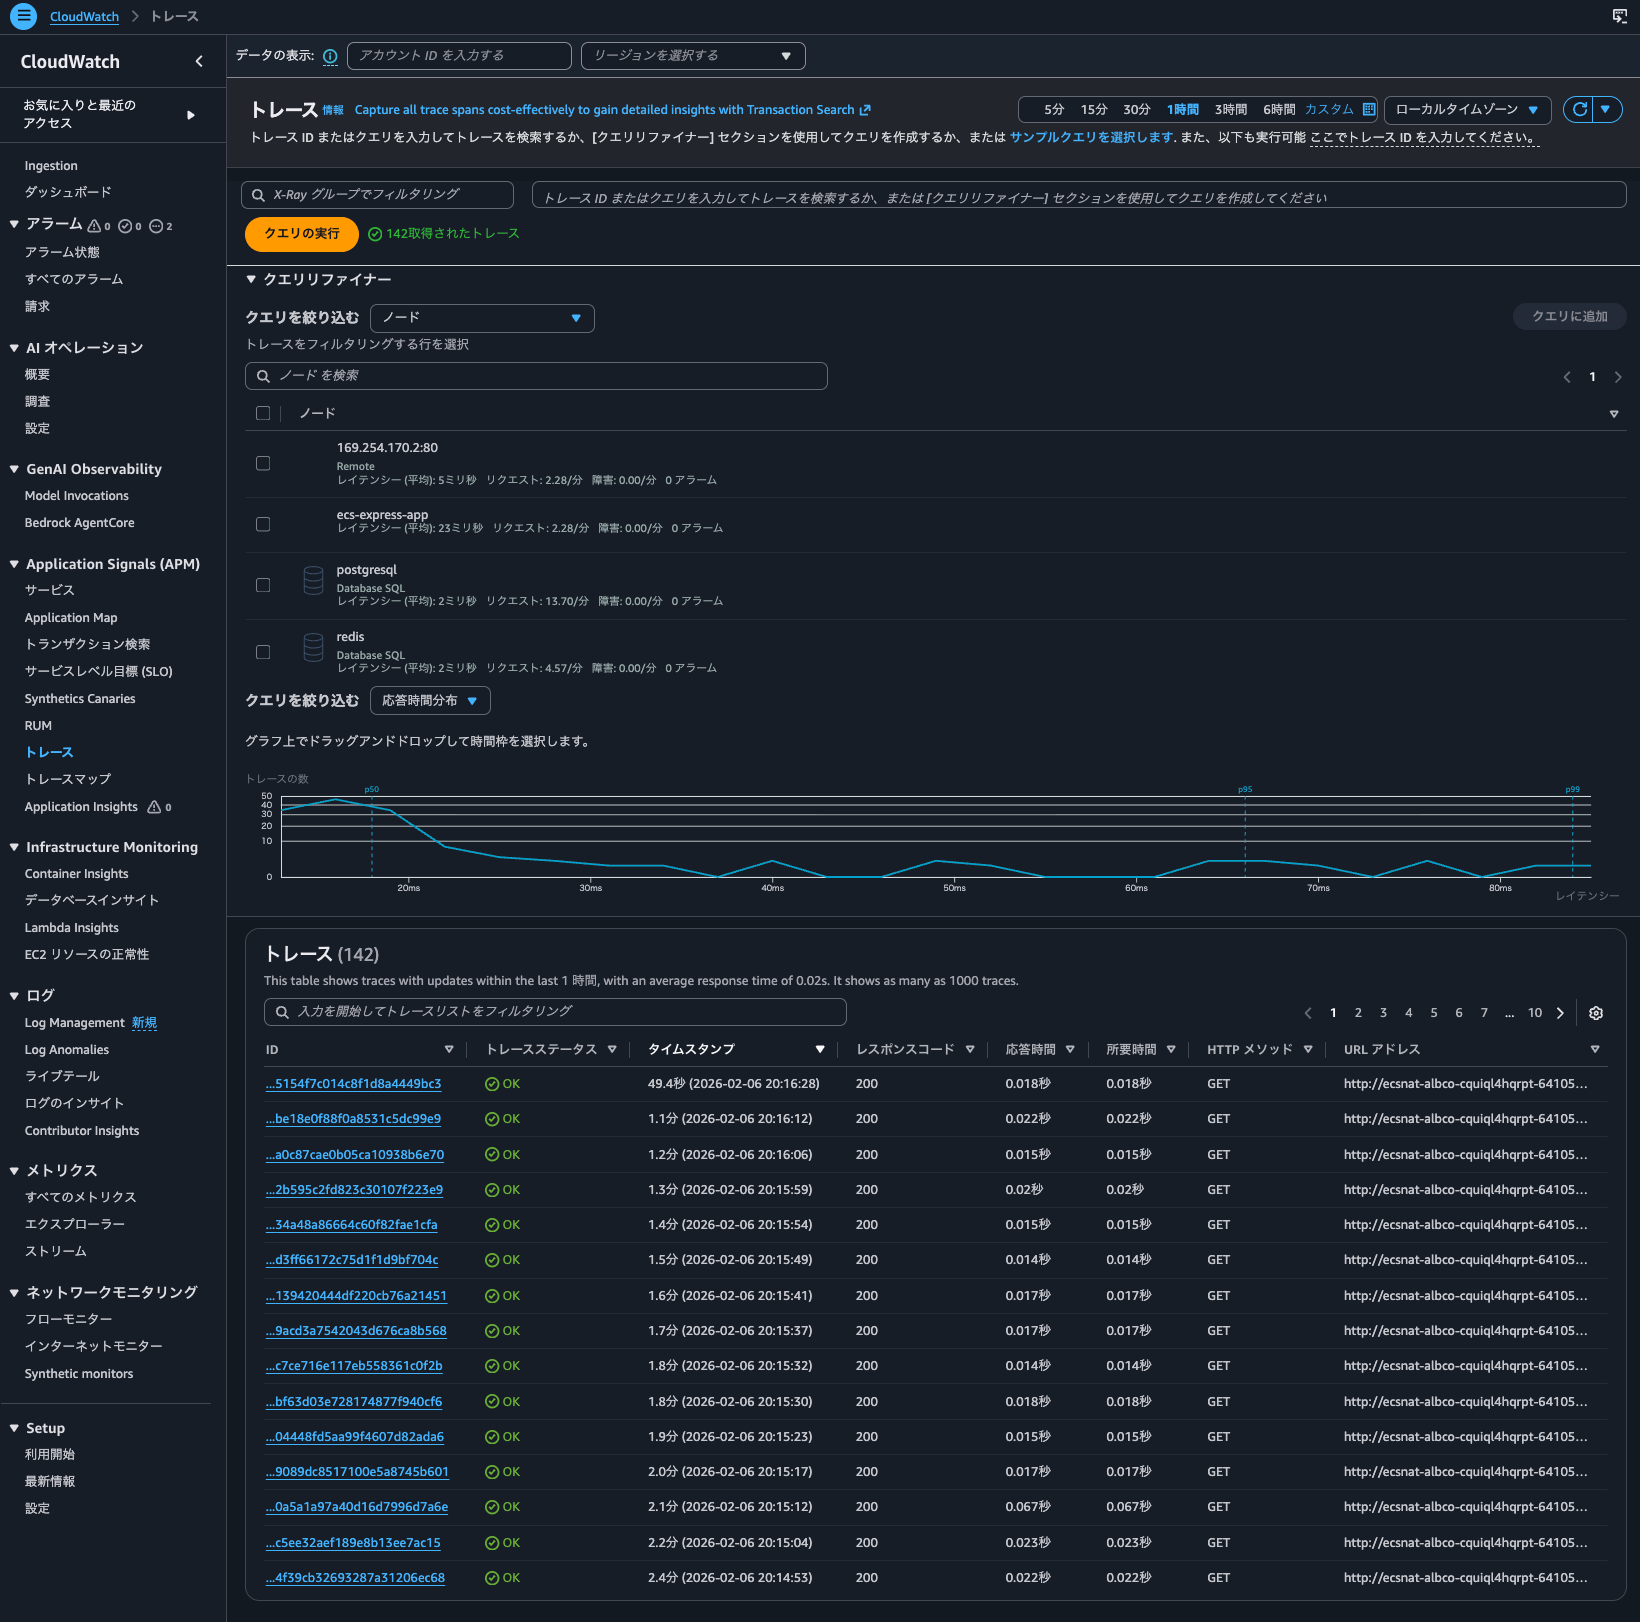
検索範囲は1時間で、Trace indexing rateが0%の時のアクセス時間も含まれているのですが、Trace indexing rateが100%設定移行のアクセス分しか表示されていません。
get-trace-summariesの実行結果は以下のとおりです。Trace indexing rateが100%設定移行のアクセスのトレースがリストアップされました。
> aws xray get-trace-summaries \
--start-time 2026-02-06T11:00:00Z \
--end-time 2026-02-06T12:00:00Z \
--filter-expression 'service("ecs-express-app")' \
--region us-east-1
{
"TraceSummaries": [
{
"Id": "1-6985cbe8-fed5a5a79d14762589878bd4",
"StartTime": "2026-02-06T20:09:28+09:00",
"Duration": 0.016,
"ResponseTime": 0.016,
"HasFault": false,
"HasError": false,
"HasThrottle": false,
"IsPartial": false,
"Http": {
"HttpURL": "http://ecsnat-albco-cquiql4hqrpt-641057317.us-east-1.elb.amazonaws.com/",
"HttpStatus": 200,
"HttpMethod": "GET",
"UserAgent": "curl/8.7.1",
"ClientIp": "104.28.204.107"
},
"Annotations": {
"aws.local.environment": [
{
"AnnotationValue": {
"StringValue": "ecs:EcsNativeBlueGreenStack-EcsConstructCluster14AE103B-GxDEV566XVyC"
}
}
],
"aws.local.operation": [
{
"AnnotationValue": {
"StringValue": "SET"
}
},
{
"AnnotationValue": {
"StringValue": "GET"
}
},
{
"AnnotationValue": {
"StringValue": "GET /v4"
}
},
{
"AnnotationValue": {
"StringValue": "INSERT INTO"
}
},
{
"AnnotationValue": {
"StringValue": "UnknownRemoteOperation"
}
},
{
"AnnotationValue": {
"StringValue": "UnmappedOperation"
}
},
{
"AnnotationValue": {
"StringValue": "SELECT"
}
},
{
"AnnotationValue": {
"StringValue": "GET /"
}
}
],
"aws.local.resource.identifier": [
{
"AnnotationValue": {
"StringValue": "appdb|ecsnativebluegreenstack-auroraconstructclustercc23-nubx1xlfqgbp.cluster-cicjym7lykmq.us-east-1.rds.amazonaws.com|5432"
}
},
{
"AnnotationValue": {
"StringValue": "ecsnativebluegreenstackvalkeyc-valkey-pvjbiy.serverless.use1.cache.amazonaws.com|6379"
}
}
],
"aws.local.resource.type": [
{
"AnnotationValue": {
"StringValue": "DB::Connection"
}
}
],
"aws.local.service": [
{
"AnnotationValue": {
"StringValue": "169.254.170.2:80"
}
},
{
"AnnotationValue": {
"StringValue": "postgresql"
}
},
{
"AnnotationValue": {
"StringValue": "ecs-express-app"
}
},
{
"AnnotationValue": {
"StringValue": "redis"
}
}
],
"aws.remote.operation": [
{
"AnnotationValue": {
"StringValue": "SET"
}
},
{
"AnnotationValue": {
"StringValue": "GET"
}
},
{
"AnnotationValue": {
"StringValue": "GET /v4"
}
},
{
"AnnotationValue": {
"StringValue": "INSERT INTO"
}
},
{
"AnnotationValue": {
"StringValue": "UnknownRemoteOperation"
}
},
{
"AnnotationValue": {
"StringValue": "SELECT"
}
}
],
"aws.remote.resource.identifier": [
{
"AnnotationValue": {
"StringValue": "appdb|ecsnativebluegreenstack-auroraconstructclustercc23-nubx1xlfqgbp.cluster-cicjym7lykmq.us-east-1.rds.amazonaws.com|5432"
}
},
{
"AnnotationValue": {
"StringValue": "ecsnativebluegreenstackvalkeyc-valkey-pvjbiy.serverless.use1.cache.amazonaws.com|6379"
}
}
],
"aws.remote.resource.type": [
{
"AnnotationValue": {
"StringValue": "DB::Connection"
}
}
],
"aws.remote.service": [
{
"AnnotationValue": {
"StringValue": "169.254.170.2:80"
}
},
{
"AnnotationValue": {
"StringValue": "postgresql"
}
},
{
"AnnotationValue": {
"StringValue": "redis"
}
}
],
"span.kind": [
{
"AnnotationValue": {
"StringValue": "SERVER"
}
},
{
"AnnotationValue": {
"StringValue": "INTERNAL"
}
},
{
"AnnotationValue": {
"StringValue": "CLIENT"
}
}
],
"span.name": [
{
"AnnotationValue": {
"StringValue": "set"
}
},
{
"AnnotationValue": {
"StringValue": "middleware - session"
}
},
{
"AnnotationValue": {
"StringValue": "router - /"
}
},
{
"AnnotationValue": {
"StringValue": "pg-pool.connect"
}
},
{
"AnnotationValue": {
"StringValue": "GET /"
}
},
{
"AnnotationValue": {
"StringValue": "middleware - jsonParser"
}
},
{
"AnnotationValue": {
"StringValue": "middleware - expressInit"
}
},
{
"AnnotationValue": {
"StringValue": "middleware - query"
}
},
{
"AnnotationValue": {
"StringValue": "pg.query:SELECT appdb"
}
},
{
"AnnotationValue": {
"StringValue": "GET"
}
},
{
"AnnotationValue": {
"StringValue": "get"
}
},
{
"AnnotationValue": {
"StringValue": "middleware - result"
}
},
{
"AnnotationValue": {
"StringValue": "request handler - /"
}
},
{
"AnnotationValue": {
"StringValue": "pg.query:INSERT appdb"
}
},
{
"AnnotationValue": {
"StringValue": "tcp.connect"
}
}
]
},
"Users": [],
"ServiceIds": [
{
"Name": "169.254.170.2:80",
"Names": [
"169.254.170.2:80"
],
"Type": "remote"
},
{
"Name": "postgresql",
"Names": [
"postgresql"
],
"Type": "Database::SQL"
},
{
"Name": "ecs-express-app",
"Names": [
"ecs-express-app"
],
"Type": "client"
},
{
"Name": "redis",
"Names": [
"redis"
],
"Type": "Database::SQL"
},
{
"Name": "ecs-express-app",
"Names": [
"ecs-express-app"
]
}
],
"ResourceARNs": [],
"InstanceIds": [],
"AvailabilityZones": [],
"EntryPoint": {
"Name": "ecs-express-app",
"Names": [
"ecs-express-app"
]
},
"FaultRootCauses": [],
"ErrorRootCauses": [],
"ResponseTimeRootCauses": [],
"Revision": 1
},
{
"Id": "1-6985cba7-178c1d301bd6768860d8f4d9",
"StartTime": "2026-02-06T20:08:23+09:00",
"Duration": 0.014,
"ResponseTime": 0.014,
.
.
(中略)
.
.
"ResourceARNs": [],
"InstanceIds": [],
"AvailabilityZones": [],
"EntryPoint": {
"Name": "ecs-express-app",
"Names": [
"ecs-express-app"
]
},
"FaultRootCauses": [],
"ErrorRootCauses": [],
"ResponseTimeRootCauses": [],
"Revision": 1
}
],
"TracesProcessedCount": 0,
"ApproximateTime": "2026-02-06T21:00:00+09:00"
}
> aws xray get-trace-summaries \
--start-time 2026-02-06T11:00:00Z \
--end-time 2026-02-06T12:00:00Z \
--filter-expression 'service("ecs-express-app")' \
--query 'sort_by(TraceSummaries, &StartTime)[].{Id:Id,StartTime:StartTime}' \
--output table \
--region us-east-1
----------------------------------------------------------------------
| GetTraceSummaries |
+--------------------------------------+-----------------------------+
| Id | StartTime |
+--------------------------------------+-----------------------------+
| 1-6985c9fe-7314a2f5dc4eb3e63b48b528 | 2026-02-06T20:01:18+09:00 |
| 1-6985ca01-b2beb06c05eae5c27a88fd9b | 2026-02-06T20:01:21+09:00 |
| 1-6985ca08-db1fc40f7ed8049391a84c68 | 2026-02-06T20:01:28+09:00 |
.
.
(中略)
.
.
| 1-6985ce26-f0197a153b3c9a49f69eae7b | 2026-02-06T20:19:02+09:00 |
| 1-6985ce27-09c6ff1f9d0743cee241daed | 2026-02-06T20:19:03+09:00 |
| 1-6985ce2c-9f6a71140164f8c2d704a692 | 2026-02-06T20:19:08+09:00 |
+--------------------------------------+-----------------------------+
> aws xray get-trace-summaries \
--start-time 2026-02-06T11:00:00Z \
--end-time 2026-02-06T12:00:00Z \
--filter-expression 'service("ecs-express-app")' \
--query 'length(TraceSummaries)' \
--region us-east-1
171
やはりトレースにインデックスが張られることによってTrace MapやTransaction Searchを使わないトレースの検索を行うことができるようです。これらの機能を用いる場合はインデックスが張られるようにTrace indexing rateを調整すると良いでしょう。
Trace indexing rateが0%の場合でもX-Rayトレーシング機能による記録されたトレースは検索できるか
ふと、Trace indexing rateが0%の場合でもX-Rayトレーシング機能による記録されたトレースは検索できるか気になりました。
Trace indexing rateはリージョンレベルの設定です。トレースはApplication SignalsやTransaction Search(実態はLogs Insights)で確認する運用とするからと言って、Trace indexing rateを1%など小さい値にしたことが原因で、Step Functionsのトレースの検索ができなくなることは避けたいです。
Trace indexing rateが0%の場合でもX-Rayトレーシング機能による記録されたトレースは検索できるか確認してみます。
まず、比較用にTrace indexing rateが100%の場合です。以下のようにStep FunctionsステートマシンにてX-Rayトレーシングを有効にしています。
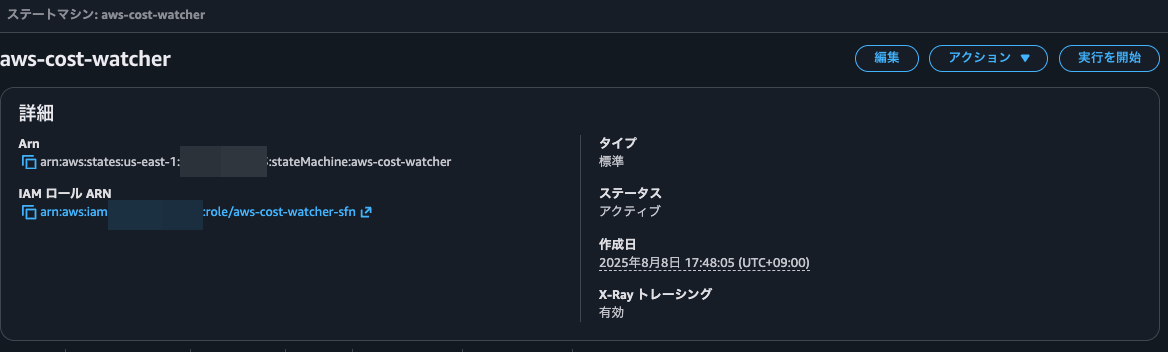
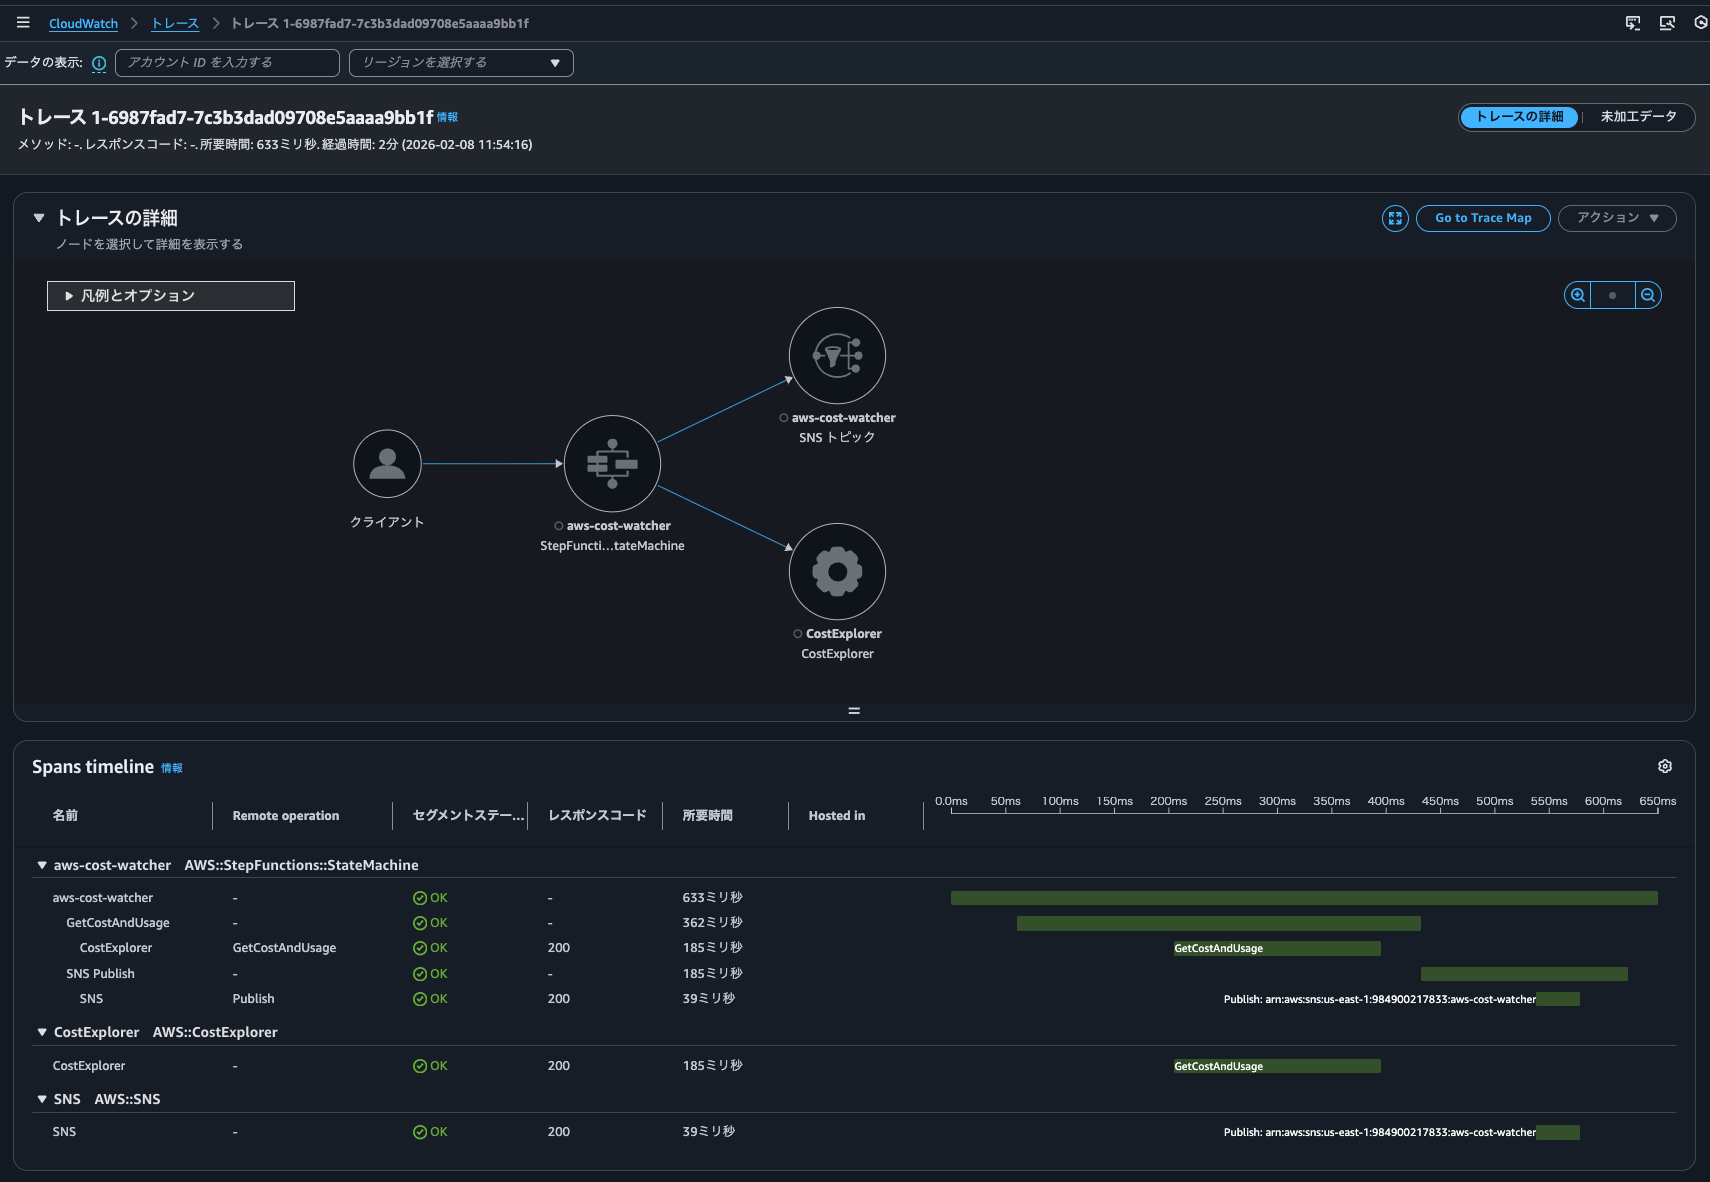
ステートマシンを実行すると、トレースマップへのリンクが確認できました。
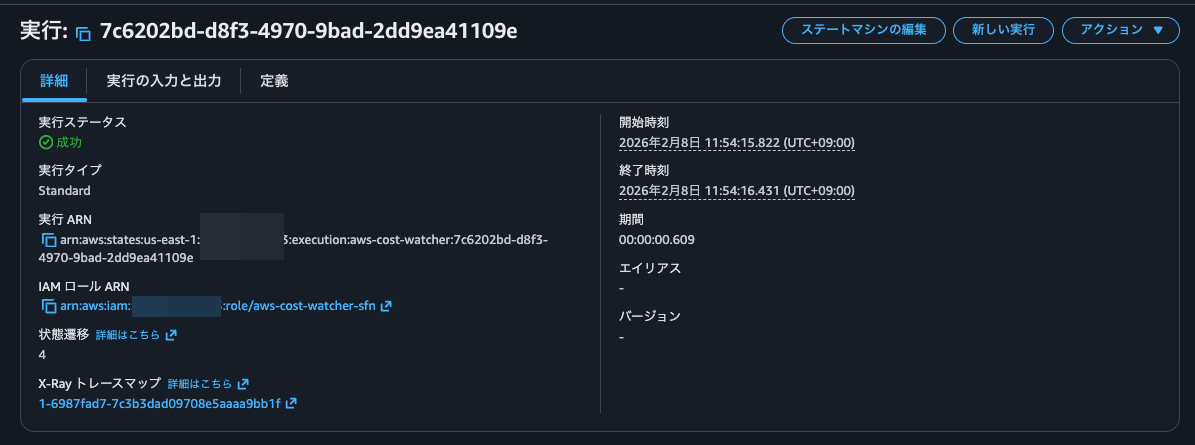
クリックすると、トレースの詳細を確認できました。
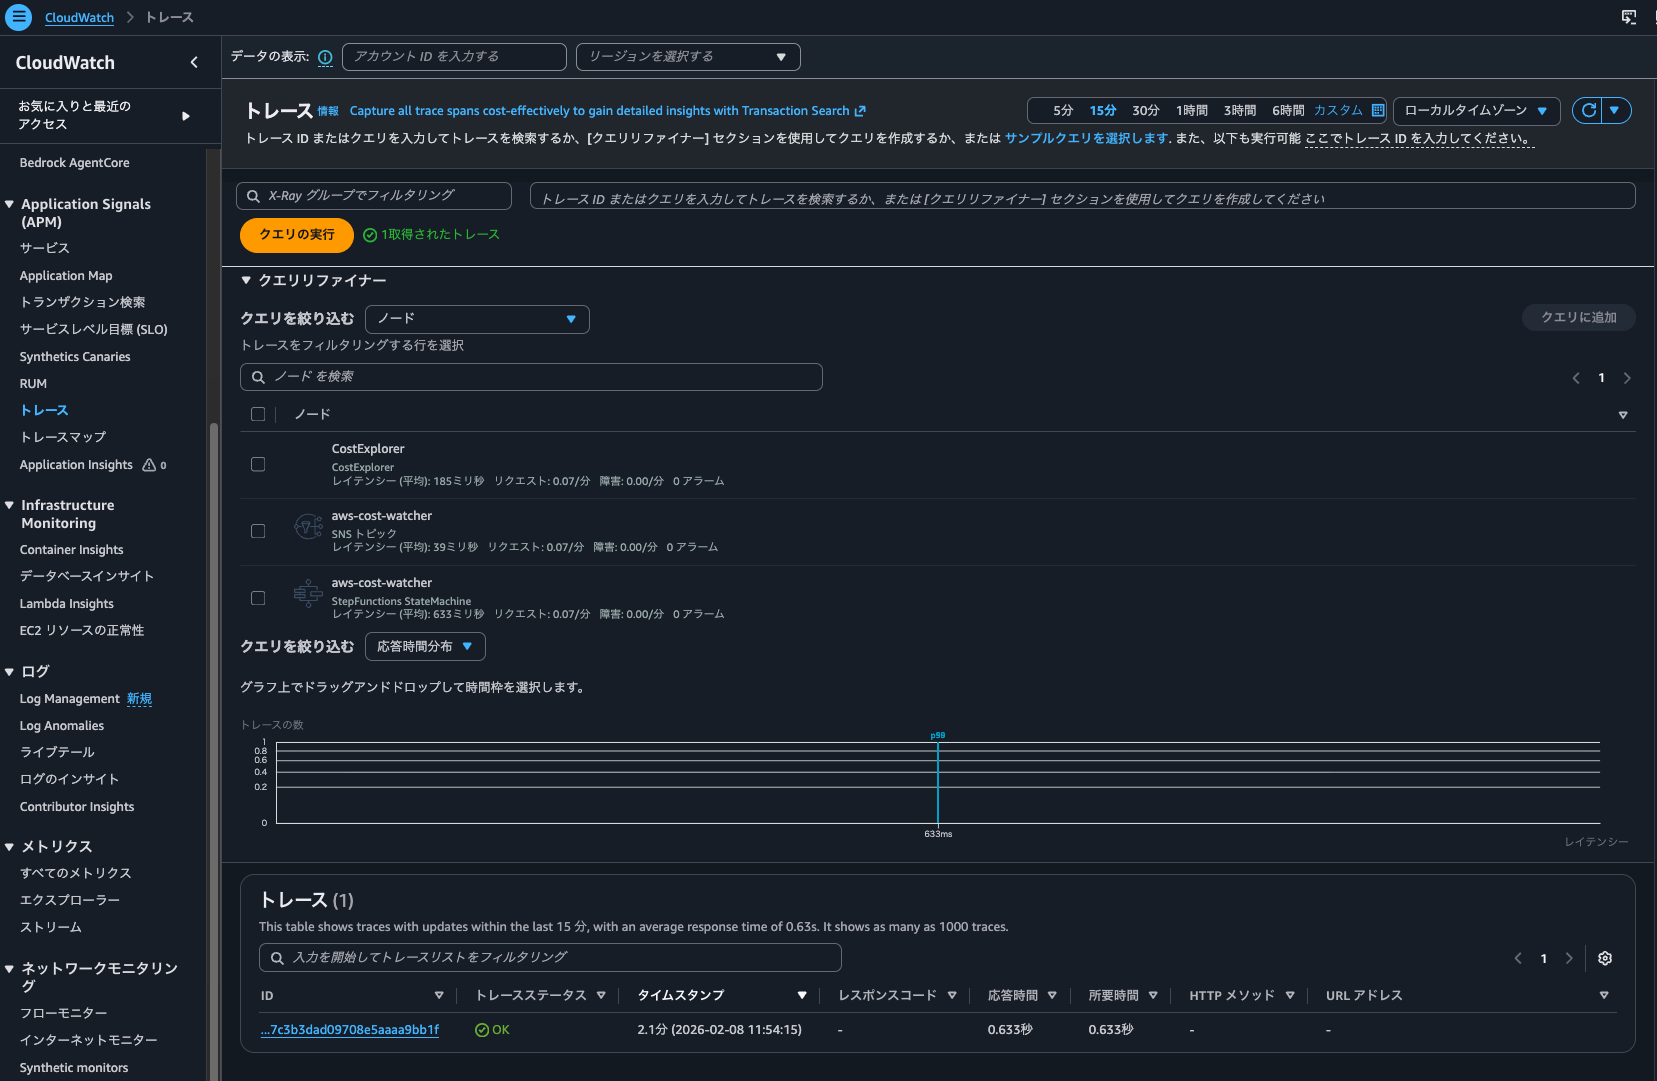
また、CloudWatch > トレースからトレース一覧を確認できました。
続けて、Trace indexing rateが0%の場合です。
再度ステートマシンを実行しましたが、こちらもCloudWatch > トレースからトレース一覧を確認できました。
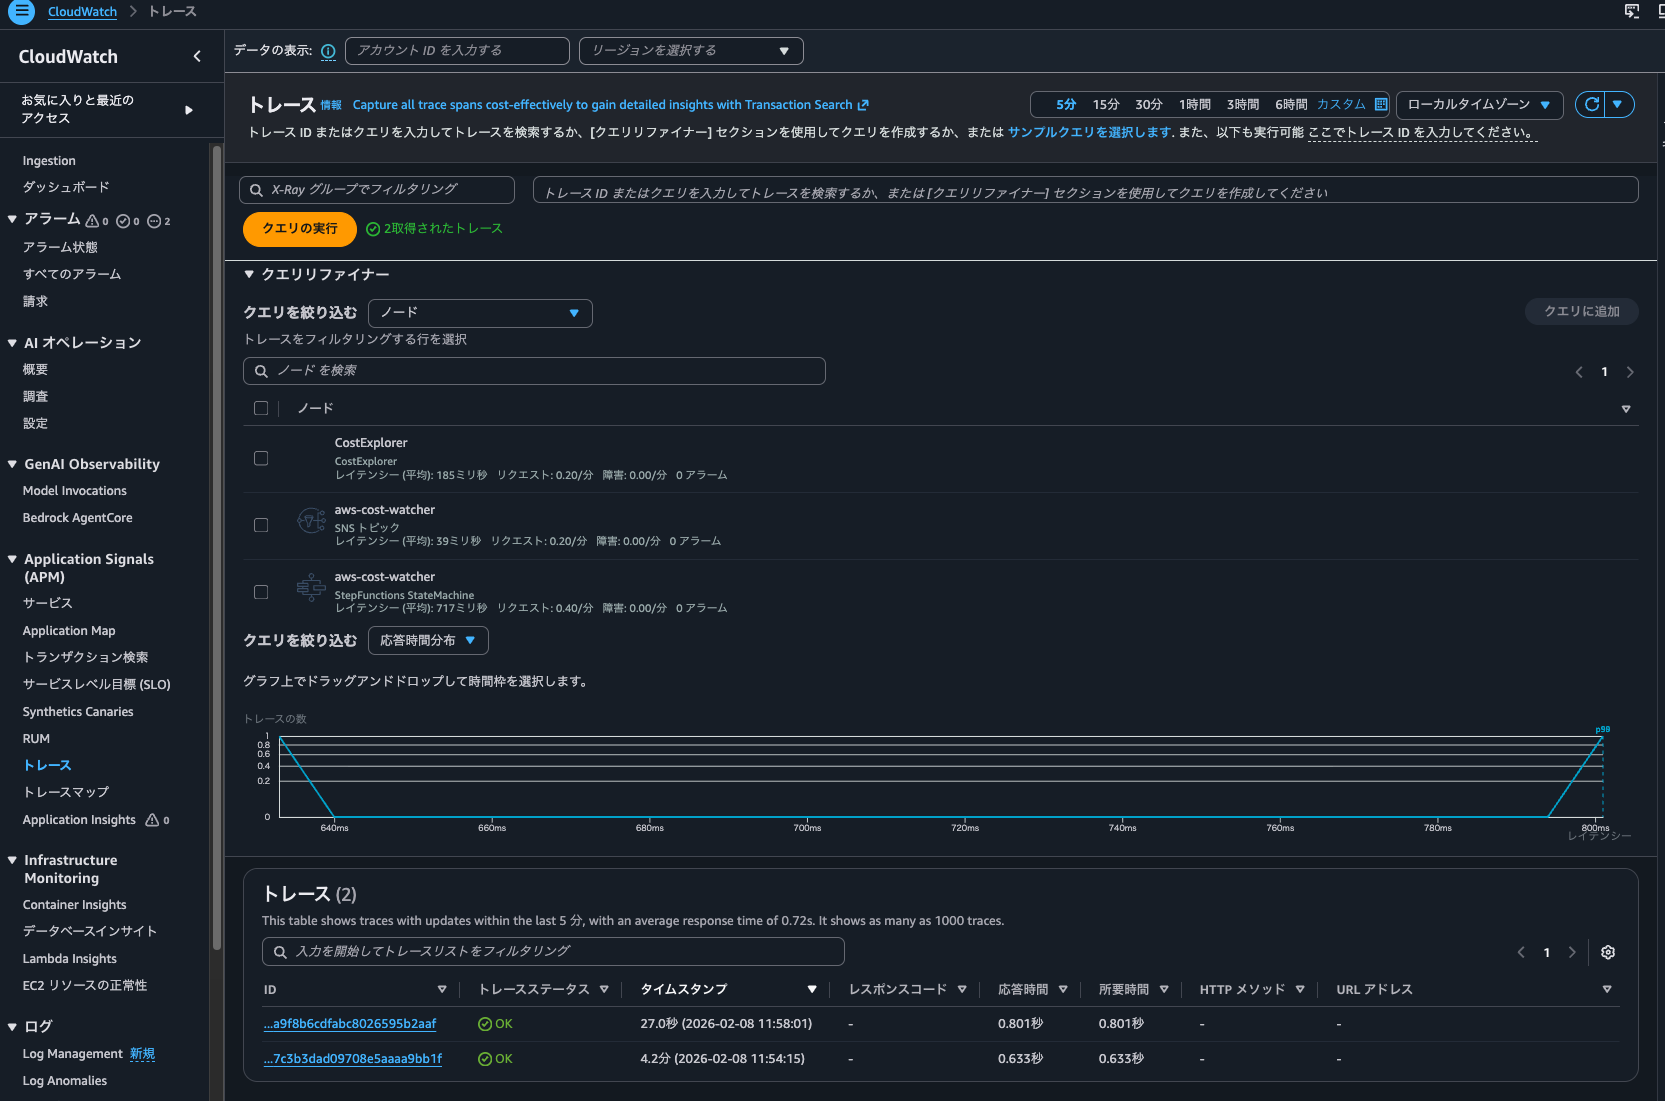
ダッシュボードからTrace indexing rateが0%の時に実行したものによるメトリクスも確認できました。
ということで、Trace indexing rateが0%の場合でもX-Ray統合による記録されたトレースは検索できます。
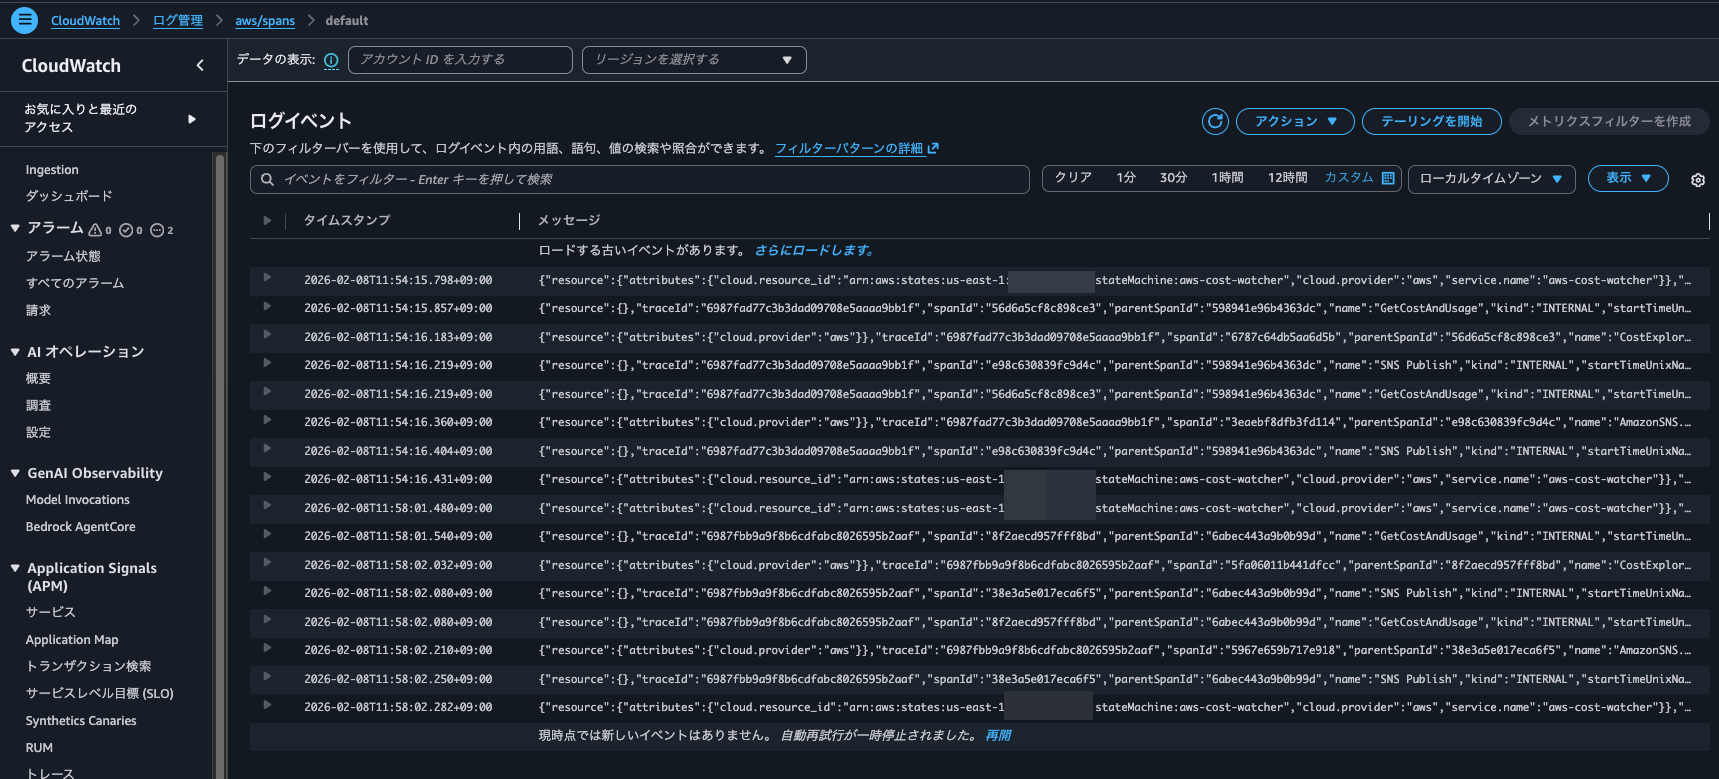
ちなみにaws/spansのロググループを確認すると、Trace indexing rateが0%、100%と両方の実行時のスパンが記録されていました。
Application Signals操作中に発生していたLogs Insightsクエリの確認
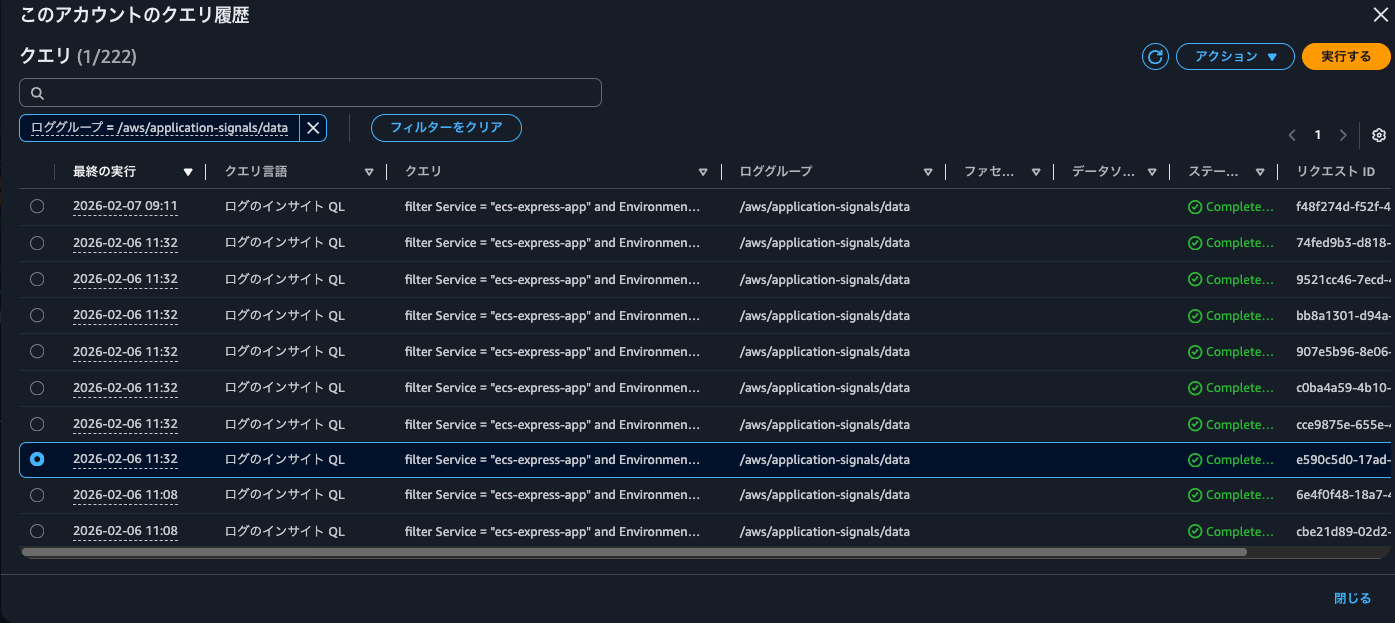
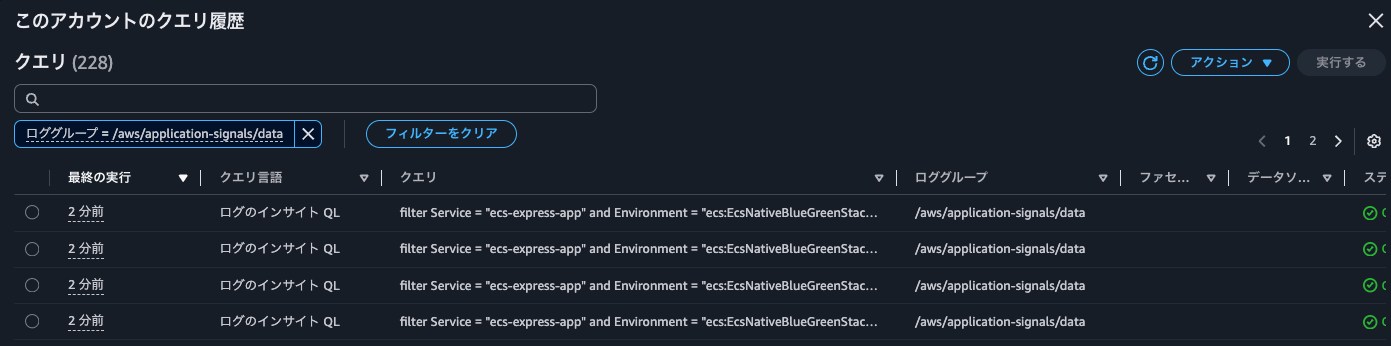
ふと、Logs Insightsのクエリ実行結果を確認すると、20:32に以下のクエリが/aws/application-signals/dataロググループへ7回実行されていました。
filter Service = "ecs-express-app" and Environment = "ecs:EcsNativeBlueGreenStack-EcsConstructCluster14AE103B-GxDEV566XVyC" and RemoteService = "postgresql" and RemoteOperation = "SELECT" and RemoteResourceIdentifier = "appdb|ecsnativebluegreenstack-auroraconstructclustercc23-nubx1xlfqgbp.cluster-cicjym7lykmq.us-east-1.rds.amazonaws.com|5432"| fields jsonparse(@message) as js| filter ispresent(js.Exemplars.Latency)
| unnest js.Exemplars.Latency into exemplars
| fields @timestamp, exemplars.traceId as traceId, exemplars.spanId as spanId, exemplars.filteredAttributes.name as name, exemplars.filteredAttributes.status as exemplarStatusCode, exemplars.filteredAttributes.durationNano/1000000 as duration, exemplars.filteredAttributes.endTimeUnixNano/1000000 as timestamp, exemplars.filteredAttributes.cloudResourceId as resourceId, exemplars.filteredAttributes.sessionId as sessionId
| limit 10
この時CloudTrailに記録されていたイベントは以下のとおりです。
{
    "eventVersion": "1.11",
    "userIdentity": {
        "type": "AssumedRole",
        "principalId": "<プリンシパルID>",
        "arn": "arn:aws:sts::<AWSアカウントID>:assumed-role/<IAMロール名>/<セッション名>",
        "accountId": "<AWSアカウントID>",
        "accessKeyId": "<アクセスキー>",
        "sessionContext": {
            "sessionIssuer": {
                "type": "Role",
                "principalId": "<プリンシパルID>",
                "arn": "arn:aws:iam::<AWSアカウントID>:role/<IAMロール名>",
                "accountId": "<AWSアカウントID>",
                "userName": "<IAMユーザー名>"
            },
            "attributes": {
                "creationDate": "2026-02-06T08:10:35Z",
                "mfaAuthenticated": "true"
            }
        }
    },
    "eventTime": "2026-02-06T11:32:26Z",
    "eventSource": "logs.amazonaws.com",
    "eventName": "StartQuery",
    "awsRegion": "us-east-1",
    "sourceIPAddress": "<送信元IPアドレス>",
    "userAgent": "Mozilla/5.0 (Macintosh; Intel Mac OS X 10_15_7) AppleWebKit/537.36 (KHTML, like Gecko) Chrome/144.0.0.0 Safari/537.36",
    "requestParameters": {
        "queryLanguage": "CWLI",
        "logGroupIdentifiers": [
            "/aws/application-signals/data"
        ],
        "startTime": 1770373860,
        "endTime": 1770373919,
        "queryString": "filter Service = \"ecs-express-app\" and Environment = \"ecs:EcsNativeBlueGreenStack-EcsConstructCluster14AE103B-GxDEV566XVyC\" and RemoteService = \"postgresql\" and RemoteOperation = \"SELECT\" and RemoteResourceIdentifier = \"appdb|ecsnativebluegreenstack-auroraconstructclustercc23-nubx1xlfqgbp.cluster-cicjym7lykmq.us-east-1.rds.amazonaws.com|5432\"| fields jsonparse(@message) as js| filter ispresent(js.Exemplars.Latency) \n| unnest js.Exemplars.Latency into exemplars\n| fields @timestamp, exemplars.traceId as traceId, exemplars.spanId as spanId, exemplars.filteredAttributes.name as name, exemplars.filteredAttributes.status as exemplarStatusCode, exemplars.filteredAttributes.durationNano/1000000 as duration, exemplars.filteredAttributes.endTimeUnixNano/1000000 as timestamp, exemplars.filteredAttributes.cloudResourceId as resourceId, exemplars.filteredAttributes.sessionId as sessionId\n| limit 10",
        "dryRun": false,
        "forceAnalyticsTier": false
    },
    "responseElements": null,
    "additionalEventData": {
        "queryId": "bb8a1301-d94a-46fa-9796-a8ac9aa74326"
    },
    "requestID": "6be934c1-a3cd-4847-9618-a9aa1a5cd99b",
    "eventID": "6da95dad-f312-4c1d-bddf-71fa18846c1c",
    "readOnly": true,
    "resources": [
        {
            "accountId": "<AWSアカウントID>",
            "type": "AWS::Logs::LogGroup",
            "ARN": "arn:aws:logs:us-east-1:<AWSアカウントID>:log-group:/aws/application-signals/data"
        }
    ],
    "eventType": "AwsApiCall",
    "apiVersion": "20140328",
    "managementEvent": true,
    "recipientAccountId": "<AWSアカウントID>",
    "eventCategory": "Management",
    "tlsDetails": {
        "tlsVersion": "TLSv1.3",
        "cipherSuite": "TLS_AES_128_GCM_SHA256",
        "clientProvidedHostHeader": "logs.us-east-1.amazonaws.com"
    },
    "sessionCredentialFromConsole": "true"
}
/aws/application-signals/dataはApplication Signalsで使用されるEMF形式のログが記録されています。
色々Application Signalsを操作しながら、このようなクエリが実行されるタイミングを確認すると、Application Signalsで依存関係を絞り込んだ時や、メトリクスのグラフをクリックしたタイミングで実行されていました。
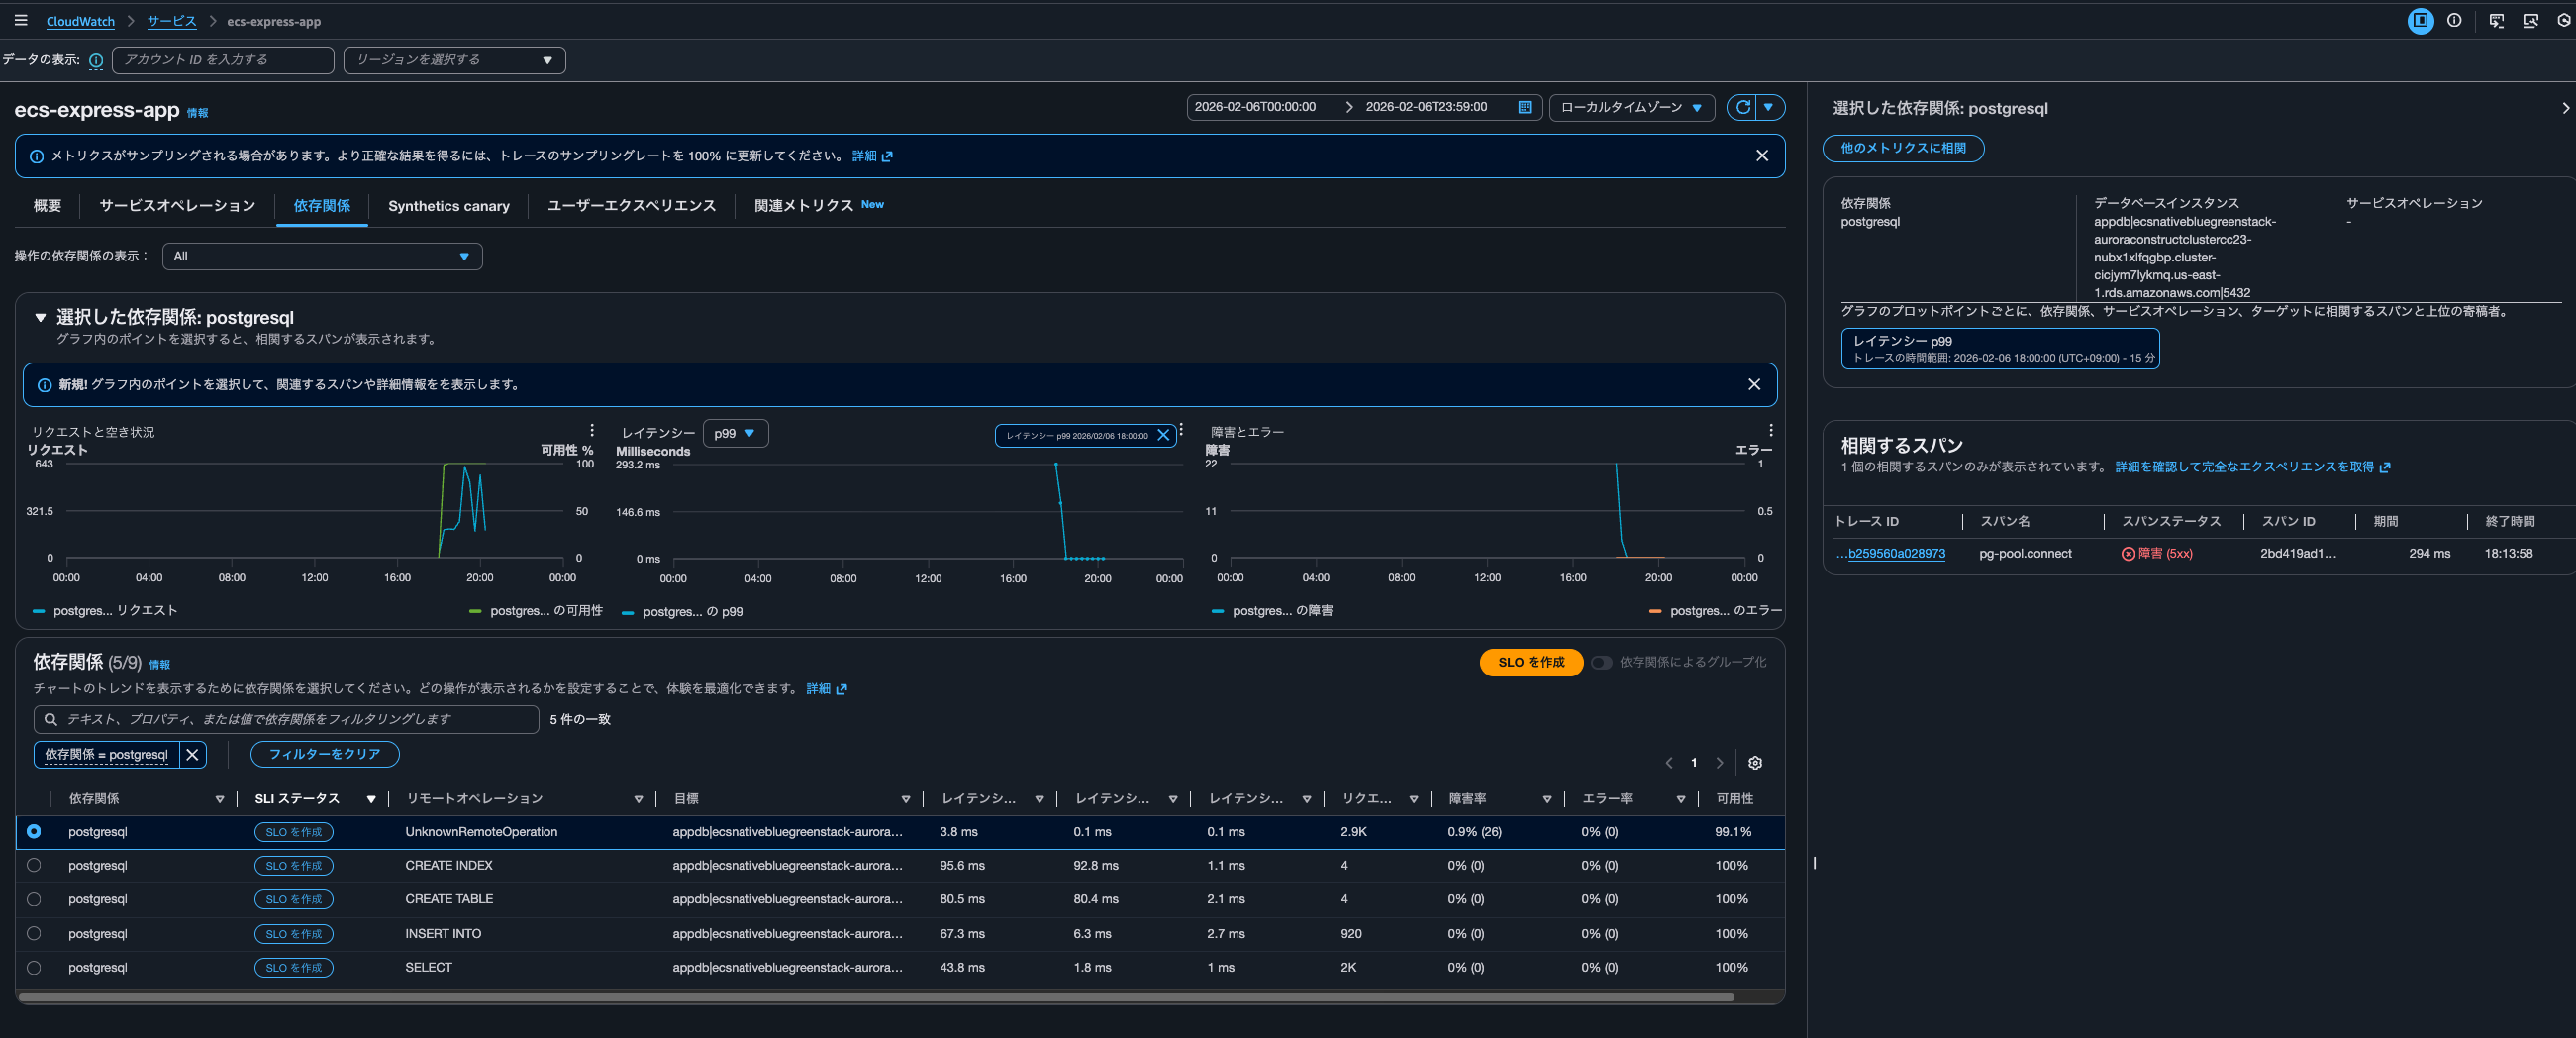
具体的なクエリは以下です。
filter Service = "ecs-express-app" and Environment = "ecs:EcsNativeBlueGreenStack-EcsConstructCluster14AE103B-GxDEV566XVyC" and RemoteService = "postgresql" and RemoteOperation = "UnknownRemoteOperation" and RemoteResourceIdentifier = "appdb|ecsnativebluegreenstack-auroraconstructclustercc23-nubx1xlfqgbp.cluster-cicjym7lykmq.us-east-1.rds.amazonaws.com|5432"| fields jsonparse(@message) as js| unnest js.Exemplars.Latency into exemplars
| filter exemplars.value>=293
| sort by exemplars.value asc
| fields @timestamp, exemplars.traceId as traceId, exemplars.spanId as spanId, exemplars.filteredAttributes.name as name, exemplars.filteredAttributes.status as exemplarStatusCode, exemplars.filteredAttributes.durationNano/1000000 as duration, exemplars.filteredAttributes.endTimeUnixNano/1000000 as timestamp, exemplars.filteredAttributes.cloudResourceId as resourceId, exemplars.filteredAttributes.sessionId as sessionId
| limit 10
Aurora PostgreSQLappdbへのUnknownRemoteOperationの呼び出しのうち、Exemplarのレイテンシが293ms以上のものを、レイテンシの低い順に最大10件取得していますね。
こちらのクエリが実行されたタイミングでは依存関係としてpostgresqlのみが絞り込まれていたときなのですが、全ての依存関係を表示すると以下クエリが4回実行されていました。
filter Service = "ecs-express-app" and Environment = "ecs:EcsNativeBlueGreenStack-EcsConstructCluster14AE103B-GxDEV566XVyC" and RemoteService = "postgresql" and RemoteOperation = "INSERT INTO" and RemoteResourceIdentifier = "appdb|ecsnativebluegreenstack-auroraconstructclustercc23-nubx1xlfqgbp.cluster-cicjym7lykmq.us-east-1.rds.amazonaws.com|5432"| fields jsonparse(@message) as js| unnest js.Exemplars.Latency into exemplars
| filter exemplars.value>=76
| sort by exemplars.value asc
| fields @timestamp, exemplars.traceId as traceId, exemplars.spanId as spanId, exemplars.filteredAttributes.name as name, exemplars.filteredAttributes.status as exemplarStatusCode, exemplars.filteredAttributes.durationNano/1000000 as duration, exemplars.filteredAttributes.endTimeUnixNano/1000000 as timestamp, exemplars.filteredAttributes.cloudResourceId as resourceId, exemplars.filteredAttributes.sessionId as sessionId
| limit 10
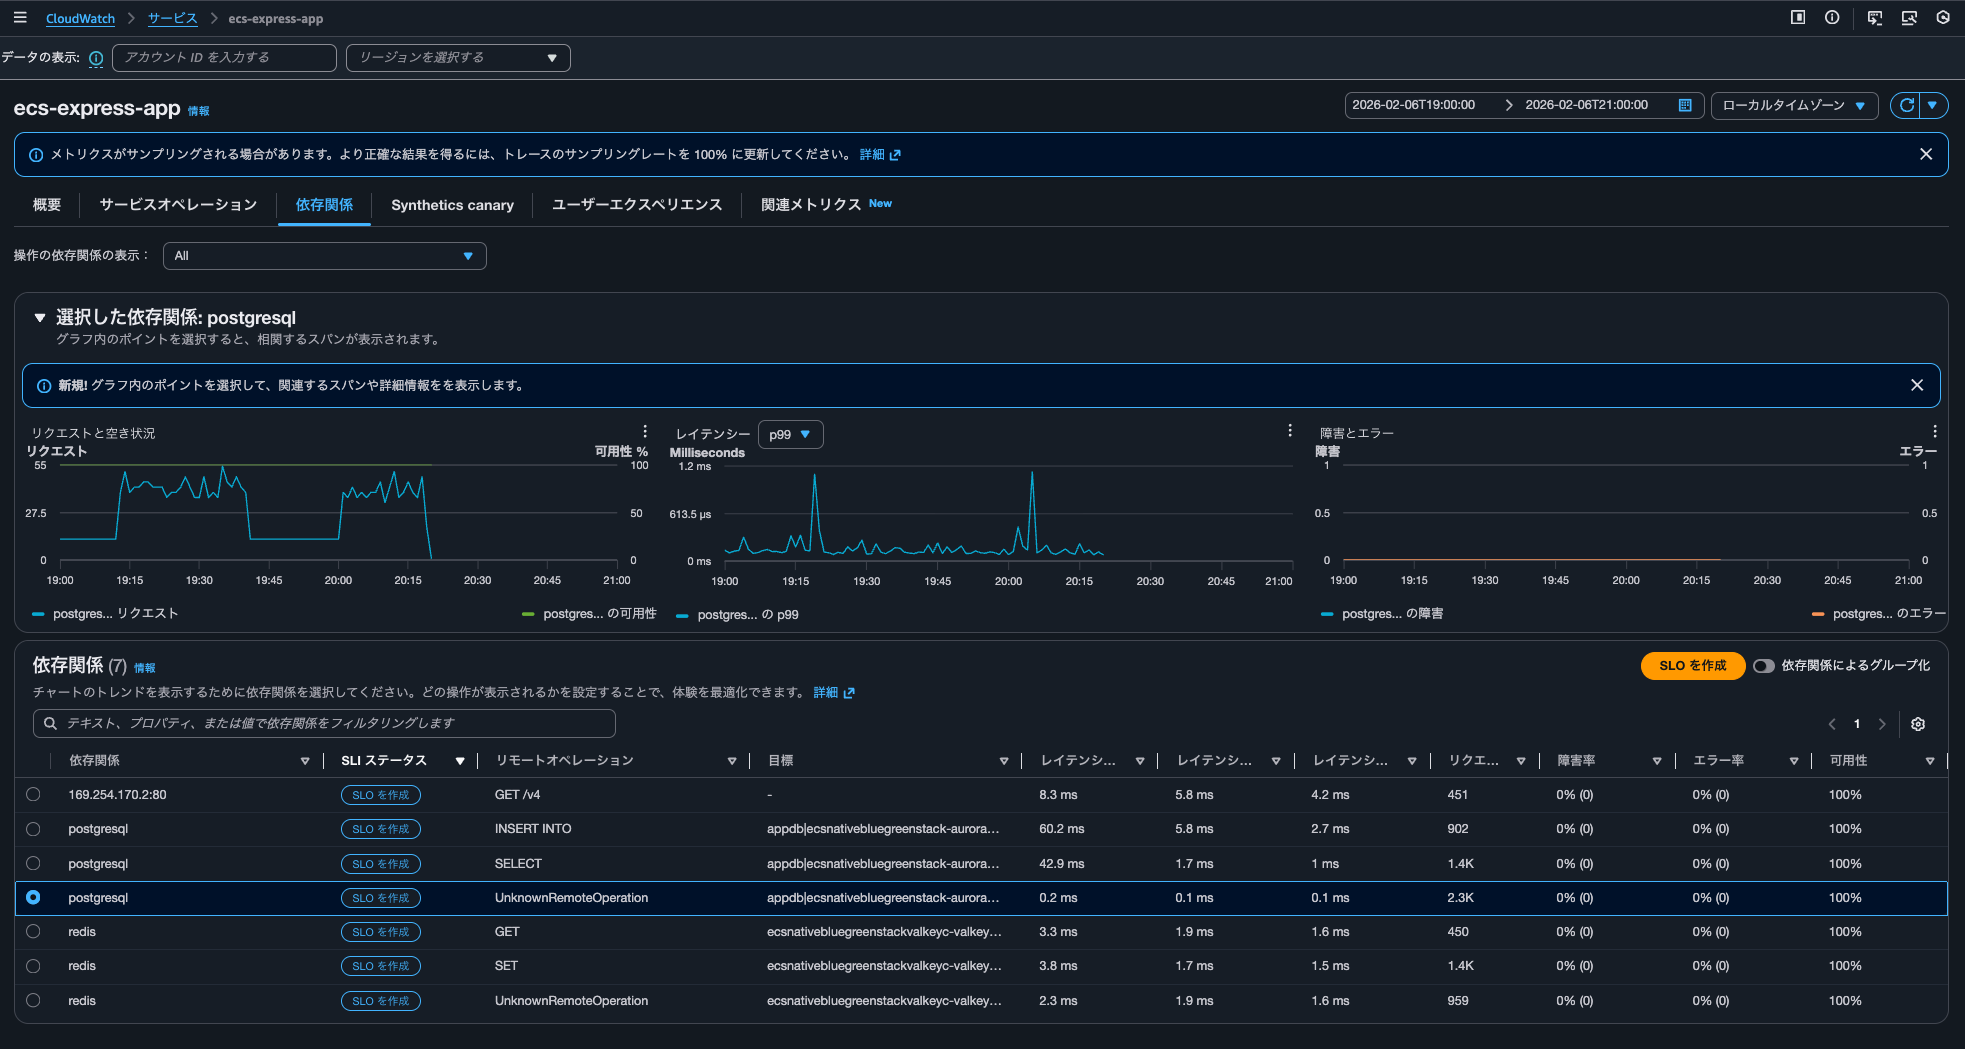
概要やサービスオペレーションの各メトリクスのグラフをクリックして相関スパンを表示するときはaws/spansにクエリを実行しており、依存関係タブから相関するスパンを表示する際には/aws/application-signals/dataへクエリすると認識しておくとよさそうです。
Transaction SearchのTrace indexing rateがApplication Signalsに直接的な影響を及ぼさない
Transaction SearchのTrace indexing rateはCloudWatch Application Signalsに何か影響を与えるのか検証してみました。
結論、直接的な影響は及ぼしません。
トレースはApplication SignalsやTransaction Search(実態はLogs Insights)で確認する運用とし、トレースのサマリで使用するトレースは数%分で十分であれば、その割合をTrace indexing rateに反映させると良いでしょう。
インデックスされたスパン数に応じて課金が発生します。コストが気になる場合は絞ってあげましょう。
Application Signals and transaction search (includes "golden metrics" and complete visibility into application transaction spans)
You are billed based on 1/ per GB of application metrics and spans ingested in CloudWatch, and 2/ per million spans indexed as X-Ray trace summaries, after the first 1% of spans indexed at no charge. This simplified bundled price is designed to capture all transactions records in a cost efficient manner. You also gain complete visibility into application transaction spans, automatic discovery and grouping of all your instrumented and un-instrumented services, automatic operational audits for application performance issues, and recent changes to your application.
See example 13 below to understand your potential charges.
Region: Asia Pacific (Tokyo)
項目 料金 First 10 TB of data ingested per month $0.35 per GB Next 20 TB of data ingested per month $0.20 per GB Over 30 TB of data ingested per month $0.15 per GB Spans indexed as X-Ray traces summaries $0.75 per million spans indexed after the first 1% of spans indexed at no charge
料金例も記載がありました。インデックスとは関係ないのですが、ログとして取り込まれたスパンには、CloudWatch Logsの取り込み料金は発生しないのは嬉しいですね。
Example 13 - Application observability: Application Signals and Transaction Search (includes "golden metrics" and complete visibility into application transaction spans)
This example assumes that you are not using the first time free trial (learn more about free trail in AWS Free Tier above).
If you monitor an application that generates 72 TB of spans per month, and index 2% of spans ingested.
.
.
(中略)
.
.
Monthly Indexed chargesAssuming 1 span = ~1kB, 72 TB translates to 72B spans per month. Since you are indexing only 2%, this translates to 1.44B spans. Since 1% of spans indexed are included in the monthly ingested charges, you only pay for 1% of 720M spans per month, instead of full 2% of 1.44B spans.
720M @$0.75 per million spans indexed = 720M * $0.75 = $540 per month
.
.
(中略)
.
.
Monthly Indexed spans chargesNo charges for indexed spans since 1% of spans indexed are included in the pricing model.
Note: Spans ingested as logs will not incur log ingestion pricing
ちなみに、クラスメソッドメンバーズポータルからApplication Signals関連の料金を確認すると以下のようになっていました。
| Type | Description | Quantity | Cost |
|---|---|---|---|
| USE1-Application-Signals-Bytes | $0.35 per GB of Application Signals data ingested for the first 10TB - US East (N. Virginia) | 0.21 | $0.0 |
| USE1-XRay-Spans-Indexed | $0.00000075 per spans indexed for USE1-XRay-Spans-Indexed in US East (N. Virginia) | 41,114.00 | $0.03 |
この記事が誰かの助けになれば幸いです。
以上、クラウド事業本部 コンサルティング部の のんピ(@non____97)でした!