![[Amazon FSx for NetApp ONTAP] SSDのサイズ縮小の裏側の処理を確認してみた](https://images.ctfassets.net/ct0aopd36mqt/wp-thumbnail-9e9d102dfa6d7896319b16fe069cdf55/c3bbbeab42ba5764c5a573e979719805/amazon-fsx-for-netapp-ontap)
[Amazon FSx for NetApp ONTAP] SSDのサイズ縮小の裏側の処理を確認してみた

SSDのサイズ縮小の裏側で何が起きているのか気になる
こんにちは、のんピ(@non____97)です。
皆さんはAmazon FSx for NetApp ONTAP(以降FSxN)のSSDのサイズ縮小の裏側で何が起きているのか気になったことはありますか? 私はあります。
以下記事で紹介されているとおり、第二世代ファイルシステムにおいてSSDサイズの縮小が行えるようなりました。
これはSSDのサイズ縮小の際には各HAペアにaggregateを追加し、古いaggregateから新しいaggregateにデータを転送するような形をとります。
ファイルシステムの SSD ストレージ容量を減らすと、Amazon FSx はファイルシステムの各 HA ペアに新しい小さなディスクのセット (集計) をアタッチします。次に、Amazon FSx はストレージ最適化プロセスをバックグラウンドで実行し、ボリュームごとに古いディスクから新しいディスクにデータを移動します。各ボリュームのデータが移動されると、Amazon FSx はクライアントアクセスを新しいディスク上のボリュームにリダイレクトします。その後、Amazon FSx はファイルシステムから古いディスクをデタッチします。
つまりは直接SSDサイズを縮小しているのではなく、新しく指定したサイズのSSDを割り当てて、そこにデータを移すような挙動をしているという訳です。
これはEBSボリュームのサイズを小さくしたい時にも取られる手法ですね。
FSxNについてはこの処理をマネージド かつ オンラインで対応してくれるという訳です。
FSxNの各種リソースの関係性が気になった方は以下記事をご覧ください。
実際に裏側でどのような処理が行われているのか自分の目で確かめたくなったので確認します。
いきなりまとめ
- SSDサイズ縮小時のONTAP内部で実行されている処理は以下のとおり
- fsxadminの権限制限設定
- ユーザーが誤って操作をすることを防ぐため
- ストレージディスク情報の定期取得
- ディスクの所有者割り当て
- aggr1_new 作成
- aggregate名の変更
- aggr1をSVMに関連付け
- aggr1を既存のFabricPoolのオブジェクトストレージに関連付け
volume move startによる各ボリュームのaggregateの移動- 移動前と同じ状態になるように各ボリュームのStorage Efficiencyの設定を変更
- aggr1_oldの削除
- 1で設定した権限制限を解除
- fsxadminの権限制限設定
- 縮小してもSnapshotは維持している
- 縮小してもStorage Efficiencyによるデータ削減量は維持されている
- SSDサイズ縮小時の主な注意点は以下
- SSDの縮小が可能なファイルシステムは第二世代ファイルシステムのみ
- SSDの縮小幅は最小でも現在のSSDサイズの9%以上である必要がある
- HAペアあたりの最小のSSDサイズは1,024GiB
- SSDに50TiB以上のデータを保存しているボリュームがある場合、HAペアごとに少なくとも1,547MBpsを設定する必要がある
- SSDに100TiB以上のデータを保存しているボリュームがある場合、HAペアごとに少なくとも3,072MBpsを設定する必要がある
- SSDに200TiB以上のデータを保存しているボリュームがある場合、HAペアごとに少なくとも6,144MBpsを設定する必要がある
- 以下の変更をした場合、以下に記載の変更を行う場合には6時間以上間隔を開ける必要がある
- SSDのサイズ変更
- SSDのIOPS変更
- スループットキャパシティの変更
- SSD縮小中は以下の操作ができない
- スループットキャパシティの縮小
- HAペアの追加
- SnapRetore
- ボリュームのオフライン化
- ボリュームの移動
- FlexCloneの作成
- SnapLockボリュームの作成
- Storage Efficiencyの変更
- SSD縮小処理中にSSD使用率が80%を超えた場合は一時的に縮小処理を中断する
- 使用率が80%を下回ったタイミングで自動的に再開する
- 書き込みが多いワークロードでは一時的にパフォーマンス低下が発生する可能性がある
- 新しいaggregateにリダイレクトする際に最大60秒のIO停止が発生する可能性がある
- 入れ替え時間はデータ量によって数時間から数日かかることがある
- SSD縮小処理中は以下が50%以下を維持することが望ましい
- CPU使用率
- ディスクスループット使用率
- SSD IOPS使用率
- FlexCloneボリュームを移動すると、FlexClone関係がスプリットされる
やってみた
検証環境
検証環境は以下のとおりです。
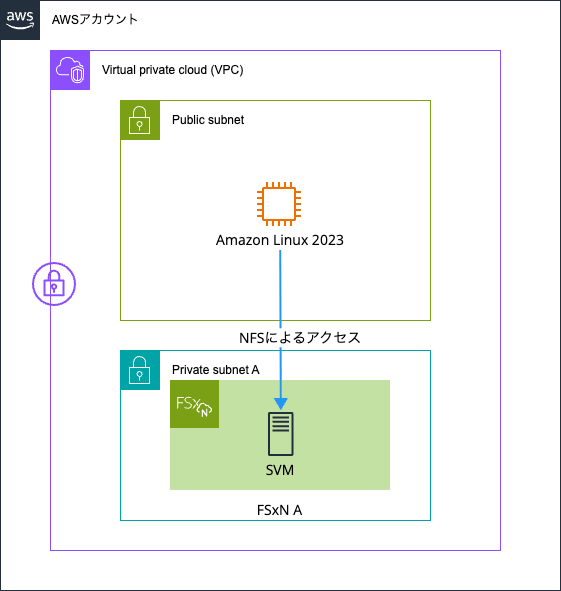
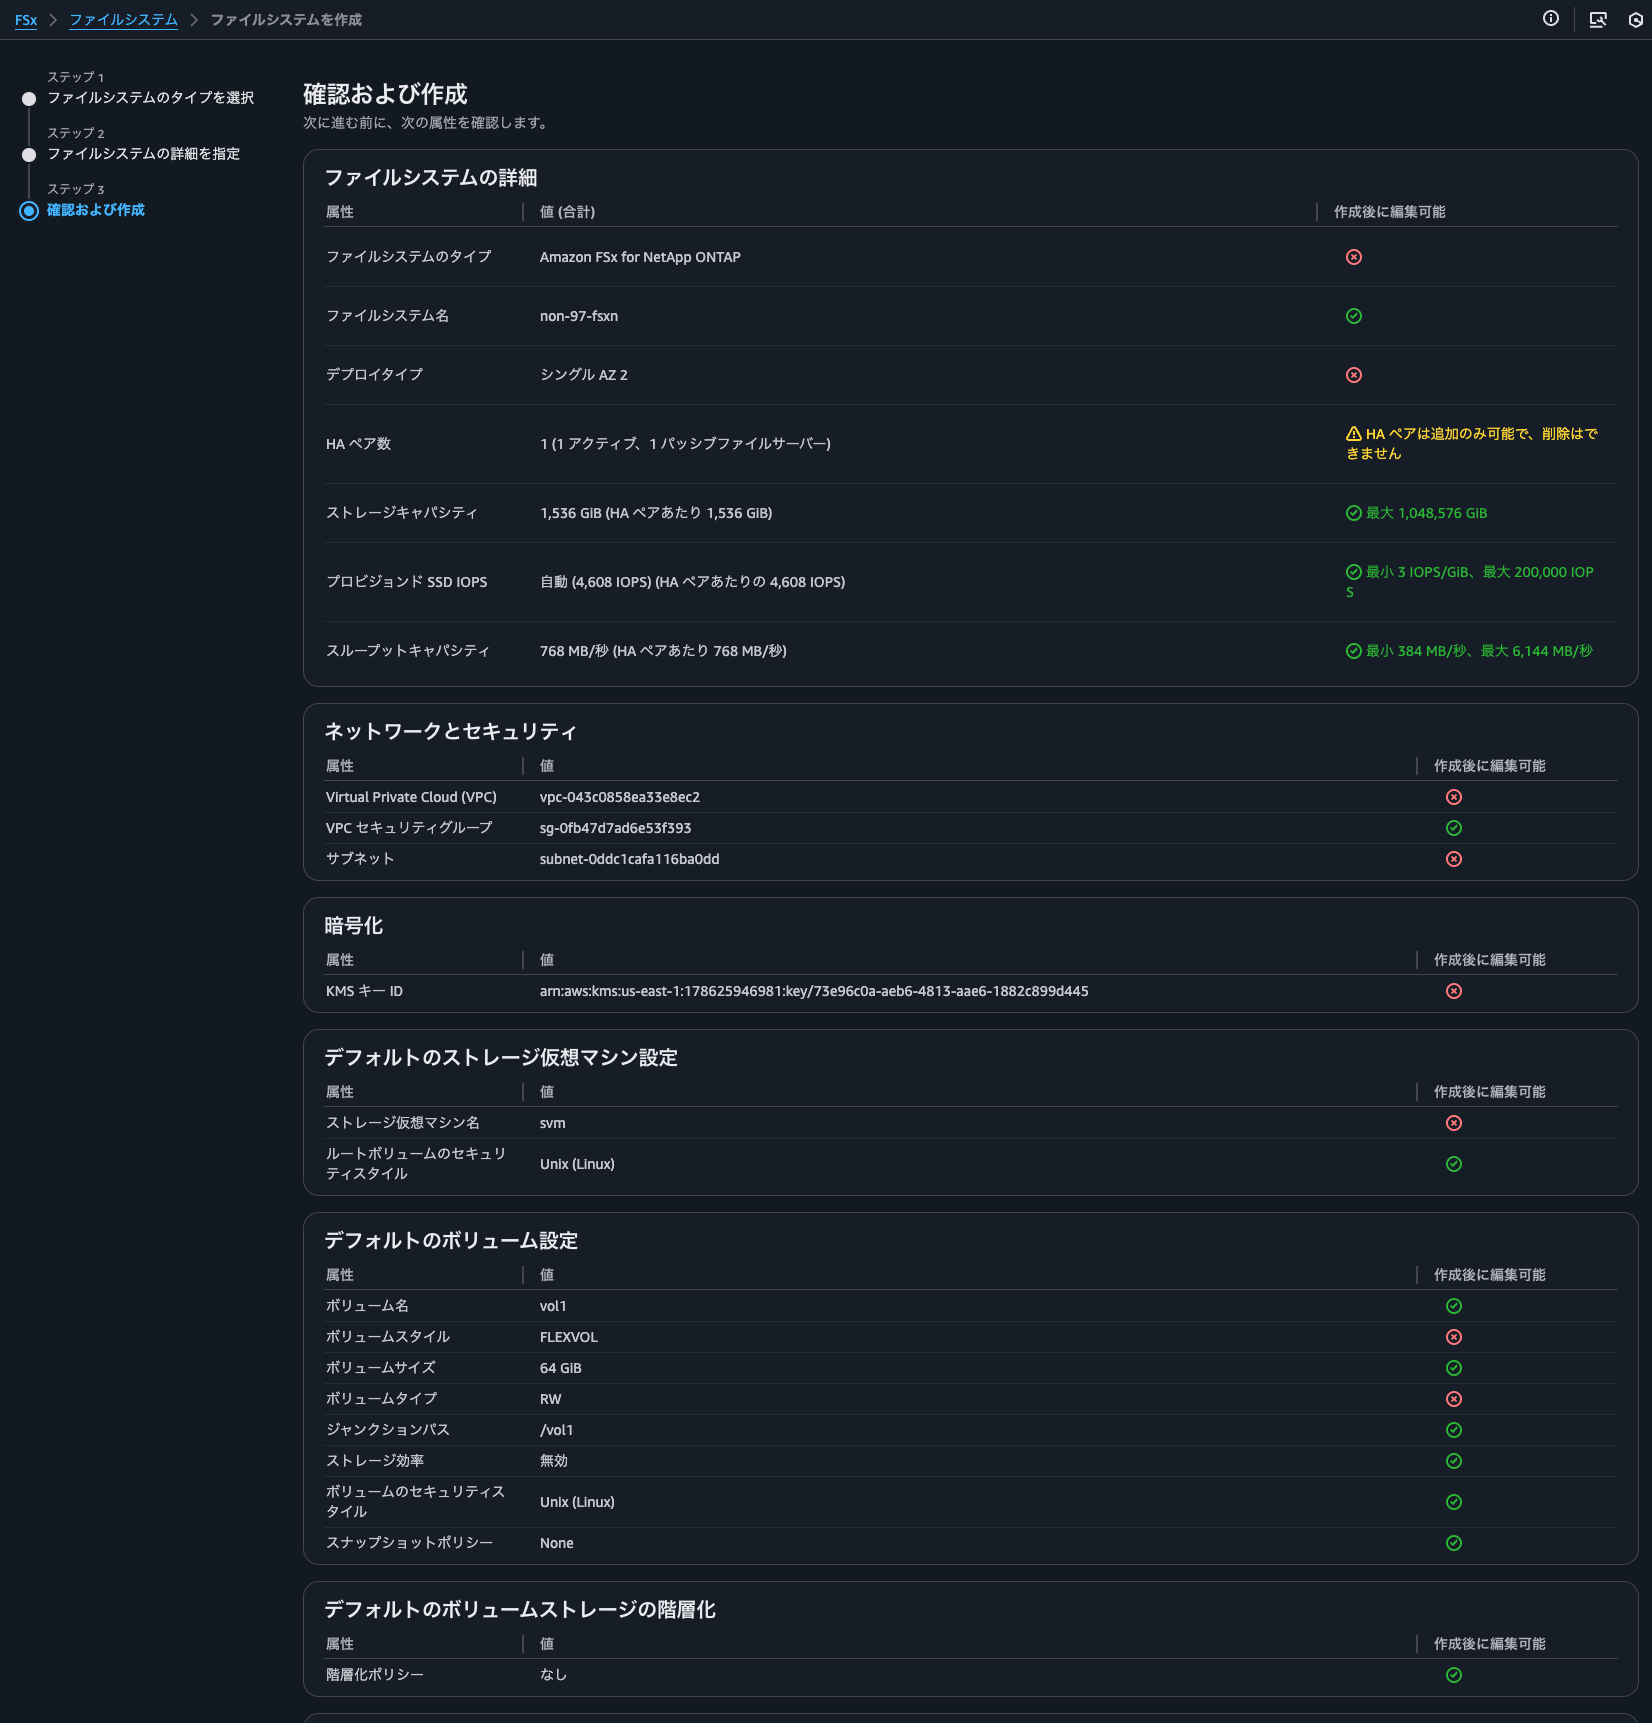
FSxNファイルシステム作成時の設定は以下のとおりです。
vol1とvol2という二つのボリュームを用意しました。
vol1はStorage Efficiencyが無効で、vol2は有効です。
			::*> version
NetApp Release 9.16.1P6: Wed Jul 16 03:10:07 UTC 2025

::*> set -prompt-timestamp inline

::*>
::*> volume efficiency show
Vserver    Volume           State     Status      Progress           Policy
---------- ---------------- --------- ----------- ------------------ ----------
svm        vol1             Disabled  Idle        Idle for 00:20:41  auto
svm        vol2             Enabled   Idle        Idle for 00:16:48  auto
2 entries were displayed.

::*> volume show -volume vol1,vol2 -fields available, filesystem-size, total, used, percent-used, performance-tier-inactive-user-data, performance-tier-inactive-user-data-percent, size, dedupe-space-saved, dedupe-space-saved-percent, dedupe-space-shared,logical-used, logical-used-percent,logical-used-by-afs, logical-available
vserver volume size available filesystem-size total   used  percent-used dedupe-space-saved dedupe-space-saved-percent dedupe-space-shared logical-used logical-used-percent logical-available logical-used-by-afs performance-tier-inactive-user-data performance-tier-inactive-user-data-percent
------- ------ ---- --------- --------------- ------- ----- ------------ ------------------ -------------------------- ------------------- ------------ -------------------- ----------------- ------------------- ----------------------------------- -------------------------------------------
svm     vol1   64GB 60.80GB   64GB            60.80GB 312KB 0%           0B                 0%                         0B                  312KB        0%      -                 312KB               0B                                  0%
svm     vol2   64GB 60.80GB   64GB            60.80GB 304KB 0%           0B                 0%                         0B                  304KB        0%      -                 304KB               0B                                  0%
2 entries were displayed.

::*> volume show-footprint -volume vol1,vol2

      Vserver : svm
      Volume  : vol1

      Feature                                         Used       Used%
      --------------------------------             ----------    -----
      Volume Data Footprint                              48KB       0%
             Footprint in Performance Tier             1.75MB     100%
             Footprint in FSxFabricpoolObjectStore         0B       0%
      Volume Guarantee                                     0B       0%
      Flexible Volume Metadata                        107.5MB       0%
      Delayed Frees                                    1.45MB       0%
      File Operation Metadata                             4KB       0%
      Total Metadata Footprint                        109.2MB       0%

      Total Footprint                                 109.2MB       0%

      Effective Total Footprint                       109.2MB       0%

      Vserver : svm
      Volume  : vol2

      Feature                                         Used       Used%
      --------------------------------             ----------    -----
      Volume Data Footprint                              40KB       0%
             Footprint in Performance Tier             1.02MB     100%
             Footprint in FSxFabricpoolObjectStore         0B       0%
      Volume Guarantee                                     0B       0%
      Flexible Volume Metadata                        107.5MB       0%
      Delayed Frees                                     736KB       0%
      File Operation Metadata                             4KB       0%
      Total Metadata Footprint                        108.4MB       0%

      Total Footprint                                 108.5MB       0%

      Effective Total Footprint                       108.5MB       0%
2 entries were displayed.

::*> aggr show-efficiency -instance

                             Name of the Aggregate: aggr1
                      Node where Aggregate Resides: FsxId01b393373937091ee-01
Logical Size Used by Volumes, Clones, Snapshot Copies in the Aggregate: 200KB
                               Total Physical Used: 128KB
                    Total Storage Efficiency Ratio: 1.56:1
Total Data Reduction Logical Used Without Snapshots: 200KB
Total Data Reduction Physical Used Without Snapshots: 128KB
Total Data Reduction Efficiency Ratio Without Snapshots: 1.56:1
Total Data Reduction Logical Used without snapshots and flexclones: 200KB
Total Data Reduction Physical Used without snapshots and flexclones: 128KB
Total Data Reduction Efficiency Ratio without snapshots and flexclones: 1.56:1
Total Logical Size Used by Volumes, Clones, Snapshot Copies in the FabricPool Performance Tier: 944KB
Total Physical Used in FabricPool Performance Tier: 8.80MB
Total FabricPool Performance Tier Storage Efficiency Ratio: 1.00:1
Total Data Reduction Logical Used without snapshots and flexclones in the FabricPool Performance Tier: 944KB
Total Data Reduction Physical Used without snapshots and flexclones in the FabricPool Performance Tier: 8.80MB
Total FabricPool Performance Tier Data Reduction Efficiency Ratio without snapshots and flexclones: 1.00:1
                Logical Space Used for All Volumes: 200KB
               Physical Space Used for All Volumes: 200KB
               Space Saved by Volume Deduplication: 0B
Space Saved by Volume Deduplication and pattern detection: 0B
                Volume Deduplication Savings ratio: 1.00:1
                 Space Saved by Volume Compression: 0B
                  Volume Compression Savings ratio: 1.00:1
      Space Saved by Inline Zero Pattern Detection: 0B
                    Volume Data Reduction SE Ratio: 1.00:1
               Logical Space Used by the Aggregate: 128KB
              Physical Space Used by the Aggregate: 128KB
           Space Saved by Aggregate Data Reduction: 0B
                 Aggregate Data Reduction SE Ratio: 1.00:1
              Logical Size Used by Snapshot Copies: 0B
             Physical Size Used by Snapshot Copies: 0B
              Snapshot Volume Data Reduction Ratio: 1.00:1
            Logical Size Used by FlexClone Volumes: 0B
          Physical Sized Used by FlexClone Volumes: 0B
             FlexClone Volume Data Reduction Ratio: 1.00:1
Snapshot And FlexClone Volume Data Reduction SE Ratio: 1.00:1
                         Number of Volumes Offline: 0
                    Number of SIS Disabled Volumes: 1
         Number of SIS Change Log Disabled Volumes: 1

::*> aggr show -fields availsize, usedsize, size, physical-used, physical-used-percent, data-compaction-space-saved, data-compaction-space-saved-percent, data-compacted-count, composite-capacity-tier-used, sis-space-saved, sis-space-saved-percent, sis-shared-count, inactive-data-reporting-start-timestamp
aggregate availsize size   usedsize physical-used physical-used-percent data-compaction-space-saved data-compaction-space-saved-percent data-compacted-count composite-capacity-tier-used sis-space-saved sis-space-saved-percent sis-shared-count inactive-data-reporting-start-timestamp
--------- --------- ------ -------- ------------- --------------------- --------------------------- ----------------------------------- -------------------- ---------------------------- --------------- ----------------------- ---------------- ---------------------------------------
aggr1     1.26TB    1.26TB 1.23GB   98.20MB       0%                    0B                          0%                                  0B                   0B                   0B              0%                      0B               -

::*> aggr show

Aggregate     Size Available Used% State   #Vols  Nodes            RAID Status
--------- -------- --------- ----- ------- ------ ---------------- ------------
aggr1       1.26TB    1.26TB    0% online       3 FsxId01b39337393 raid0,
                                                  7091ee-01        mirrored,
                                                                   normal

::*> aggr show-space

      Aggregate : aggr1
      Performance Tier
      Feature                                          Used      Used%
      --------------------------------           ----------     ------
      Volume Footprints                              1.22GB         0%
      Aggregate Metadata                             8.09MB         0%
      Snapshot Reserve                              68.03GB         5%
      Total Used                                    69.26GB         5%

      Total Physical Used                           98.20MB         0%

      Total Provisioned Space                         129GB         9%

      Aggregate : aggr1
      Object Store: FSxFabricpoolObjectStore
      Feature                                          Used      Used%
      --------------------------------           ----------     ------
      Logical Used                                       0B          -
      Logical Referenced Capacity                        0B          -
      Logical Unreferenced Capacity                      0B          -

      Total Physical Used                                0B          -
テスト用のファイルの用意
テスト用のファイルの用意をします。
まずは各ボリュームをマウントします。
			sh-5.2$ sudo mount -t nfs svm-0e6393c2b4e5e7bd2.fs-01b393373937091ee.fsx.us-east-1.amazonaws.com:/vol1 /mnt/fsxn/vol1
sh-5.2$ sudo mount -t nfs svm-0e6393c2b4e5e7bd2.fs-01b393373937091ee.fsx.us-east-1.amazonaws.com:/vol2 /mnt/fsxn/vol2
sh-5.2$ df -hT -t nfs4
Filesystem                                                                   Type  Size  Used Avail Use% Mounted on
svm-0e6393c2b4e5e7bd2.fs-01b393373937091ee.fsx.us-east-1.amazonaws.com:/vol1 nfs4   61G  320K   61G   1% /mnt/fsxn/vol1
svm-0e6393c2b4e5e7bd2.fs-01b393373937091ee.fsx.us-east-1.amazonaws.com:/vol2 nfs4   61G  320K   61G   1% /mnt/fsxn/vol2
テスト用ファイルを用意します。
			sh-5.2$ yes \
  $(base64 /dev/urandom -w 0 \
    | head -c 1K
  ) \
  | tr -d '\n' \
  | sudo dd of=/mnt/fsxn/vol1/1KB_random_pattern_text_block_4GiB_vol1 bs=1M count=4096 iflag=fullblock
4096+0 records in
4096+0 records out
4294967296 bytes (4.3 GB, 4.0 GiB) copied, 16.1282 s, 266 MB/s

sh-5.2$ yes \
  $(base64 /dev/urandom -w 0 \
    | head -c 1K
  ) \
  | tr -d '\n' \
  | sudo dd of=/mnt/fsxn/vol2/1KB_random_pattern_text_block_4GiB_vol2 bs=1M count=4096 iflag=fullblock
4096+0 records in
4096+0 records out
4294967296 bytes (4.3 GB, 4.0 GiB) copied, 15.9183 s, 270 MB/s

sh-5.2$ df -hT -t nfs4
Filesystem                                                                   Type  Size  Used Avail Use% Mounted on
svm-0e6393c2b4e5e7bd2.fs-01b393373937091ee.fsx.us-east-1.amazonaws.com:/vol1 nfs4   61G  4.1G   57G   7% /mnt/fsxn/vol1
svm-0e6393c2b4e5e7bd2.fs-01b393373937091ee.fsx.us-east-1.amazonaws.com:/vol2 nfs4   61G  2.7G   59G   5% /mnt/fsxn/vol2
TSSEによる重複排除や圧縮が効いているか確認をします。
			::*> volume show -volume vol1,vol2 -fields available, filesystem-size, total, used, percent-used, performance-tier-inactive-user-data, performance-tier-inactive-user-data-percent, size, dedupe-space-saved, dedupe-space-saved-percent, dedupe-space-shared,logical-used, logical-used-percent,logical-used-by-afs, logical-available
vserver volume size available filesystem-size total   used   percent-used dedupe-space-saved dedupe-space-saved-percent dedupe-space-shared logical-used logical-used-percent logical-available logical-used-by-afs performance-tier-inactive-user-data performance-tier-inactive-user-data-percent
------- ------ ---- --------- --------------- ------- ------ ------------ ------------------ -------------------------- ------------------- ------------ -------------------- ----------------- ------------------- ----------------------------------- -------------------------------------------
svm     vol1   64GB 56.78GB   64GB            60.80GB 4.02GB 6%           0B                 0%                         0B                  4.02GB       7%       -                 4.02GB              0B                                  0%
svm     vol2   64GB 58.13GB   64GB            60.80GB 2.67GB 4%           1.37GB             34%                        44KB                4.04GB       7%       -                 4.04GB              0B                                  0%
2 entries were displayed.

::*> volume show-footprint -volume vol1,vol2

      Vserver : svm
      Volume  : vol1

      Feature                                         Used       Used%
      --------------------------------             ----------    -----
      Volume Data Footprint                            4.02GB       0%
             Footprint in Performance Tier             4.02GB     100%
             Footprint in FSxFabricpoolObjectStore         0B       0%
      Volume Guarantee                                     0B       0%
      Flexible Volume Metadata                        107.5MB       0%
      Delayed Frees                                    3.93MB       0%
      File Operation Metadata                             4KB       0%
      Total Metadata Footprint                        112.9MB       0%

      Total Footprint                                  4.13GB       0%

      Effective Total Footprint                        4.13GB       0%

      Vserver : svm
      Volume  : vol2

      Feature                                         Used       Used%
      --------------------------------             ----------    -----
      Volume Data Footprint                            2.64GB       0%
             Footprint in Performance Tier             2.67GB     100%
             Footprint in FSxFabricpoolObjectStore         0B       0%
      Volume Guarantee                                     0B       0%
      Flexible Volume Metadata                        107.5MB       0%
      Delayed Frees                                    4.45MB       0%
      File Operation Metadata                             4KB       0%
      Total Metadata Footprint                        139.4MB       0%

      Total Footprint                                  2.78GB       0%

      Effective Total Footprint                        2.78GB       0%
2 entries were displayed.

::*> aggr show-efficiency -instance

                             Name of the Aggregate: aggr1
                      Node where Aggregate Resides: FsxId01b393373937091ee-01
Logical Size Used by Volumes, Clones, Snapshot Copies in the Aggregate: 8.03GB
                               Total Physical Used: 6.66GB
                    Total Storage Efficiency Ratio: 1.21:1
Total Data Reduction Logical Used Without Snapshots: 8.03GB
Total Data Reduction Physical Used Without Snapshots: 6.66GB
Total Data Reduction Efficiency Ratio Without Snapshots: 1.21:1
Total Data Reduction Logical Used without snapshots and flexclones: 8.03GB
Total Data Reduction Physical Used without snapshots and flexclones: 6.66GB
Total Data Reduction Efficiency Ratio without snapshots and flexclones: 1.21:1
Total Logical Size Used by Volumes, Clones, Snapshot Copies in the FabricPool Performance Tier: 8.06GB
Total Physical Used in FabricPool Performance Tier: 6.71GB
Total FabricPool Performance Tier Storage Efficiency Ratio: 1.20:1
Total Data Reduction Logical Used without snapshots and flexclones in the FabricPool Performance Tier: 8.06GB
Total Data Reduction Physical Used without snapshots and flexclones in the FabricPool Performance Tier: 6.71GB
Total FabricPool Performance Tier Data Reduction Efficiency Ratio without snapshots and flexclones: 1.20:1
                Logical Space Used for All Volumes: 8.03GB
               Physical Space Used for All Volumes: 6.66GB
               Space Saved by Volume Deduplication: 1.37GB
Space Saved by Volume Deduplication and pattern detection: 1.37GB
                Volume Deduplication Savings ratio: 1.21:1
                 Space Saved by Volume Compression: 0B
                  Volume Compression Savings ratio: 1.00:1
      Space Saved by Inline Zero Pattern Detection: 0B
                    Volume Data Reduction SE Ratio: 1.21:1
               Logical Space Used by the Aggregate: 6.66GB
              Physical Space Used by the Aggregate: 6.66GB
           Space Saved by Aggregate Data Reduction: 0B
                 Aggregate Data Reduction SE Ratio: 1.00:1
              Logical Size Used by Snapshot Copies: 0B
             Physical Size Used by Snapshot Copies: 0B
              Snapshot Volume Data Reduction Ratio: 1.00:1
            Logical Size Used by FlexClone Volumes: 0B
          Physical Sized Used by FlexClone Volumes: 0B
             FlexClone Volume Data Reduction Ratio: 1.00:1
Snapshot And FlexClone Volume Data Reduction SE Ratio: 1.00:1
                         Number of Volumes Offline: 0
                    Number of SIS Disabled Volumes: 1
         Number of SIS Change Log Disabled Volumes: 1

::*> aggr show -fields availsize, usedsize, size, physical-used, physical-used-percent, data-compaction-space-saved, data-compaction-space-saved-percent, data-compacted-count, composite-capacity-tier-used, sis-space-saved, sis-space-saved-percent, sis-shared-count, inactive-data-reporting-start-timestamp
aggregate availsize size   usedsize physical-used physical-used-percent data-compaction-space-saved data-compaction-space-saved-percent data-compacted-count composite-capacity-tier-used sis-space-saved sis-space-saved-percent sis-shared-count inactive-data-reporting-start-timestamp
--------- --------- ------ -------- ------------- --------------------- --------------------------- ----------------------------------- -------------------- ---------------------------- --------------- ----------------------- ---------------- ---------------------------------------
aggr1     1.25TB    1.26TB 7.93GB   6.85GB        1%                    0B                          0%                                  0B                   0B                   0B              0%                      0B               -

::*> aggr show-space

      Aggregate : aggr1
      Performance Tier
      Feature                                          Used      Used%
      --------------------------------           ----------     ------
      Volume Footprints                              7.91GB         1%
      Aggregate Metadata                            13.91MB         0%
      Snapshot Reserve                              68.03GB         5%
      Total Used                                    75.96GB         6%

      Total Physical Used                            6.85GB         1%

      Total Provisioned Space                         129GB         9%

      Aggregate : aggr1
      Object Store: FSxFabricpoolObjectStore
      Feature                                          Used      Used%
      --------------------------------           ----------     ------
      Logical Used                                       0B          -
      Logical Referenced Capacity                        0B          -
      Logical Unreferenced Capacity                      0B          -

      Total Physical Used                                0B          -

2 entries were displayed.
Storage Efficiencyを有効化したvol2で1.37GBほど重複排除によって削減されているようですね。
以下記事で紹介されているように、Footprint Data Reduction by Auto Adaptive Compressionはなく、data-compaction-space-saveも0であることから圧縮やコンパクションは特に効いていないように見えます。
SSD縮小中の制約事項の中にSnapRestoreができないというものがあります。
事前にSnapshotを取得しておきましょう。
			::*> snapshot create -volume vol1 -vserver svm -snapshot test.2025-09-23_1457

::*> snapshot show
                                                                 ---Blocks---
Vserver  Volume   Snapshot                                  Size Total% Used%
-------- -------- ------------------------------------- -------- ------ -----
svm      vol1
                  test.2025-09-23_1457                        0B     0%    0%
SSDの縮小
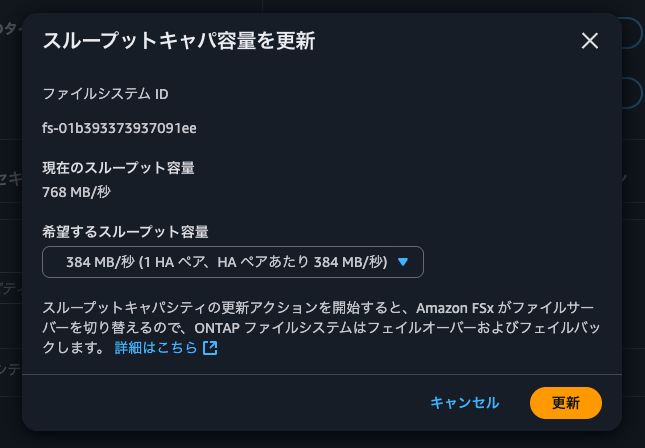
それではSSDの縮小を実施します。
今回はパーセンテージで指定しました。SSDサイズは1,024から1,397GiBです。1,397GiBというのは現在のSSDサイズの91%分のサイズで、AWS公式ドキュメントで紹介されているとおりです。
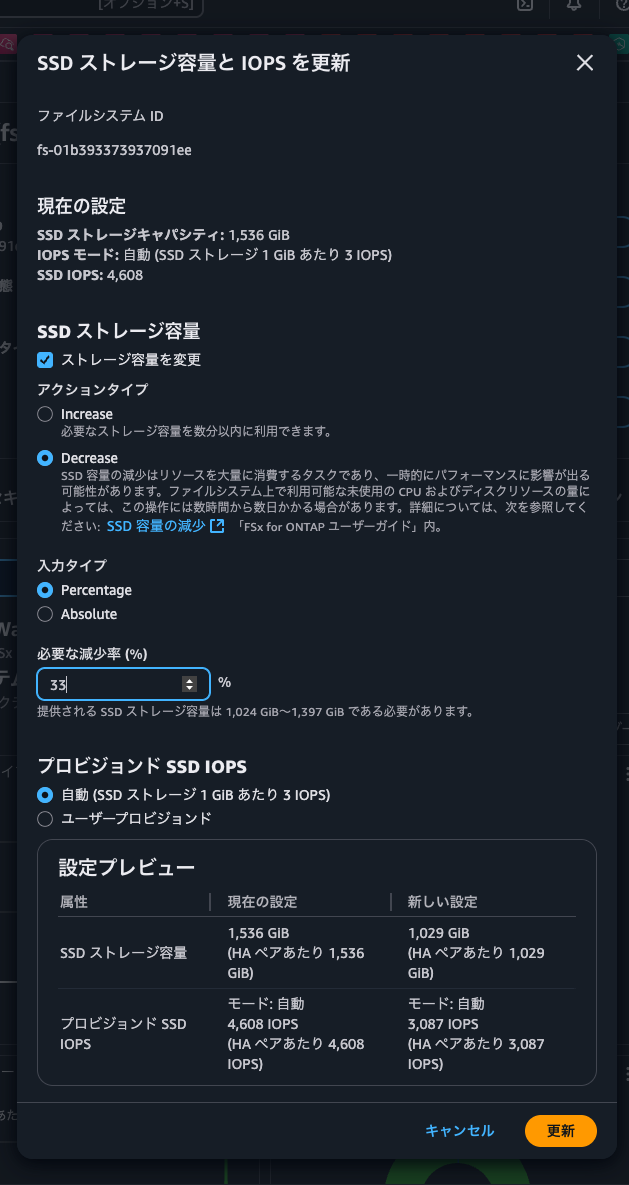
IOPSのサイズも変動することが分かりますね。
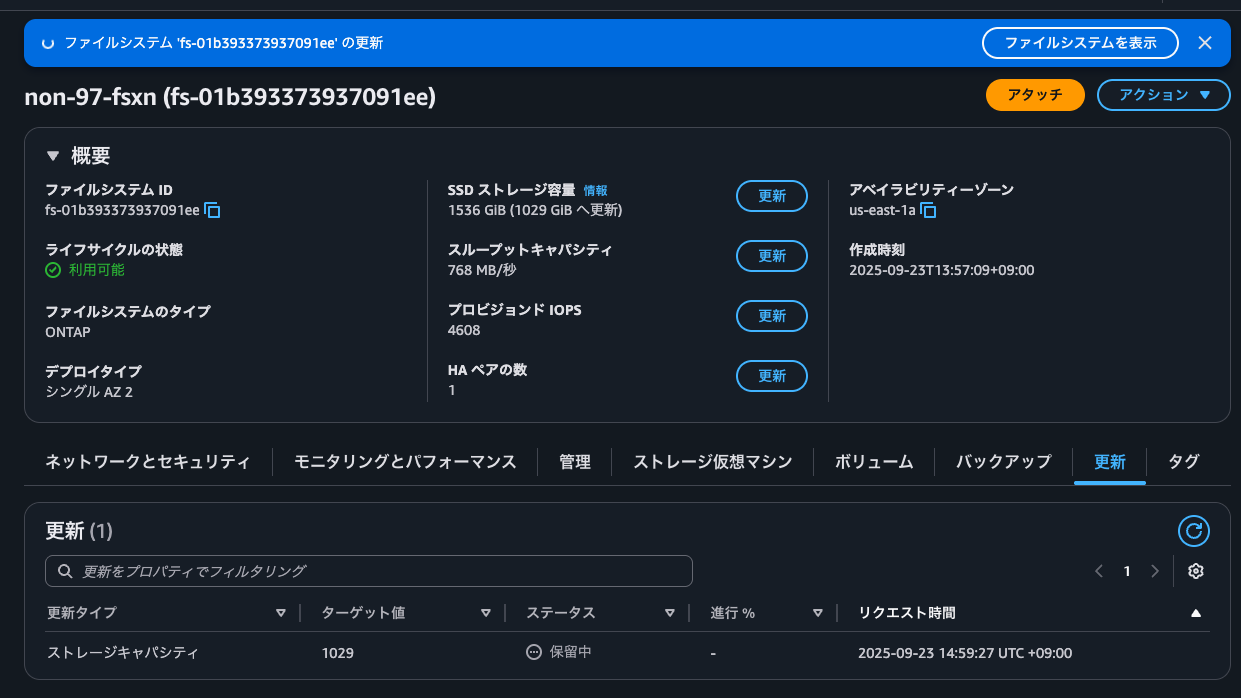
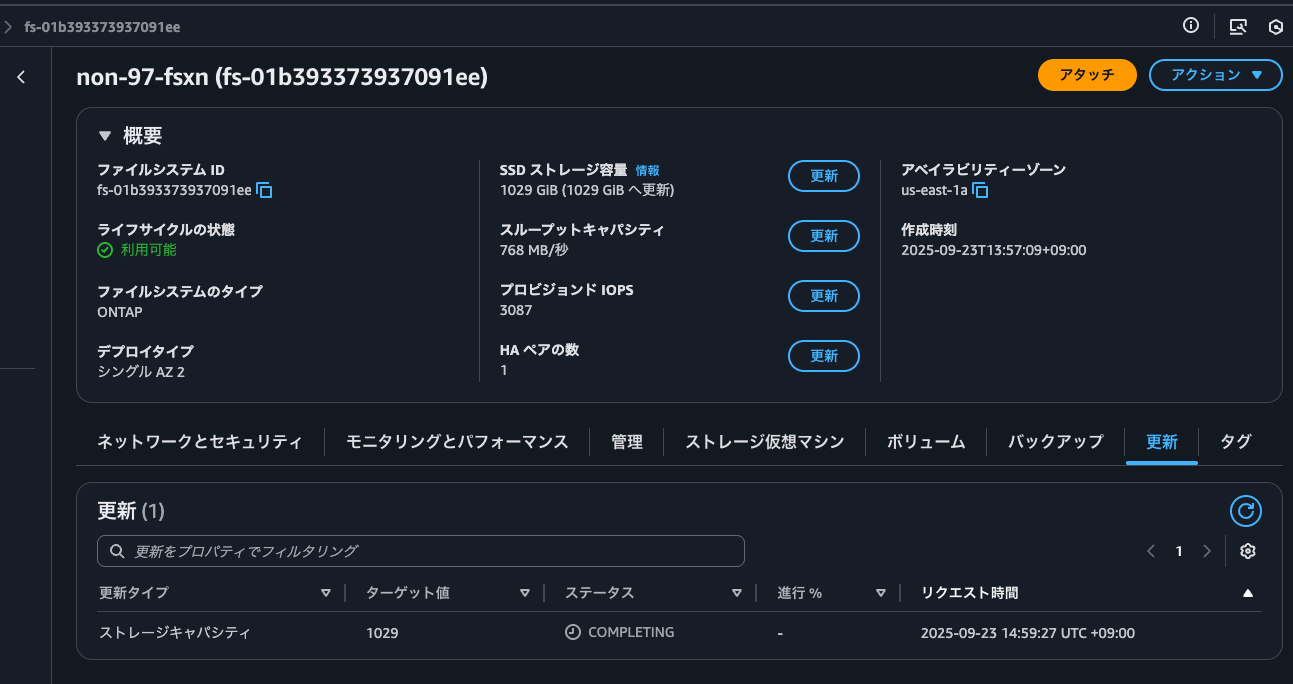
更新をクリックすると、ターゲット値を1024としたストレージキャパシティの更新イベントが追加されました。
SSDの縮小を開始して2分ほど経つとaggregateが追加されていました。
			::*> aggr show -fields availsize, usedsize, size, physical-used, physical-used-percent, data-compaction-space-saved, data-compaction-space-saved-percent, data-compacted-count, composite-capacity-tier-used, sis-space-saved, sis-space-saved-percent, sis-shared-count, inactive-data-reporting-start-timestamp
aggregate availsize size    usedsize physical-used physical-used-percent data-compaction-space-saved data-compaction-space-saved-percent data-compacted-count composite-capacity-tier-used sis-space-saved sis-space-saved-percent sis-shared-count inactive-data-reporting-start-timestamp
--------- --------- ------- -------- ------------- --------------------- --------------------------- ----------------------------------- -------------------- ---------------------------- --------------- ----------------------- ---------------- ---------------------------------------
aggr1     868.4GB   868.4GB 804KB    1.14MB        0%                    0B                          0%                                  0B                   0B                  0B              0%                      0B               -
aggr1_old 1.25TB    1.26TB  7.93GB   6.90GB        1%                    0B                          0%                                  0B                   0B                  0B              0%                      0B               -
2 entries were displayed.

::*> aggr show-space

      Aggregate : aggr1

      Feature                                          Used      Used%
      --------------------------------           ----------     ------
      Volume Footprints                                  0B         0%
      Aggregate Metadata                              804KB         0%
      Snapshot Reserve                              45.71GB         5%
      Total Used                                    45.71GB         5%

      Total Physical Used                            1.14MB         0%

      Total Provisioned Space                            0B         0%

      Aggregate : aggr1_old
      Performance Tier
      Feature                                          Used      Used%
      --------------------------------           ----------     ------
      Volume Footprints                              7.91GB         1%
      Aggregate Metadata                            18.43MB         0%
      Snapshot Reserve                              68.03GB         5%
      Total Used                                    75.96GB         6%

      Total Physical Used                            6.90GB         1%

      Total Provisioned Space                         129GB         9%

      Aggregate : aggr1_old
      Object Store: FSxFabricpoolObjectStore
      Feature                                          Used      Used%
      --------------------------------           ----------     ------
      Logical Used                                       0B          -
      Logical Referenced Capacity                        0B          -
      Logical Unreferenced Capacity                      0B          -

      Total Physical Used                                0B          -

3 entries were displayed.

::*> aggr show

Aggregate     Size Available Used% State   #Vols  Nodes            RAID Status
--------- -------- --------- ----- ------- ------ ---------------- ------------
aggr1      868.4GB   868.4GB    0% online       0 FsxId01b39337393 raid0,
                                                  7091ee-01        mirrored,
                                                                   normal
aggr1_old   1.26TB    1.25TB    1% online       3 FsxId01b39337393 raid0,
                                                  7091ee-01        mirrored,
                                                                   normal
2 entries were displayed.
新しいaggregateのサイズは確かに小さくなっていますね。
さらに数分待つと、古いaggregate(aggr1_old)から新しいaggregate(aggr1)にボリュームが移動していることが分かりました。
			::*> aggr show

Aggregate     Size Available Used% State   #Vols  Nodes            RAID Status
--------- -------- --------- ----- ------- ------ ---------------- ------------
aggr1      868.4GB   865.6GB    0% online       1 FsxId01b39337393 raid0,
                                                  7091ee-01        mirrored,
                                                                   normal
aggr1_old   1.26TB    1.25TB    1% online       3 FsxId01b39337393 raid0,
                                                  7091ee-01        mirrored,
                                                                   normal

::*> volume show -fields aggregate
vserver volume   aggregate
------- -------- ---------
svm     svm_root aggr1_old
svm     vol1     aggr1_old
svm     vol2     aggr1
3 entries were displayed.
SSD縮小中の操作
SSD縮小中に色々と操作をしてみます。
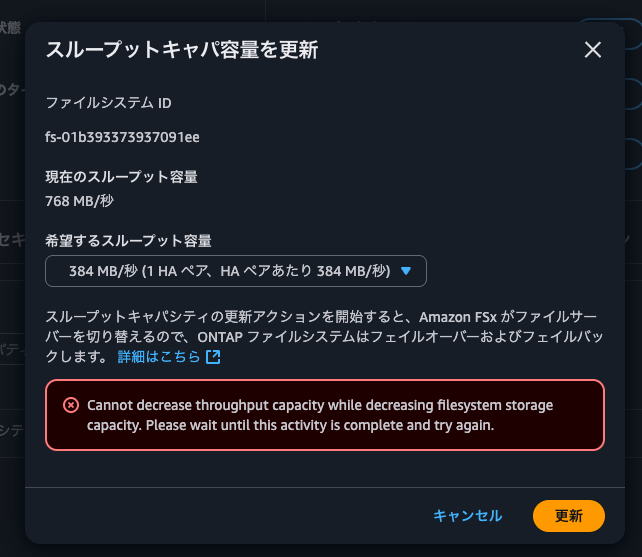
まずは、スループットキャパシティの増強です。
増強しようとすると以下のようにCannot decrease throughput capacity while decreasing filesystem storage capacity. Please wait until this activity is complete and try againとエラーになりました。
続いて、SnapRestoreです。
			::*> snapshot restore -vserver svm -volume vol1 -snapshot test.2025-09-23_1457

Warning: Quota rules currently enforced on volume "vol1" might change during this operation. If the currently enforced quota rules are different from those in snapshot
         "test.2025-09-23_1457", you might have to resize or reinitialize quotas on this volume after this operation.
Do you want to continue? {y|n}: y

Warning: Export policies currently enforced on the qtrees of volume "vol1" will not change during this operation. If the currently enforced export policies are
         different from those in snapshot "test.2025-09-23_1457", reassign the export policies of the qtrees on this volume after this operation.
Do you want to continue? {y|n}: y

Error: command failed: Failed to promote snapshot "test.2025-09-23_1457" because one or more newer snapshots are currently used as a reference snapshot for data
       protection operations: ref_ss_volmove_51_1758607493_0, ref_ss_volmove_51_1758607504_2.

::*> snapshot show
                                                                 ---Blocks---
Vserver  Volume   Snapshot                                  Size Total% Used%
-------- -------- ------------------------------------- -------- ------ -----
svm      svm_root
                  hourly.2025-09-23_0605                   136KB     0%   39%
         vol1
                  test.2025-09-23_1457                     200KB     0%    0%
2 entries were displayed.
どうやら裏側でSnapshotが取得されている関係上、SnapRestoreできないようです。
ちなみに、特にSnapMirror relationshipは作成されていませんでした。
			::*> snapmirror show
This table is currently empty.

::*> snapmirror list-destinations
This table is currently empty.
もう一度SnapRestoreをしてみます。
			::*> aggr show

Aggregate     Size Available Used% State   #Vols  Nodes            RAID Status
--------- -------- --------- ----- ------- ------ ---------------- ------------
aggr1      868.4GB   861.5GB    1% online       2 FsxId01b39337393 raid0,
                                                  7091ee-01        mirrored,
                                                                   normal
aggr1_old   1.26TB    1.26TB    0% online       1 FsxId01b39337393 raid0,
                                                  7091ee-01        mirrored,
                                                                   normal
2 entries were displayed.

::*> snapshot restore -vserver svm -volume vol1 -snapshot test.2025-09-23_1457

Warning: Quota rules currently enforced on volume "vol1" might change during this operation. If the currently enforced quota rules are different from those in snapshot
         "test.2025-09-23_1457", you might have to resize or reinitialize quotas on this volume after this operation.
Do you want to continue? {y|n}: y

Warning: Export policies currently enforced on the qtrees of volume "vol1" will not change during this operation. If the currently enforced export policies are
         different from those in snapshot "test.2025-09-23_1457", reassign the export policies of the qtrees on this volume after this operation.
Do you want to continue? {y|n}: y
今度は正常に行えました。
ということはSSDの縮小が完了していそうです。
SSD縮小完了確認
SSD縮小が完了しているか確認します。
			::*> volume show -fields aggregate
vserver volume   aggregate
------- -------- ---------
svm     svm_root aggr1
svm     vol1     aggr1
svm     vol2     aggr1
3 entries were displayed.

::*> aggr show

Aggregate     Size Available Used% State   #Vols  Nodes            RAID Status
--------- -------- --------- ----- ------- ------ ---------------- ------------
aggr1      868.4GB   860.5GB    1% online       3 FsxId01b39337393 raid0,
                                                  7091ee-01        mirrored,
                                                                   normal
aggr1_old   1.26TB    1.26TB    0% online       0 FsxId01b39337393 raid0,
                                                  7091ee-01        mirrored,
                                                                   normal
2 entries were displayed.
全ボリュームが新しいaggregateに移動していそうですが、まだ古いaggregateは残っていますね。
マネジメントコンソール上もCOMPLETINGとなっていました。
しばらく待つと完了になりました。トータルで19分程度でした。
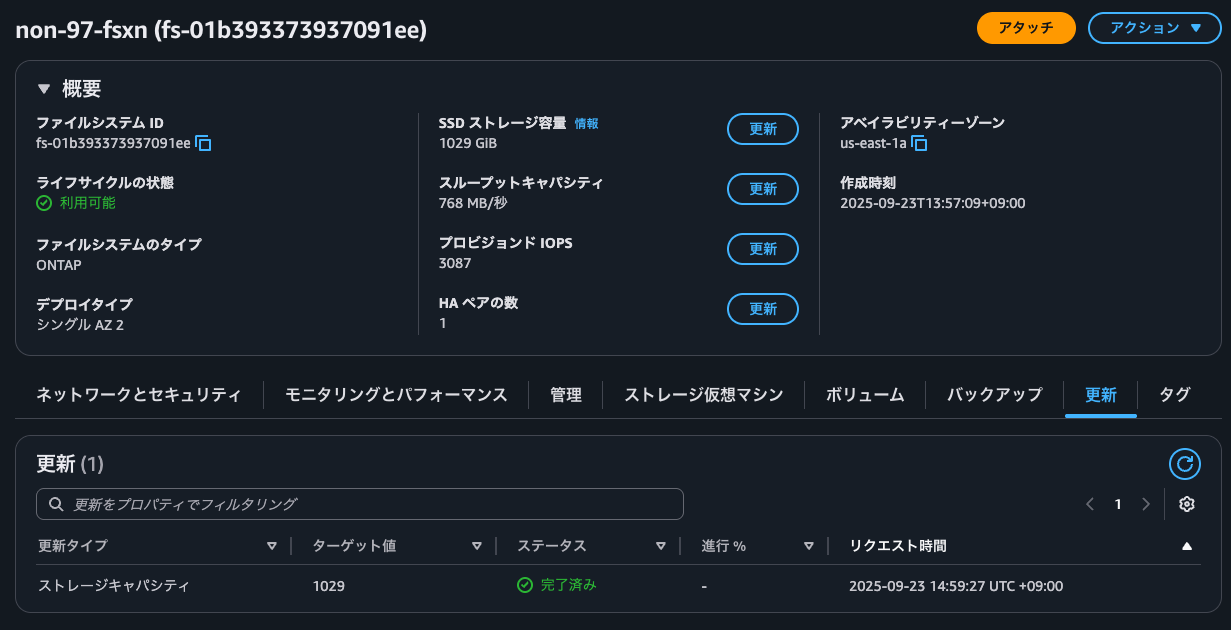
この時のONTAPの状態を確認します。
			::*> aggr show

Aggregate     Size Available Used% State   #Vols  Nodes            RAID Status
--------- -------- --------- ----- ------- ------ ---------------- ------------
aggr1      868.4GB   860.5GB    1% online       3 FsxId01b39337393 raid0,
                                                  7091ee-01        mirrored,
                                                                   normal
::*> snapshot show
                                                                 ---Blocks---
Vserver  Volume   Snapshot                                  Size Total% Used%
-------- -------- ------------------------------------- -------- ------ -----
svm      svm_root
                  hourly.2025-09-23_0605                   144KB     0%   24%
         vol1
                  test.2025-09-23_1457                     168KB     0%    0%
2 entries were displayed.

::*> volume show -volume vol1,vol2 -fields available, filesystem-size, total, used, percent-used, performance-tier-inactive-user-data, performance-tier-inactive-user-data-percent, size, dedupe-space-saved, dedupe-space-saved-percent, dedupe-space-shared,logical-used, logical-used-percent,logical-used-by-afs, logical-available
vserver volume size available filesystem-size total   used   percent-used dedupe-space-saved dedupe-space-saved-percent dedupe-space-shared logical-used logical-used-percent logical-available logical-used-by-afs performance-tier-inactive-user-data performance-tier-inactive-user-data-percent
------- ------ ---- --------- --------------- ------- ------ ------------ ------------------ -------------------------- ------------------- ------------ -------------------- ----------------- ------------------- ----------------------------------- -------------------------------------------
svm     vol1   64GB 56.78GB   64GB            60.80GB 4.02GB 6%           0B                 0%                         0B                  4.02GB       7%     -                 4.02GB              0B                                  0%
svm     vol2   64GB 58.13GB   64GB            60.80GB 2.67GB 4%           1.37GB             34%                        44KB                4.04GB       7%     -                 4.04GB              0B                                  0%
2 entries were displayed.

::*> volume show-footprint -volume vol1,vol2

      Vserver : svm
      Volume  : vol1

      Feature                                         Used       Used%
      --------------------------------             ----------    -----
      Volume Data Footprint                            4.01GB       0%
             Footprint in Performance Tier             4.02GB     100%
             Footprint in FSxFabricpoolObjectStore         0B       0%
      Volume Guarantee                                     0B       0%
      Flexible Volume Metadata                        107.5MB       0%
      Delayed Frees                                     856KB       0%
      File Operation Metadata                             4KB       0%
      Total Metadata Footprint                        111.6MB       0%

      Total Footprint                                  4.12GB       0%

      Effective Total Footprint                        4.12GB       0%

      Vserver : svm
      Volume  : vol2

      Feature                                         Used       Used%
      --------------------------------             ----------    -----
      Volume Data Footprint                            2.64GB       0%
             Footprint in Performance Tier             2.67GB     100%
             Footprint in FSxFabricpoolObjectStore         0B       0%
      Volume Guarantee                                     0B       0%
      Flexible Volume Metadata                        107.5MB       0%
      Delayed Frees                                    1.48MB       0%
      File Operation Metadata                             4KB       0%
      Total Metadata Footprint                        136.9MB       0%

      Total Footprint                                  2.77GB       0%

      Effective Total Footprint                        2.77GB       0%
2 entries were displayed.

::*> aggr show-efficiency -instance

                             Name of the Aggregate: aggr1
                      Node where Aggregate Resides: FsxId01b393373937091ee-01
Logical Size Used by Volumes, Clones, Snapshot Copies in the Aggregate: 12.05GB
                               Total Physical Used: 6.66GB
                    Total Storage Efficiency Ratio: 1.81:1
Total Data Reduction Logical Used Without Snapshots: 8.03GB
Total Data Reduction Physical Used Without Snapshots: 6.66GB
Total Data Reduction Efficiency Ratio Without Snapshots: 1.21:1
Total Data Reduction Logical Used without snapshots and flexclones: 8.03GB
Total Data Reduction Physical Used without snapshots and flexclones: 6.66GB
Total Data Reduction Efficiency Ratio without snapshots and flexclones: 1.21:1
Total Logical Size Used by Volumes, Clones, Snapshot Copies in the FabricPool Performance Tier: 12.08GB
Total Physical Used in FabricPool Performance Tier: 6.71GB
Total FabricPool Performance Tier Storage Efficiency Ratio: 1.80:1
Total Data Reduction Logical Used without snapshots and flexclones in the FabricPool Performance Tier: 8.06GB
Total Data Reduction Physical Used without snapshots and flexclones in the FabricPool Performance Tier: 6.71GB
Total FabricPool Performance Tier Data Reduction Efficiency Ratio without snapshots and flexclones: 1.20:1
                Logical Space Used for All Volumes: 8.03GB
               Physical Space Used for All Volumes: 6.66GB
               Space Saved by Volume Deduplication: 1.37GB
Space Saved by Volume Deduplication and pattern detection: 1.37GB
                Volume Deduplication Savings ratio: 1.21:1
                 Space Saved by Volume Compression: 0B
                  Volume Compression Savings ratio: 1.00:1
      Space Saved by Inline Zero Pattern Detection: 0B
                    Volume Data Reduction SE Ratio: 1.21:1
               Logical Space Used by the Aggregate: 6.66GB
              Physical Space Used by the Aggregate: 6.66GB
           Space Saved by Aggregate Data Reduction: 0B
                 Aggregate Data Reduction SE Ratio: 1.00:1
              Logical Size Used by Snapshot Copies: 4.02GB
             Physical Size Used by Snapshot Copies: 312KB
              Snapshot Volume Data Reduction Ratio: 13502.65:1
            Logical Size Used by FlexClone Volumes: 0B
          Physical Sized Used by FlexClone Volumes: 0B
             FlexClone Volume Data Reduction Ratio: 1.00:1
Snapshot And FlexClone Volume Data Reduction SE Ratio: 13502.65:1
                         Number of Volumes Offline: 0
                    Number of SIS Disabled Volumes: 1
         Number of SIS Change Log Disabled Volumes: 1

::*> aggr show -fields availsize, usedsize, size, physical-used, physical-used-percent, data-compaction-space-saved, data-compaction-space-saved-percent, data-compacted-count, composite-capacity-tier-used, sis-space-saved, sis-space-saved-percent, sis-shared-count, inactive-data-reporting-start-timestamp
aggregate availsize size    usedsize physical-used physical-used-percent data-compaction-space-saved data-compaction-space-saved-percent data-compacted-count composite-capacity-tier-used sis-space-saved sis-space-saved-percent sis-shared-count inactive-data-reporting-start-timestamp
--------- --------- ------- -------- ------------- --------------------- --------------------------- ----------------------------------- -------------------- ---------------------------- --------------- ----------------------- ---------------- ---------------------------------------
aggr1     860.5GB   868.4GB 7.92GB   6.87GB        1%                    0B                          0%                                  0B                   0B                  0B              0%                      0B               -

::*> aggr show-space

      Aggregate : aggr1
      Performance Tier
      Feature                                          Used      Used%
      --------------------------------           ----------     ------
      Volume Footprints                              7.91GB         1%
      Aggregate Metadata                             8.14MB         0%
      Snapshot Reserve                              45.71GB         5%
      Total Used                                    53.62GB         6%

      Total Physical Used                            6.87GB         1%

      Total Provisioned Space                         129GB        14%

      Aggregate : aggr1
      Object Store: FSxFabricpoolObjectStore
      Feature                                          Used      Used%
      --------------------------------           ----------     ------
      Logical Used                                       0B          -
      Logical Referenced Capacity                        0B          -
      Logical Unreferenced Capacity                      0B          -

      Total Physical Used                                0B          -

2 entries were displayed.
この内容から以下が分かります。
- Snapshotは維持している
- Storage Efficiencyによるデータ削減量は維持されている
この時の管理アクティビティの監査ログも確認します。
分量が多すぎるので、GitHub上に公開しています。
こちらのログからSSD縮小時に裏側で何を行なっているのか整理すると、以下のとおりです。
- fsxadminの権限制限設定
volume move start/abort/target-aggr/trigger-cutoverコマンドへのアクセス拒否設定volume efficiency on/off/modifyコマンドへのアクセス拒否設定volume offlineコマンドへのアクセス拒否設定volume clone createコマンドへのアクセス拒否設定volume createコマンドは条件付きで許可(非SnapLock、特定vserver除外)
- ストレージディスク情報の定期取得
- 16個のディスクの所有者割り当て
- Pool 0: 8個 (NET-2.11 ~ NET-2.18)
- Pool 1: 8個 (NET-2.11 ~ NET-2.18)
- aggr1_new 作成
- aggregate名の変更
- aggr1 → aggr1_old
- aggr1_new → aggr1
- aggr1をSVMに関連付け
- aggr1を既存のFabricPoolのオブジェクトストレージに関連付け
volume move startによる各ボリュームのaggregateの移動- 移動前と同じ状態になるように各ボリュームのStorage Efficiencyの設定を変更
- aggr1_oldの削除
- 1で設定した権限制限を解除
メインとなる処理はvolume move startでした。
volume move startはボリュームを別aggregateに移動させるコマンドです。FSxN専用の特別コマンドではありません。そのため、NetApp公式ドキュメントにも以下のようにaggregateの移動の処理が詳細に紹介されています。
- 新しいボリュームがデスティネーションアグリゲート上に作成されます。
- 元のボリュームのデータが新しいボリュームにコピーされます。
- この間、元のボリュームはそのままで、クライアントからアクセス可能です。
- 移動プロセスの最後に、クライアントアクセスが一時的にブロックされます。
この間にソースボリュームからデスティネーションボリュームへの最終レプリケーションが実行され、ソースボリュームとデスティネーションボリュームの ID がスワップされ、デスティネーションボリュームがソースボリュームに変更されます。- 移動が完了すると、クライアントトラフィックが新しいソースボリュームにルーティングされ、クライアントアクセスが再開されます。
クライアントアクセスのブロックはクライアントが中断とタイムアウトを認識する前に終了するため、移動によってクライアントアクセスが中断されることはありません。デフォルトでは、クライアントアクセスは30秒間ブロックされます。アクセスが拒否されている間にボリューム移動操作が完了しなかった場合、この最終フェーズは中止されてクライアントアクセスが許可されます。デフォルトでは、最終フェーズは3回試行されます。3回目の試行後、システムは1時間待機してから最後のフェーズシーケンスを再試行します。ボリューム移動処理の最後のフェーズは、ボリューム移動が完了するまで実行されます。
クライアントアクセスの中断は発生しないと記載はされていますが、デフォルトでは30秒間アクセスがブロックされるようです。重たい処理を流している場合は要注意ですね。
注意事項も記載があるので合わせて確認をしておくと良いでしょう。
AWS公式ドキュメントに記載の注意事項とまとめると以下のとおりです。
- SSDの縮小が可能なファイルシステムは第二世代ファイルシステムのみ
- SSDの縮小幅は最小でも現在のSSDサイズの9%以上である必要がある
- HAペアあたりの最小のSSDサイズは1,024GiB
- SSDに50TiB以上のデータを保存しているボリュームがある場合、HAペアごとに少なくとも1,547MBpsを設定する必要がある
- SSDに100TiB以上のデータを保存しているボリュームがある場合、HAペアごとに少なくとも3,072MBpsを設定する必要がある
- SSDに200TiB以上のデータを保存しているボリュームがある場合、HAペアごとに少なくとも6,144MBpsを設定する必要がある
- 以下の変更をした場合、以下に記載の変更を行う場合には6時間以上間隔を開ける必要がある
- SSDのサイズ変更
- SSDのIOPS変更
- スループットキャパシティの変更
- SSD縮小中は以下の操作ができない
- スループットキャパシティの縮小
- HAペアの追加
- SnapRetore
- ボリュームのオフライン化
- ボリュームの移動
- FlexCloneの作成
- SnapLockボリュームの作成
- Storage Efficiencyの変更
- SSD縮小処理中にSSD使用率が80%を超えた場合は一時的に縮小処理を中断する
- 使用率が80%を下回ったタイミングで自動的に再開する
- 書き込みが多いワークロードでは一時的にパフォーマンス低下が発生する可能性がある
- 新しいaggregateにリダイレクトする際に最大60秒のIO停止が発生する可能性がある
- 入れ替え時間はデータ量によって数時間から数日かかることがある
- SSD縮小処理中は以下が50%以下を維持することが望ましい
- CPU使用率
- ディスクスループット使用率
- SSD IOPS使用率
- FlexCloneボリュームを移動すると、FlexClone関係がスプリットされる
最後にCloudWatchメトリクスを確認しましょう。
FSxのコンソールからFSxNファイルシステムの各種情報を確認します。
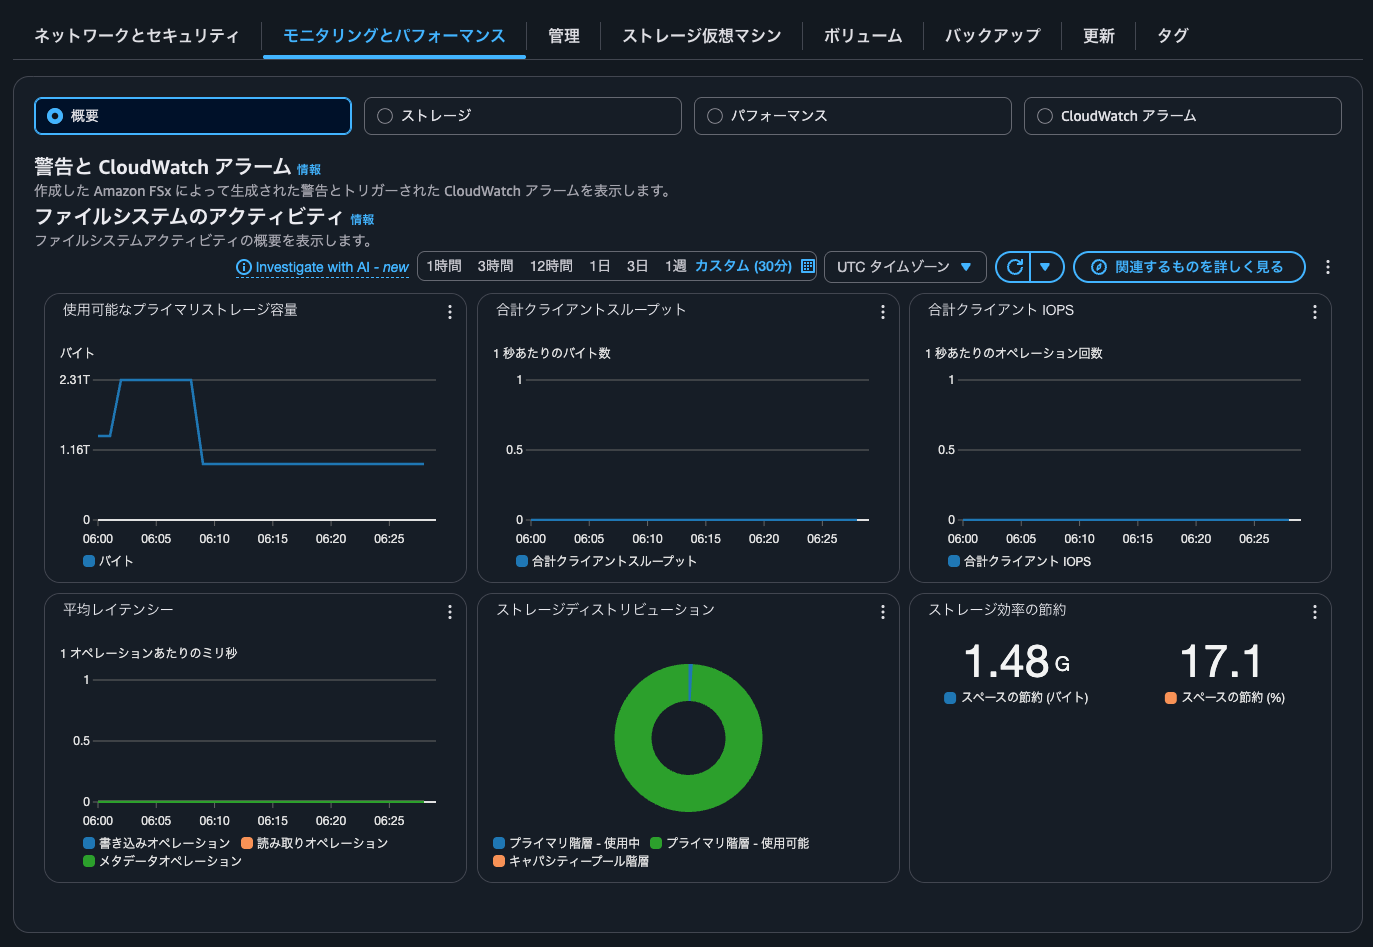
使用可能なプライマリストレージ容量が一時的に増加して、減少していることが分かりますね。これは一時的にaggregateが2つ存在するタイミングがあるためです。もちろんaggregateが複数存在している場合はその分のSSDの課金が発生するので注意が必要です。
SSD 削減オペレーション全体で、SSD 階層の既存のサイズと新しくリクエストされたサイズに対して課金されます。例えば、SSD ストレージ容量を 10 テビバイト (TiB) から 5 TiB に減らすと、SSD 削減オペレーション中に 15 TiB、SSD 削減オペレーションの完了後に 5 TiB の料金が請求されます。
CloudWatchメトリクスを確認すると、Aggregateディメンションがaggr1、aggr1_oldとなっているメトリクスがありました。
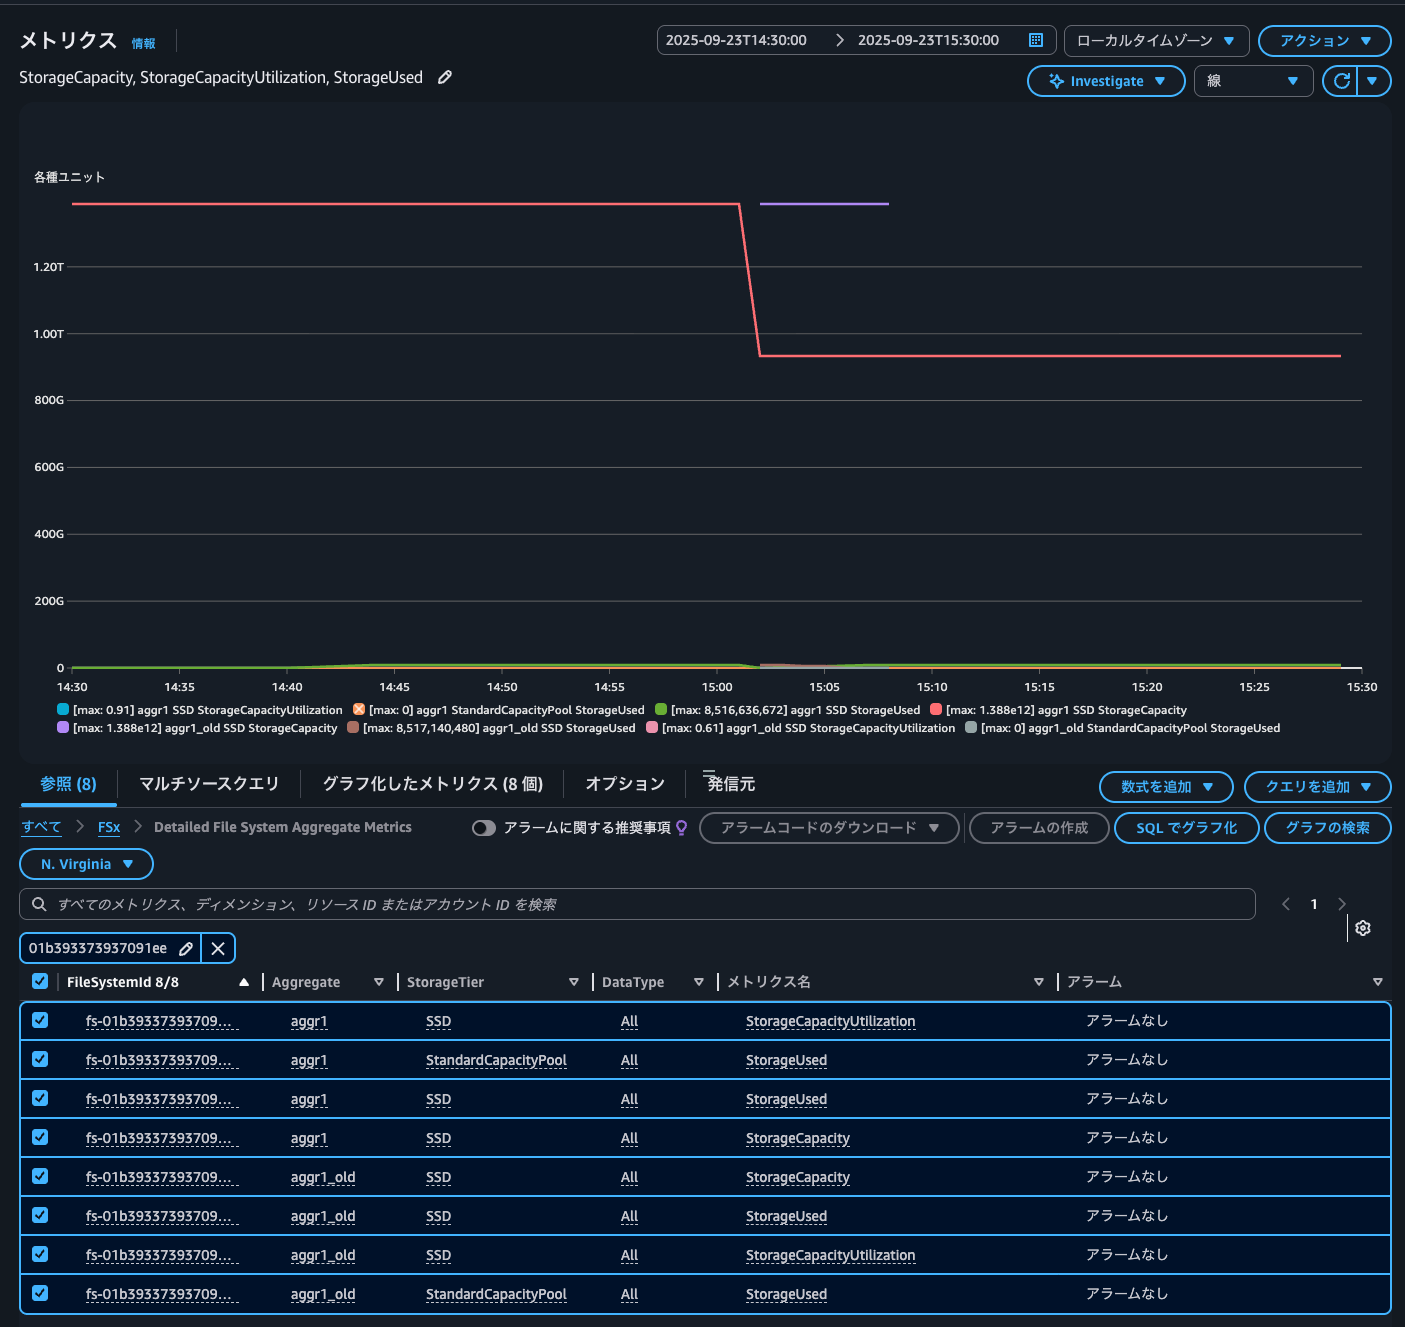
紫のグラフのメトリクスがaggr1_oldのSSDサイズです。メトリクスが記録された期間が15:02から15:08なので、おおよそ6分間aggregateが複数同時に存在していたことが分かります。
続いて、パフォーマンスのメトリクスです。
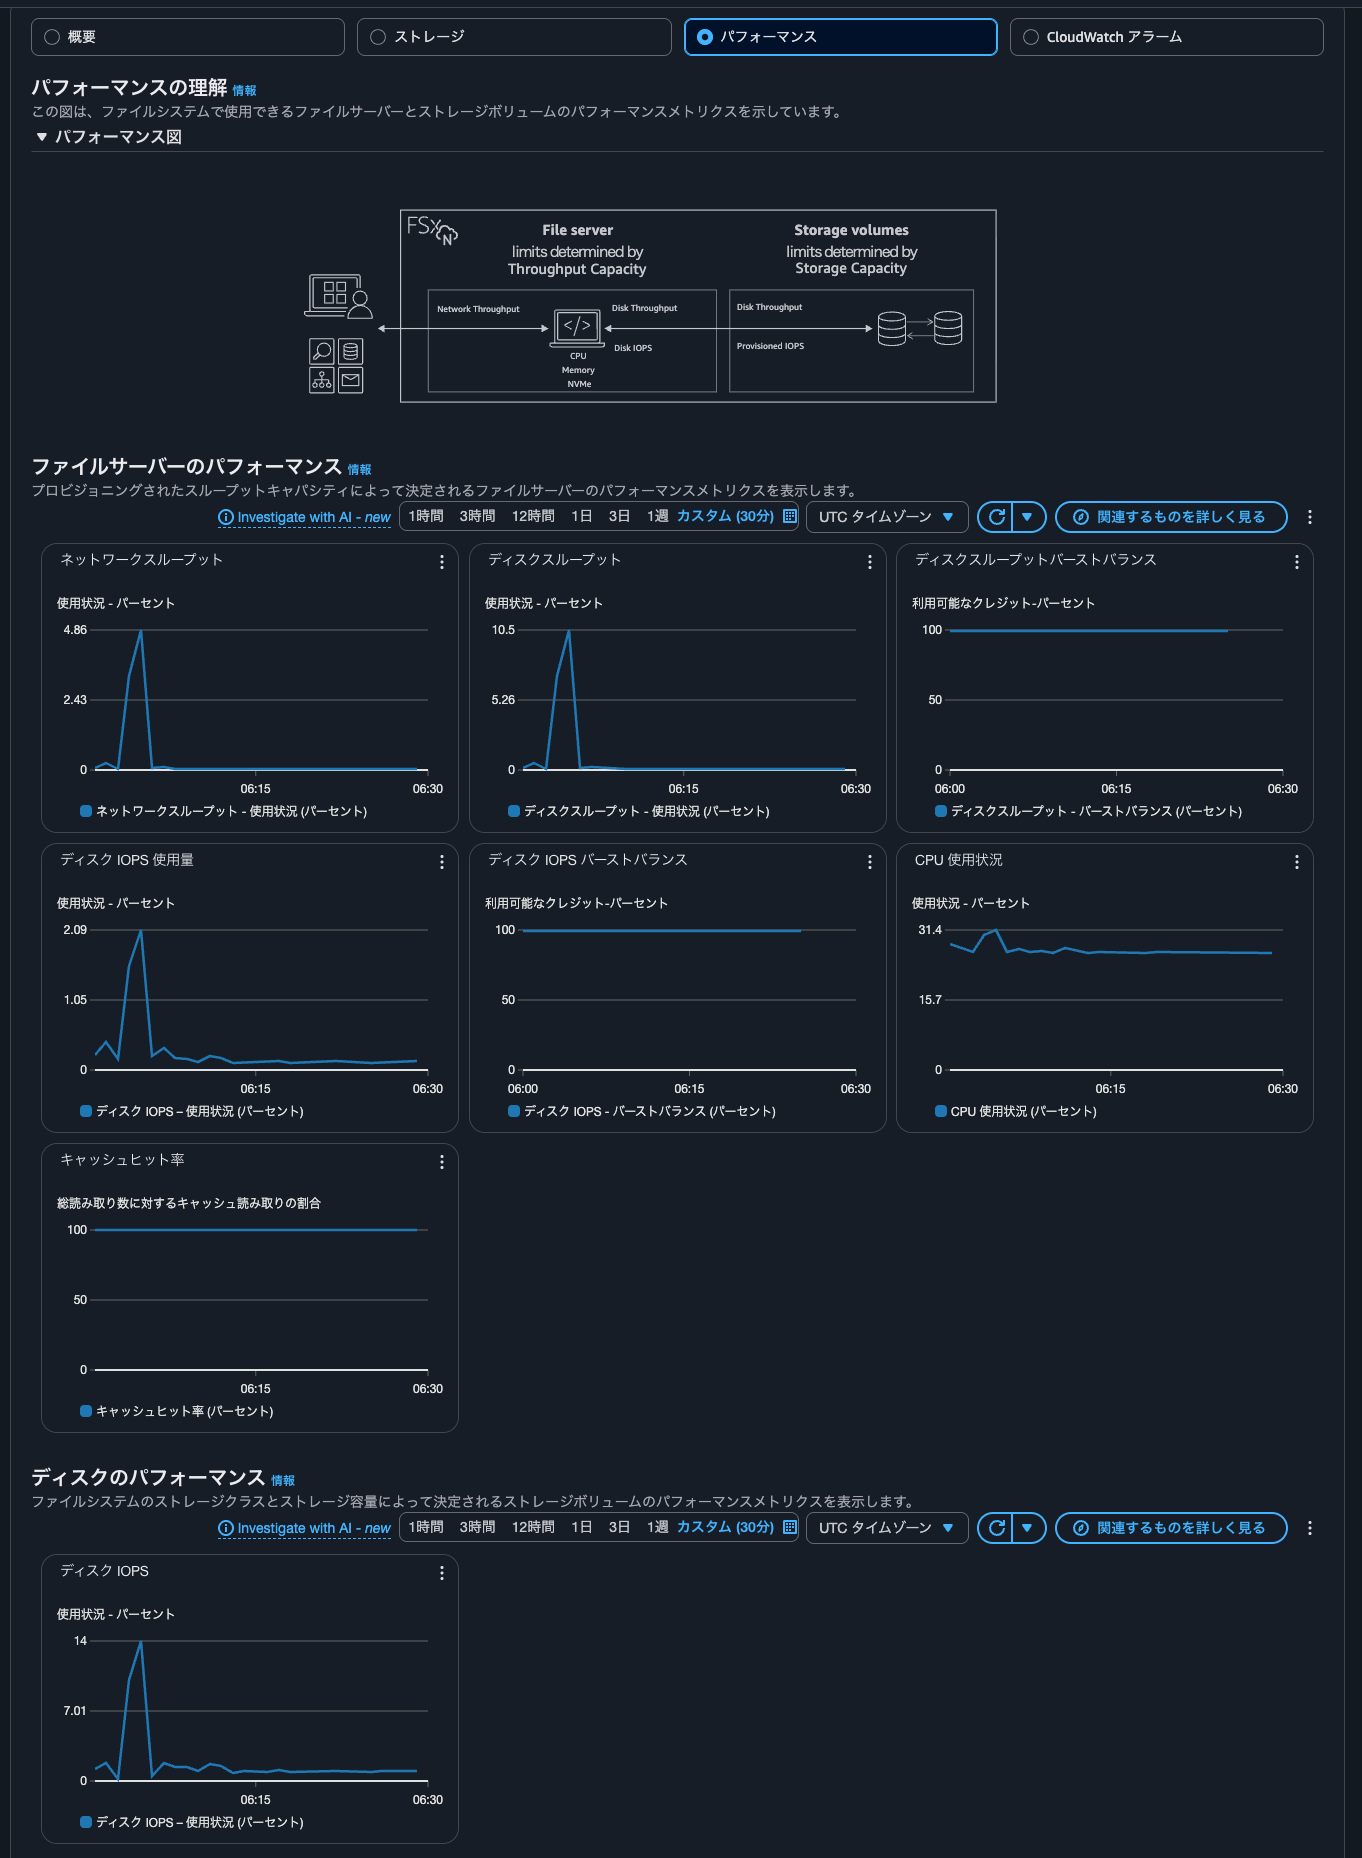
ネットワークやディスクの throughput、ディスクIOPS、CPU使用率がSSD縮小のタイミングが若干跳ねていることが分かります。
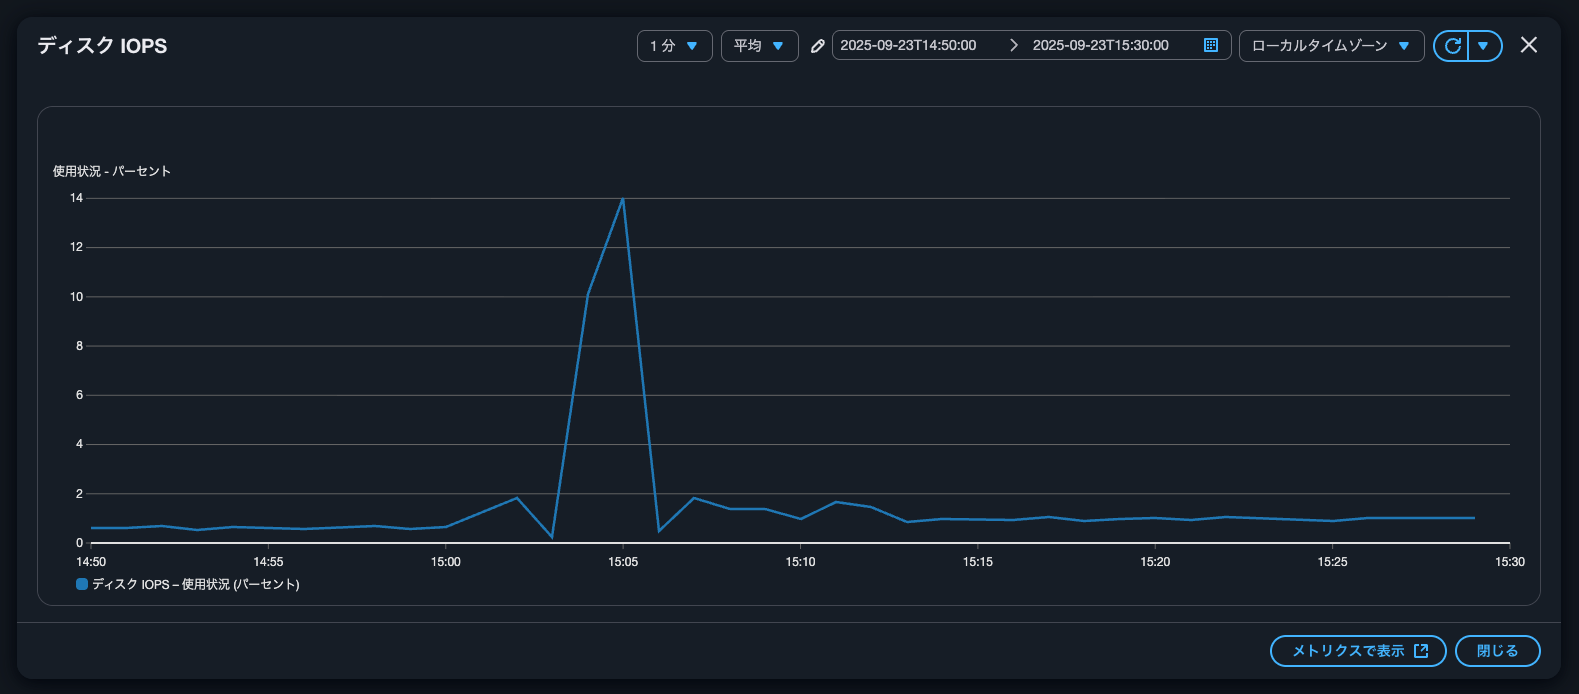
ディスクIOPSに関しては4分ほどスパイクが発生していました。
後からSSDサイズを縮小したくなった場合に
Amazon FSx for NetApp ONTAPのSSDのサイズ縮小の裏側の処理を確認してみました。
後からSSDサイズを縮小したくなった場合には非常に有用ですね。EBSでも同じような機能を提供して欲しいですね。
とはいえ、大量のデータがある場合は長期間ディスクスループットやSSD IOPS、CPUをハードに使用することになることが予想されます。一時的なIO停止も発生するため、ミッションクリティカルなワークロードが動作している場合は実施タイミングは気をつけた方が良いでしょう。
この記事が誰かの助けになれば幸いです。
以上、クラウド事業本部 コンサルティング部の のんピ(@non____97)でした!