
Amazon Cloudwatch Agent : What it is and how to set it up
この記事は公開されてから1年以上経過しています。情報が古い可能性がありますので、ご注意ください。
Amazon CloudWatch is a very important service where users can see metrics and logs of the resources which they are using. When it comes to EC2 instances, there are metrics being collected such as CPU utilisation, network packets in and out, CPU credits usage, CPU credits balance et cetera.
As fulfilling as these metrics might seem, there are instances(pun intended) in which we want additional metrics and logs to monitor our workloads in a better way. Amazon CloudWatch Agent serves this exact purpose. CloudWatch Agent is a software package which collects additional logs and metrics from the instances and exports them to the CloudWatch dashboard. We need to install this agent on our instances
The data to be collected can be configured and this provides us with the flexibility of the metrics and logs to be collected and the intervals. This is configured by a configuration file.
Setting up the CloudWatch Agent
IAM Role
Before we install the CloudWatch agent and configure we need to set up an IAM role which provides the instance permission to read the configuration of the agent from SSM and to export the detailed metrics to the CloudWatch dashboard.
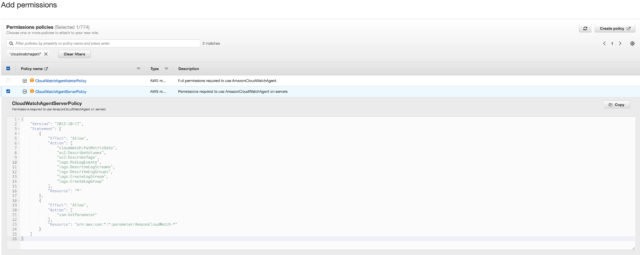
There is an AWS managed policy which we attach to this role, the policy is named CloudWatchAgentServerPolicy this has all the necessary permissions to let the instances export metrics to CloudWatch.
IAM policy for the agent
Now if we want CloudWatch to withhold these metrics for a long time then we need to add a logs retention policy as well. This can be added by using the Attach policies option on the IAM console to our IAM role. I have named this role cloudwatchagent-role and will be referring to it with that from now on.
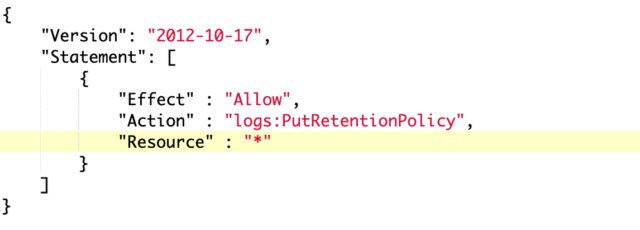
Logs retention policy
Additionally, we need to provide permission to the instance to read AWS SSM secrets as well since our config file will be stored in AWS SSM by the Parameter Store service.
Instance
You can choose an instance of your choice, for this demo I have gone with the easiest to set up, Amazon Linux 2 instance. After starting the instance, attach the IAM role to the instance.
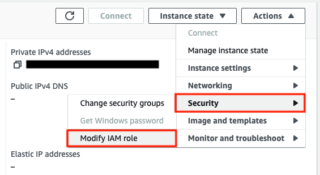
Attaching IAM role to the instance
Installing the agent
To install the agent on the instance use the following command:
$ wget https://s3.amazonaws.com/amazoncloudwatch-agent/linux/amd64/latest/AmazonCloudWatchAgent.zip

$ unzip AmazonCloudWatchAgent.zip

$ sudo ./install.sh
Now we need to invoke the installer, the installer takes us through several steps which configures the CloudWatch agent and generates a configuration file. Additionally, we can also provide path to our own self defined CloudWatch Agent config file during the installation procedure.
$ sudo /opt/aws/amazon-cloudwatch-agent/bin/amazon-cloudwatch-agent-config-wizard
After completing all the steps, the installer then displays the resultant config file, feel free to choose whichever options you want to try but for your reference here is my generated config file:
{

"agent": { "metrics_collection_interval": 60, "run_as_user": "root" },

"logs": { "logs_collected": { "files": { "collect_list": [ { "file_path": "", "log_group_name": ".", "log_stream_name": "{instance_id}", "retention_in_days": 7 } ] } } },

"metrics": {

"aggregation_dimensions": [ [ "InstanceId" ] ],

"append_dimensions": { "AutoScalingGroupName": "${aws:AutoScalingGroupName}", "ImageId": "${aws:ImageId}", "InstanceId": "${aws:InstanceId}", "InstanceType": "${aws:InstanceType}" },

"metrics_collected": {

"cpu": { "measurement": [ "cpu_usage_idle", "cpu_usage_iowait", "cpu_usage_user", "cpu_usage_system" ], "metrics_collection_interval": 60, "totalcpu": false },

"disk": { "measurement": [ "used_percent", "inodes_free" ], "metrics_collection_interval": 60, "resources": [ "*" ] },

"diskio": { "measurement": [ "io_time" ], "metrics_collection_interval": 60, "resources": [ "*" ] },

"mem": { "measurement": [ "mem_used_percent" ], "metrics_collection_interval": 60 },

"statsd": { "metrics_aggregation_interval": 60, "metrics_collection_interval": 60, "service_address": ":8125" },

"swap": { "measurement": [ "swap_used_percent" ], "metrics_collection_interval": 60 } } }
}
We can view this configuration file in the SSM console as well, under Parameter Store. While running this installer it will also ask us to provide path of any additional log files which we would like to monitor.
Viewing the metrics
To view the metrics, we need to start the agent, for this we just need to run the following command:
sudo /opt/aws/amazon-cloudwatch-agent/bin/amazon-cloudwatch-agent-ctl -a fetch-config -m ec2 -c file:/opt/aws/amazon-cloudwatch-agent/bin/config.json -s

$ sudo /bin/systemctl restart amazon-cloudwatch-agent.service
Now, head to CloudWatch after some time, this depends on the interval which we have defined for the collection of the metrics. They will appear under the name of CWAgent.
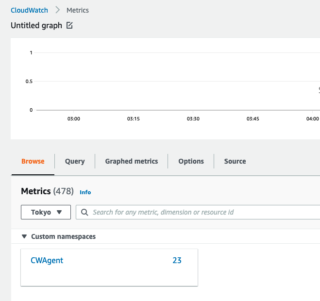
CloudWatch Agent's metrics are under CWAgent
The metrics are categorised and we can view them by selecting them using the checkbox and they shall be represented like any other CloudWatch metrics on the graph above.
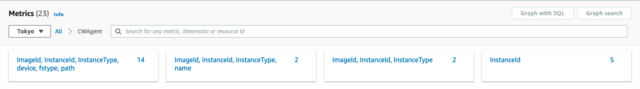
Metric categorisation in CW
This concludes the setup and explanation of CloudWatch Agent. I hope you enjoyed this, I recommend you try various options during the setup to understand the agent in a deeper way.