EKS on Fargate で Pod 異常を検出してみた(kube-state-metrics 編)
はじめに
クラウド事業本部、あきやまです。
以前、EKS on Fargate で Pod のメトリクスを取得してみた(ADOT 編)という記事を書きました。
cAdvisor 経由で CPU・メモリ・ネットワークメトリクスを CloudWatch Container Insights に送るところまで検証しましたが、その構成では Pod の異常状態(CrashLoopBackOff など)を検知できないという課題がありました。
cAdvisor はリソース使用量を取得するものであり、Pod の状態(再起動回数・フェーズ)は Kubernetes API の情報として kube-state-metricsを利用して取得できるようだったので、今回は既存の ADOT 構成に kube-state-metrics のパイプラインを追加し、Deployment 単位で Pod 異常を CloudWatch アラームで検知するところまで試してみました。
本記事で構築する構成は以下のとおりです。
環境
| 項目 | 値 |
|---|---|
| OS | macOS Sequoia |
| AWS CLI | v2 |
| kubectl | v1.35.2 |
| EKS クラスターバージョン | 1.31 |
| kube-state-metrics | v2.13.0 |
| リージョン | ap-northeast-1 |
前回記事の環境(EKS on Fargate + ADOT による cAdvisor メトリクス収集)が構築済みであることを前提とします。
先に結論
- kube-state-metrics を
fargate-container-insightsnamespace(Fargate Pod として稼働)にデプロイすることで、Deployment / Pod の状態メトリクスを ADOT 経由で CloudWatch に送れた - Deployment 単位の Pod 異常検知には
kube_deployment_status_replicas_unavailableを使い、CrashLoopBackOff・ImagePullBackOff・OOMKilled など「Pod が Ready にならない」状態をまとめて検知できた - Fargate 固有の注意点: kube-state-metrics は Node 情報(
kube_node_*)を実用的な値で返さない。Pod / Deployment / StatefulSet 単位のメトリクスは正常に取得できた
やってみた
Step 1: kube-state-metrics をデプロイする
kube-state-metrics は AWS が提供するツールではなく、Kubernetes コミュニティのプロジェクトです(kubernetes/kube-state-metrics)。
そのため、AWS 公式の ADOT テンプレートには kube-state-metrics のデプロイマニフェストは含まれていません。
EKS on Fargate は DaemonSet を実行できないため、kube-state-metrics は Deployment としてデプロイします。前回記事で fargate-container-insights namespace 用の Fargate Profile が作成済みのため、同一 namespace にデプロイします。
通常は Helm chart(prometheus-community/kube-state-metrics)でデプロイします。Helm を使っても手動マニフェストを使っても、作成されるリソースは同じく Deployment です。
本記事では構成を明示するため手動マニフェストで作成しました。検証目的なら手動マニフェストで十分ですが、本番運用では Helm chart のほうが保守しやすいです(バージョンアップ・PodDisruptionBudget・NetworkPolicy などが自動管理される)。
以下のマニフェストを適用します。ServiceAccount / ClusterRole / ClusterRoleBinding / Service / Deployment をまとめて定義しています。
---
apiVersion: v1
kind: ServiceAccount
metadata:
  name: kube-state-metrics
  namespace: fargate-container-insights

---
apiVersion: rbac.authorization.k8s.io/v1
kind: ClusterRole
metadata:
  name: kube-state-metrics
rules:
  - apiGroups: [""]
    resources:
      - endpoints
      - limitranges
      - namespaces
      - nodes
      - persistentvolumeclaims
      - persistentvolumes
      - pods
      - replicationcontrollers
      - resourcequotas
      - services
    verbs: ["list", "watch"]
  - apiGroups: ["apps"]
    resources:
      - daemonsets
      - deployments
      - replicasets
      - statefulsets
    verbs: ["list", "watch"]
  - apiGroups: ["autoscaling"]
    resources:
      - horizontalpodautoscalers
    verbs: ["list", "watch"]
  - apiGroups: ["batch"]
    resources:
      - cronjobs
      - jobs
    verbs: ["list", "watch"]
  - apiGroups: ["policy"]
    resources:
      - poddisruptionbudgets
    verbs: ["list", "watch"]
  - apiGroups: ["storage.k8s.io"]
    resources:
      - storageclasses
      - volumeattachments
    verbs: ["list", "watch"]

---
apiVersion: rbac.authorization.k8s.io/v1
kind: ClusterRoleBinding
metadata:
  name: kube-state-metrics
roleRef:
  apiGroup: rbac.authorization.k8s.io
  kind: ClusterRole
  name: kube-state-metrics
subjects:
  - kind: ServiceAccount
    name: kube-state-metrics
    namespace: fargate-container-insights

---
apiVersion: v1
kind: Service
metadata:
  name: kube-state-metrics
  namespace: fargate-container-insights
  labels:
    app: kube-state-metrics
spec:
  type: ClusterIP
  ports:
    - name: metrics
      port: 8080
      targetPort: 8080
    - name: telemetry
      port: 8081
      targetPort: 8081
  selector:
    app: kube-state-metrics

---
apiVersion: apps/v1
kind: Deployment
metadata:
  name: kube-state-metrics
  namespace: fargate-container-insights
  labels:
    app: kube-state-metrics
spec:
  replicas: 1
  selector:
    matchLabels:
      app: kube-state-metrics
  template:
    metadata:
      labels:
        app: kube-state-metrics
    spec:
      serviceAccountName: kube-state-metrics
      containers:
        - name: kube-state-metrics
          image: registry.k8s.io/kube-state-metrics/kube-state-metrics:v2.13.0
          ports:
            - name: metrics
              containerPort: 8080
            - name: telemetry
              containerPort: 8081
          readinessProbe:
            httpGet:
              path: /healthz
              port: 8080
            initialDelaySeconds: 5
            timeoutSeconds: 5
          livenessProbe:
            httpGet:
              path: /healthz
              port: 8080
            initialDelaySeconds: 5
            timeoutSeconds: 5
          resources:
            requests:
              cpu: "100m"
              memory: "128Mi"
            limits:
              cpu: "200m"
              memory: "256Mi"
kubectl apply -f k8s/metric/kube-state-metrics.yaml
Pod が Running になるまで待ちます。
kubectl get pods -n fargate-container-insights
# NAME                                  READY   STATUS    RESTARTS   AGE
# kube-state-metrics-xxxxxxxxx-xxxxx    1/1     Running   0          2m
Step 2: ADOT ConfigMap に kube-state-metrics パイプラインを追加する
ベースファイルについて
前回記事で使用した otel-fargate-container-insights.yaml は、AWS ADOT 公式ドキュメント(EKS Fargate Container Insights)で提供されている公式テンプレートをベースにしています。
今回はこのファイルをコピーして otel-kube-state-metrics.yaml として保存し、kube-state-metrics 用のパイプラインを追加しました。
変更サマリ
| 変更種別 | 対象 | 内容 |
|---|---|---|
| 変更 | ConfigMap 名 | adot-collector-config → adot-collector-config-ksm |
| 追加 | receiver | prometheus/ksm |
| 追加 | processor | filter/ksm、metricstransform/ksm_labels |
| 追加 | exporter | awsemf/ksm |
| 追加 | pipeline | metrics/ksm |
| 変更 | StatefulSet volume | 参照する ConfigMap 名を上記に合わせて変更 |
最終ファイル(変更箇所コメント付き)
ファイル中の # ★ [変更]・# ★ [追加] ここから・# ★ [追加] ここまで が元テンプレートからの変更箇所です。
kind: ClusterRole
apiVersion: rbac.authorization.k8s.io/v1
metadata:
name: adotcol-admin-role
rules:
- apiGroups: [""]
resources:
- nodes
- nodes/proxy
- nodes/metrics
- services
- endpoints
- pods
- pods/proxy
verbs: ["get", "list", "watch"]
- nonResourceURLs: [ "/metrics/cadvisor"]
verbs: ["get", "list", "watch"]
---
kind: ClusterRoleBinding
apiVersion: rbac.authorization.k8s.io/v1
metadata:
name: adotcol-admin-role-binding
subjects:
- kind: ServiceAccount
name: adot-collector
namespace: fargate-container-insights
roleRef:
kind: ClusterRole
name: adotcol-admin-role
apiGroup: rbac.authorization.k8s.io
---
apiVersion: v1
kind: ConfigMap
metadata:
name: adot-collector-config-ksm # ★ [変更] adot-collector-config → adot-collector-config-ksm
namespace: fargate-container-insights
labels:
app: aws-adot
component: adot-collector-config
data:
adot-collector-config: |
receivers:
prometheus:
config:
global:
scrape_interval: 1m
scrape_timeout: 40s
scrape_configs:
- job_name: 'kubelets-cadvisor-metrics'
sample_limit: 10000
scheme: https
kubernetes_sd_configs:
- role: node
tls_config:
ca_file: /var/run/secrets/kubernetes.io/serviceaccount/ca.crt
bearer_token_file: /var/run/secrets/kubernetes.io/serviceaccount/token
relabel_configs:
- action: labelmap
regex: __meta_kubernetes_node_label_(.+)
- target_label: __address__
replacement: kubernetes.default.svc:443
- source_labels: [__meta_kubernetes_node_name]
regex: (.+)
target_label: __metrics_path__
replacement: /api/v1/nodes/$${1}/proxy/metrics/cadvisor
metric_relabel_configs:
- action: replace
source_labels: [id]
regex: '^/machine\.slice/machine-rkt\\x2d([^\\]+)\\.+/([^/]+)\.service$'
target_label: rkt_container_name
replacement: '$${2}-$${1}'
- action: replace
source_labels: [id]
regex: '^/system\.slice/(.+)\.service$'
target_label: systemd_service_name
replacement: '$${1}'
- action: replace
source_labels: [pod]
regex: '^(.+)-[a-f0-9]{8,10}-[a-z0-9]{5}$'
target_label: workload_name
replacement: '$${1}'
- action: replace
source_labels: [pod]
regex: '^(.+)-\d+$'
target_label: workload_name
replacement: '$${1}'
- source_labels: [namespace]
regex: "^demo$"
action: keep
# ★ [追加] ここから: kube-state-metrics スクレイプ用 receiver
prometheus/ksm:
config:
global:
scrape_interval: 1m
scrape_timeout: 40s
scrape_configs:
- job_name: 'kube-state-metrics'
static_configs:
- targets: ['kube-state-metrics.fargate-container-insights.svc.cluster.local:8080']
metric_relabel_configs:
- action: replace
source_labels: [deployment]
regex: (.+)
target_label: workload_name
replacement: '$${1}'
- action: replace
source_labels: [statefulset]
regex: (.+)
target_label: workload_name
replacement: '$${1}'
- action: replace
source_labels: [daemonset]
regex: (.+)
target_label: workload_name
replacement: '$${1}'
# ★ [追加] ここまで
processors:
metricstransform/label_1:
transforms:
- include: .*
match_type: regexp
action: update
operations:
- action: add_label
new_label: LaunchType
new_value: fargate
metricstransform/rename:
transforms:
- include: container_spec_cpu_quota
new_name: new_container_cpu_limit_raw
action: insert
match_type: regexp
experimental_match_labels: {"container": "\\S", "LaunchType": "fargate"}
- include: container_spec_cpu_shares
new_name: new_container_cpu_request
action: insert
match_type: regexp
experimental_match_labels: {"container": "\\S", "LaunchType": "fargate"}
- include: container_cpu_usage_seconds_total
new_name: new_container_cpu_usage_seconds_total
action: insert
match_type: regexp
experimental_match_labels: {"container": "\\S", "LaunchType": "fargate"}
- include: container_spec_memory_limit_bytes
new_name: new_container_memory_limit
action: insert
match_type: regexp
experimental_match_labels: {"container": "\\S", "LaunchType": "fargate"}
- include: container_memory_cache
new_name: new_container_memory_cache
action: insert
match_type: regexp
experimental_match_labels: {"container": "\\S", "LaunchType": "fargate"}
- include: container_memory_max_usage_bytes
new_name: new_container_memory_max_usage
action: insert
match_type: regexp
experimental_match_labels: {"container": "\\S", "LaunchType": "fargate"}
- include: container_memory_usage_bytes
new_name: new_container_memory_usage
action: insert
match_type: regexp
experimental_match_labels: {"container": "\\S", "LaunchType": "fargate"}
- include: container_memory_working_set_bytes
new_name: new_container_memory_working_set
action: insert
match_type: regexp
experimental_match_labels: {"container": "\\S", "LaunchType": "fargate"}
- include: container_memory_rss
new_name: new_container_memory_rss
action: insert
match_type: regexp
experimental_match_labels: {"container": "\\S", "LaunchType": "fargate"}
- include: container_memory_swap
new_name: new_container_memory_swap
action: insert
match_type: regexp
experimental_match_labels: {"container": "\\S", "LaunchType": "fargate"}
- include: container_memory_failcnt
new_name: new_container_memory_failcnt
action: insert
match_type: regexp
experimental_match_labels: {"container": "\\S", "LaunchType": "fargate"}
- include: container_memory_failures_total
new_name: new_container_memory_hierarchical_pgfault
action: insert
match_type: regexp
experimental_match_labels: {"container": "\\S", "LaunchType": "fargate", "failure_type": "pgfault", "scope": "hierarchy"}
- include: container_memory_failures_total
new_name: new_container_memory_hierarchical_pgmajfault
action: insert
match_type: regexp
experimental_match_labels: {"container": "\\S", "LaunchType": "fargate", "failure_type": "pgmajfault", "scope": "hierarchy"}
- include: container_memory_failures_total
new_name: new_container_memory_pgfault
action: insert
match_type: regexp
experimental_match_labels: {"container": "\\S", "LaunchType": "fargate", "failure_type": "pgfault", "scope": "container"}
- include: container_memory_failures_total
new_name: new_container_memory_pgmajfault
action: insert
match_type: regexp
experimental_match_labels: {"container": "\\S", "LaunchType": "fargate", "failure_type": "pgmajfault", "scope": "container"}
- include: container_fs_limit_bytes
new_name: new_container_filesystem_capacity
action: insert
match_type: regexp
experimental_match_labels: {"container": "\\S", "LaunchType": "fargate"}
- include: container_fs_usage_bytes
new_name: new_container_filesystem_usage
action: insert
match_type: regexp
experimental_match_labels: {"container": "\\S", "LaunchType": "fargate"}
- include: container_spec_cpu_quota
new_name: pod_cpu_limit_raw
action: insert
match_type: regexp
experimental_match_labels: {"image": "^$", "container": "^$", "pod": "\\S", "LaunchType": "fargate"}
- include: container_spec_cpu_shares
new_name: pod_cpu_request
action: insert
match_type: regexp
experimental_match_labels: {"image": "^$", "container": "^$", "pod": "\\S", "LaunchType": "fargate"}
- include: container_cpu_usage_seconds_total
new_name: pod_cpu_usage_seconds_total
action: insert
match_type: regexp
experimental_match_labels: {"image": "^$", "container": "^$", "pod": "\\S", "LaunchType": "fargate"}
- include: container_spec_memory_limit_bytes
new_name: pod_memory_limit
action: insert
match_type: regexp
experimental_match_labels: {"image": "^$", "container": "^$", "pod": "\\S", "LaunchType": "fargate"}
- include: container_memory_cache
new_name: pod_memory_cache
action: insert
match_type: regexp
experimental_match_labels: {"image": "^$", "container": "^$", "pod": "\\S", "LaunchType": "fargate"}
- include: container_memory_max_usage_bytes
new_name: pod_memory_max_usage
action: insert
match_type: regexp
experimental_match_labels: {"image": "^$", "container": "^$", "pod": "\\S", "LaunchType": "fargate"}
- include: container_memory_usage_bytes
new_name: pod_memory_usage
action: insert
match_type: regexp
experimental_match_labels: {"image": "^$", "container": "^$", "pod": "\\S", "LaunchType": "fargate"}
- include: container_memory_working_set_bytes
new_name: pod_memory_working_set
action: insert
match_type: regexp
experimental_match_labels: {"image": "^$", "container": "^$", "pod": "\\S", "LaunchType": "fargate"}
- include: container_memory_rss
new_name: pod_memory_rss
action: insert
match_type: regexp
experimental_match_labels: {"image": "^$", "container": "^$", "pod": "\\S", "LaunchType": "fargate"}
- include: container_memory_swap
new_name: pod_memory_swap
action: insert
match_type: regexp
experimental_match_labels: {"image": "^$", "container": "^$", "pod": "\\S", "LaunchType": "fargate"}
- include: container_memory_failcnt
new_name: pod_memory_failcnt
action: insert
match_type: regexp
experimental_match_labels: {"image": "^$", "container": "^$", "pod": "\\S", "LaunchType": "fargate"}
- include: container_memory_failures_total
new_name: pod_memory_hierarchical_pgfault
action: insert
match_type: regexp
experimental_match_labels: {"image": "^$", "container": "^$", "pod": "\\S", "LaunchType": "fargate", "failure_type": "pgfault", "scope": "hierarchy"}
- include: container_memory_failures_total
new_name: pod_memory_hierarchical_pgmajfault
action: insert
match_type: regexp
experimental_match_labels: {"image": "^$", "container": "^$", "pod": "\\S", "LaunchType": "fargate", "failure_type": "pgmajfault", "scope": "hierarchy"}
- include: container_memory_failures_total
new_name: pod_memory_pgfault
action: insert
match_type: regexp
experimental_match_labels: {"image": "^$", "container": "^$", "pod": "\\S", "LaunchType": "fargate", "failure_type": "pgfault", "scope": "container"}
- include: container_memory_failures_total
new_name: pod_memory_pgmajfault
action: insert
match_type: regexp
experimental_match_labels: {"image": "^$", "container": "^$", "pod": "\\S", "LaunchType": "fargate", "failure_type": "pgmajfault", "scope": "container"}
- include: container_network_receive_bytes_total
new_name: pod_network_rx_bytes
action: insert
match_type: regexp
experimental_match_labels: {"pod": "\\S", "LaunchType": "fargate"}
- include: container_network_receive_packets_dropped_total
new_name: pod_network_rx_dropped
action: insert
match_type: regexp
experimental_match_labels: {"pod": "\\S", "LaunchType": "fargate"}
- include: container_network_receive_errors_total
new_name: pod_network_rx_errors
action: insert
match_type: regexp
experimental_match_labels: {"pod": "\\S", "LaunchType": "fargate"}
- include: container_network_receive_packets_total
new_name: pod_network_rx_packets
action: insert
match_type: regexp
experimental_match_labels: {"pod": "\\S", "LaunchType": "fargate"}
- include: container_network_transmit_bytes_total
new_name: pod_network_tx_bytes
action: insert
match_type: regexp
experimental_match_labels: {"pod": "\\S", "LaunchType": "fargate"}
- include: container_network_transmit_packets_dropped_total
new_name: pod_network_tx_dropped
action: insert
match_type: regexp
experimental_match_labels: {"pod": "\\S", "LaunchType": "fargate"}
- include: container_network_transmit_errors_total
new_name: pod_network_tx_errors
action: insert
match_type: regexp
experimental_match_labels: {"pod": "\\S", "LaunchType": "fargate"}
- include: container_network_transmit_packets_total
new_name: pod_network_tx_packets
action: insert
match_type: regexp
experimental_match_labels: {"pod": "\\S", "LaunchType": "fargate"}
filter:
metrics:
include:
match_type: regexp
metric_names:
- new_container_.*
- pod_.*
cumulativetodelta:
include:
metrics:
- new_container_cpu_usage_seconds_total
- pod_cpu_usage_seconds_total
- pod_memory_pgfault
- pod_memory_pgmajfault
- pod_memory_hierarchical_pgfault
- pod_memory_hierarchical_pgmajfault
- pod_network_rx_bytes
- pod_network_rx_dropped
- pod_network_rx_errors
- pod_network_rx_packets
- pod_network_tx_bytes
- pod_network_tx_dropped
- pod_network_tx_errors
- pod_network_tx_packets
- new_container_memory_pgfault
- new_container_memory_pgmajfault
- new_container_memory_hierarchical_pgfault
- new_container_memory_hierarchical_pgmajfault
match_type: strict
deltatorate:
metrics:
- new_container_cpu_usage_seconds_total
- pod_cpu_usage_seconds_total
- pod_memory_pgfault
- pod_memory_pgmajfault
- pod_memory_hierarchical_pgfault
- pod_memory_hierarchical_pgmajfault
- pod_network_rx_bytes
- pod_network_rx_dropped
- pod_network_rx_errors
- pod_network_rx_packets
- pod_network_tx_bytes
- pod_network_tx_dropped
- pod_network_tx_errors
- pod_network_tx_packets
- new_container_memory_pgfault
- new_container_memory_pgmajfault
- new_container_memory_hierarchical_pgfault
- new_container_memory_hierarchical_pgmajfault
metricsgeneration/1:
rules:
- name: pod_network_total_bytes
unit: Bytes/Second
type: calculate
metric1: pod_network_rx_bytes
metric2: pod_network_tx_bytes
operation: add
- name: pod_memory_utilization_over_pod_limit
unit: Percent
type: calculate
metric1: pod_memory_working_set
metric2: pod_memory_limit
operation: percent
- name: pod_cpu_usage_total
unit: Millicore
type: scale
metric1: pod_cpu_usage_seconds_total
operation: multiply
scale_by: 1000
- name: pod_cpu_limit
unit: Millicore
type: scale
metric1: pod_cpu_limit_raw
operation: divide
scale_by: 100
metricsgeneration/2:
rules:
- name: pod_cpu_utilization_over_pod_limit
type: calculate
unit: Percent
metric1: pod_cpu_usage_total
metric2: pod_cpu_limit
operation: percent
metricstransform/label_2:
transforms:
- include: pod_.*
match_type: regexp
action: update
operations:
- action: add_label
new_label: Type
new_value: "Pod"
- include: new_container_.*
match_type: regexp
action: update
operations:
- action: add_label
new_label: Type
new_value: Container
- include: .*
match_type: regexp
action: update
operations:
- action: update_label
label: namespace
new_label: Namespace
- action: update_label
label: pod
new_label: PodName
- include: ^new_container_(.*)$$
match_type: regexp
action: update
new_name: container_$$1
resourcedetection:
detectors: [env]
batch:
timeout: 60s
# ★ [追加] ここから: kube-state-metrics 用 processor
filter/ksm:
metrics:
include:
match_type: regexp
metric_names:
- kube_deployment_status_replicas_available
- kube_deployment_status_replicas_unavailable
- kube_deployment_spec_replicas
- kube_pod_status_phase
- kube_pod_container_status_restarts_total
- kube_pod_container_resource_requests
- kube_pod_container_resource_limits
- kube_statefulset_replicas
- kube_statefulset_status_replicas_ready
metricstransform/ksm_labels:
transforms:
- include: kube_deployment_.*
match_type: regexp
action: update
operations:
- action: add_label
new_label: Type
new_value: Deployment
- include: kube_pod_.*
match_type: regexp
action: update
operations:
- action: add_label
new_label: Type
new_value: Pod
- include: kube_statefulset_.*
match_type: regexp
action: update
operations:
- action: add_label
new_label: Type
new_value: StatefulSet
# ★ [追加] ここまで
exporters:
awsemf:
log_group_name: '/aws/containerinsights/{ClusterName}/performance'
log_stream_name: '{PodName}'
namespace: 'ContainerInsights'
region: ap-northeast-1
resource_to_telemetry_conversion:
enabled: true
eks_fargate_container_insights_enabled: true
parse_json_encoded_attr_values: ["kubernetes"]
dimension_rollup_option: NoDimensionRollup
metric_declarations:
- dimensions: [[ClusterName, LaunchType], [ClusterName, Namespace, LaunchType], [ClusterName, Namespace, PodName, LaunchType]]
metric_name_selectors:
- pod_cpu_utilization_over_pod_limit
- pod_cpu_usage_total
- pod_cpu_limit
- pod_memory_utilization_over_pod_limit
- pod_memory_working_set
- pod_memory_limit
- pod_network_rx_bytes
- pod_network_tx_bytes
# ★ [追加] ここから: kube-state-metrics 専用 CloudWatch 出力
# 既存の ContainerInsights とは別 namespace に送ることでアラーム設定時の混在を防ぐ
awsemf/ksm:
log_group_name: '/aws/containerinsights/{ClusterName}/kube-state-metrics'
log_stream_name: 'kube-state-metrics'
namespace: 'ContainerInsights/KubeStateMetrics'
region: ap-northeast-1
resource_to_telemetry_conversion:
enabled: true
dimension_rollup_option: NoDimensionRollup
metric_declarations:
- dimensions:
- [ClusterName, namespace, deployment]
- [ClusterName, namespace, workload_name]
metric_name_selectors:
- kube_deployment_status_replicas_available
- kube_deployment_status_replicas_unavailable
- kube_deployment_spec_replicas
- dimensions:
- [ClusterName, namespace, pod]
metric_name_selectors:
- kube_pod_status_phase
- kube_pod_container_status_restarts_total
- dimensions:
- [ClusterName, namespace, pod, container, resource]
metric_name_selectors:
- kube_pod_container_resource_requests
- kube_pod_container_resource_limits
- dimensions:
- [ClusterName, namespace, statefulset]
metric_name_selectors:
- kube_statefulset_replicas
- kube_statefulset_status_replicas_ready
# ★ [追加] ここまで
extensions:
health_check:
service:
pipelines:
metrics:
receivers: [prometheus]
processors: [metricstransform/label_1, resourcedetection, metricstransform/rename, filter, cumulativetodelta, deltatorate, metricsgeneration/1, metricsgeneration/2, metricstransform/label_2, batch]
exporters: [awsemf]
# ★ [追加] ここから: kube-state-metrics パイプライン
metrics/ksm:
receivers: [prometheus/ksm]
processors:
- filter/ksm
- metricstransform/ksm_labels
- resourcedetection
- batch
exporters: [awsemf/ksm]
# ★ [追加] ここまで
extensions: [health_check]
---
apiVersion: v1
kind: Service
metadata:
name: adot-collector-service
namespace: fargate-container-insights
labels:
app: aws-adot
component: adot-collector
spec:
ports:
- name: metrics
port: 8888
selector:
component: adot-collector
type: ClusterIP
---
apiVersion: apps/v1
kind: StatefulSet
metadata:
name: adot-collector
namespace: fargate-container-insights
labels:
app: aws-adot
component: adot-collector
spec:
selector:
matchLabels:
app: aws-adot
component: adot-collector
serviceName: adot-collector-service
template:
metadata:
labels:
app: aws-adot
component: adot-collector
spec:
serviceAccountName: adot-collector
securityContext:
fsGroup: 65534
containers:
- image: public.ecr.aws/aws-observability/aws-otel-collector:latest
name: adot-collector
imagePullPolicy: Always
command:
- "/awscollector"
- "--config=/conf/adot-collector-config.yaml"
env:
- name: OTEL_RESOURCE_ATTRIBUTES
value: "ClusterName=fargate-logging-test"
resources:
limits:
cpu: 1
memory: 2Gi
requests:
cpu: 1
memory: 2Gi
volumeMounts:
- name: adot-collector-config-volume
mountPath: /conf
volumes:
- configMap:
name: adot-collector-config-ksm # ★ [変更] adot-collector-config → adot-collector-config-ksm
items:
- key: adot-collector-config
path: adot-collector-config.yaml
name: adot-collector-config-volume
適用コマンド
kubectl apply -f k8s/metric/otel-kube-state-metrics.yaml
kubectl rollout restart statefulset/adot-collector -n fargate-container-insights
Step 3: CloudWatch でメトリクスを確認する
数分後、CloudWatch メトリクスコンソールで以下を確認します。
- Namespace:
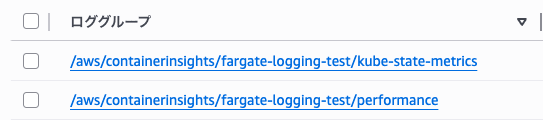
ContainerInsights/KubeStateMetrics - ロググループ:
/aws/containerinsights/<クラスター名>/kube-state-metrics
kube_deployment_status_replicas_unavailable が表示されていれば収集成功です。
Step 4: CloudWatch アラームで Pod 異常を検知する
Deployment 単位の Pod 異常検知には kube_deployment_status_replicas_unavailable(起動できていない Pod 数)を使います。
kube_pod_container_status_restarts_total は Pod 単位のカウンターで Deployment 単位での集計ができません。
理由は、このメトリクスのラベルが namespace・pod・container・uid のみで deployment ラベルを持たないためです(公式ドキュメント)。
kube_deployment_status_replicas_unavailable は CrashLoopBackOff に限らず、ImagePullBackOff や OOMKilled など「Pod が Ready にならない理由」全般を Deployment 単位でまとめて検知できます。
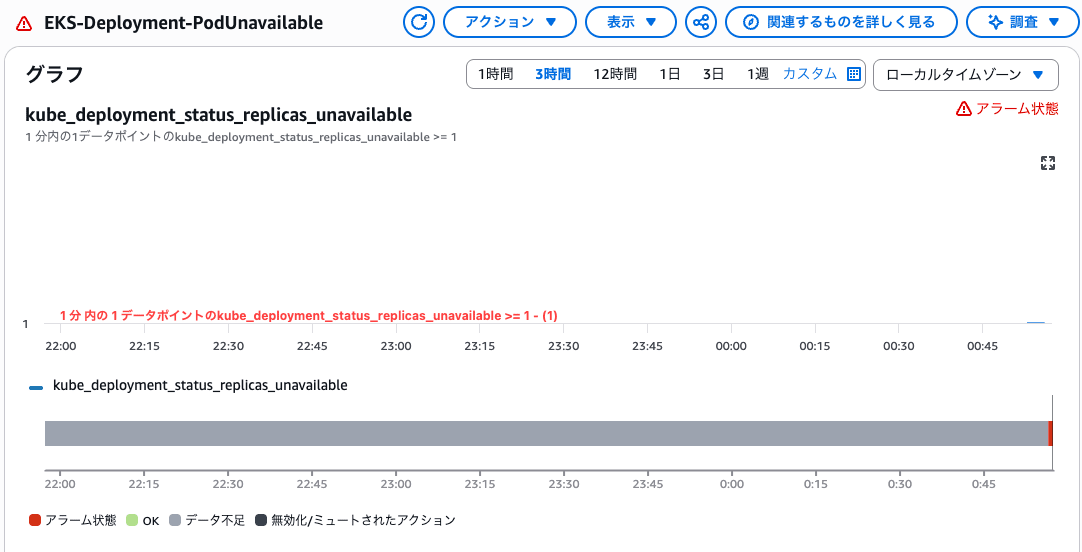
aws cloudwatch put-metric-alarm \
  --alarm-name "EKS-Deployment-PodUnavailable" \
  --namespace "ContainerInsights/KubeStateMetrics" \
  --metric-name "kube_deployment_status_replicas_unavailable" \
  --dimensions Name=ClusterName,Value=<your-cluster-name> Name=namespace,Value=<your-namespace> Name=deployment,Value=<your-deployment-name> \
  --statistic Maximum \
  --period 60 \
  --evaluation-periods 1 \
  --threshold 1 \
  --comparison-operator GreaterThanOrEqualToThreshold \
  --treat-missing-data notBreaching
どの Pod が原因かを特定したい場合は、kube_pod_container_status_restarts_total(Pod 単位)で掘り下げられます。
Step 5: CrashLoopBackOff を意図的に発生させて検証する
以下のマニフェストを適用して、クラッシュし続ける Pod を作成します。
apiVersion: apps/v1
kind: Deployment
metadata:
  name: crashloop-test
  namespace: <your-namespace>
spec:
  replicas: 1
  selector:
    matchLabels:
      app: crashloop-test
  template:
    metadata:
      labels:
        app: crashloop-test
    spec:
      containers:
        - name: crashloop-test
          image: busybox
          command: ["sh", "-c", "exit 1"]
kubectl apply -f k8s/app/deployment-crashloop-test.yaml
数分後に Pod の状態を確認します。
kubectl get pods -n <your-namespace>
# NAME                              READY   STATUS             RESTARTS   AGE
# crashloop-test-xxxxxxxxx-xxxxx    0/1     CrashLoopBackOff   5          3m
Pod が Ready にならないため kube_deployment_status_replicas_unavailable が 1 になり、CloudWatch アラームが ALARM 状態になります。
検証後は Pod を削除します。
kubectl delete -f k8s/app/deployment-crashloop-test.yaml
注意点・制約
- Fargate では
kube_node_*系メトリクスは実用的な値を返さない。Fargate Node は仮想ノードのため、Node レベルの情報は取得できない - kube-state-metrics は AWS 公式テンプレートに含まれていない。Kubernetes コミュニティプロジェクトであり、デプロイマニフェストは自前で用意する必要がある。EKS on Fargate では DaemonSet 不可のため Deployment として動かす点に注意する。
- kube-state-metrics の scrape_interval を短くしすぎるとコスト増につながる。本検証では 1 分間隔とした
まとめ
- kube-state-metrics を
fargate-container-insightsnamespace に Deployment としてデプロイし、ADOT の別パイプライン(metrics/ksm)でスクレイプする構成を構築できた - ADOT の ConfigMap は既存パイプラインを変更せず、receiver・processor・exporter・pipeline をそれぞれ追加するだけで対応できた
- cAdvisor(リソース使用量)と kube-state-metrics(Pod 状態)を組み合わせることで、EKS on Fargate の観測可能性が大きく向上した