![[アップデート] OTel Container Insights for Amazon EKS を利用できるようになりました](https://images.ctfassets.net/ct0aopd36mqt/wp-thumbnail-909b0303176e85a702b92f68e9d7ecba/67a829aa0886839b83f973e123190bd0/amazon-elastic_kubernetes_service?w=3840&fm=webp)
[アップデート] OTel Container Insights for Amazon EKS を利用できるようになりました
アップデート概要
OpenTelemetry をベースにした EKS 向け Container Insights を利用できるようになりました(パブリックプレビュー)。
EKS で Container Insights を利用する際、通常版、enhanced observability、OTel Container Insights の 3 バージョンが存在することになります。
| 項目 | Container Insights(通常) | Container Insights with enhanced observability | OTel Container Insights |
|---|---|---|---|
| ステータス | GA(2019年8月〜) | GA(2023年11月〜) | Public Preview(2026年4月〜) |
| エージェント | CloudWatchエージェント or ADOT or CloudWatch Observability EKS アドオン | CloudWatchエージェント or CloudWatch Observability EKS アドオン | CloudWatch Observability EKS アドオン v6.0.0+ |
| プロトコル | EMF(Embedded Metric Format) | EMF(Embedded Metric Format) | OTLP |
| メトリクスレベル | Cluster, Node, Pod, Namespace, Service | Cluster, Node, Pod, Container, Namespace, Service | ユーザー定義のものも含んだ最大150ラベル |
| コンテナレベルメトリクス | なし | あり | あり |
| コントロールプレーン監視 | なし | あり | あり |
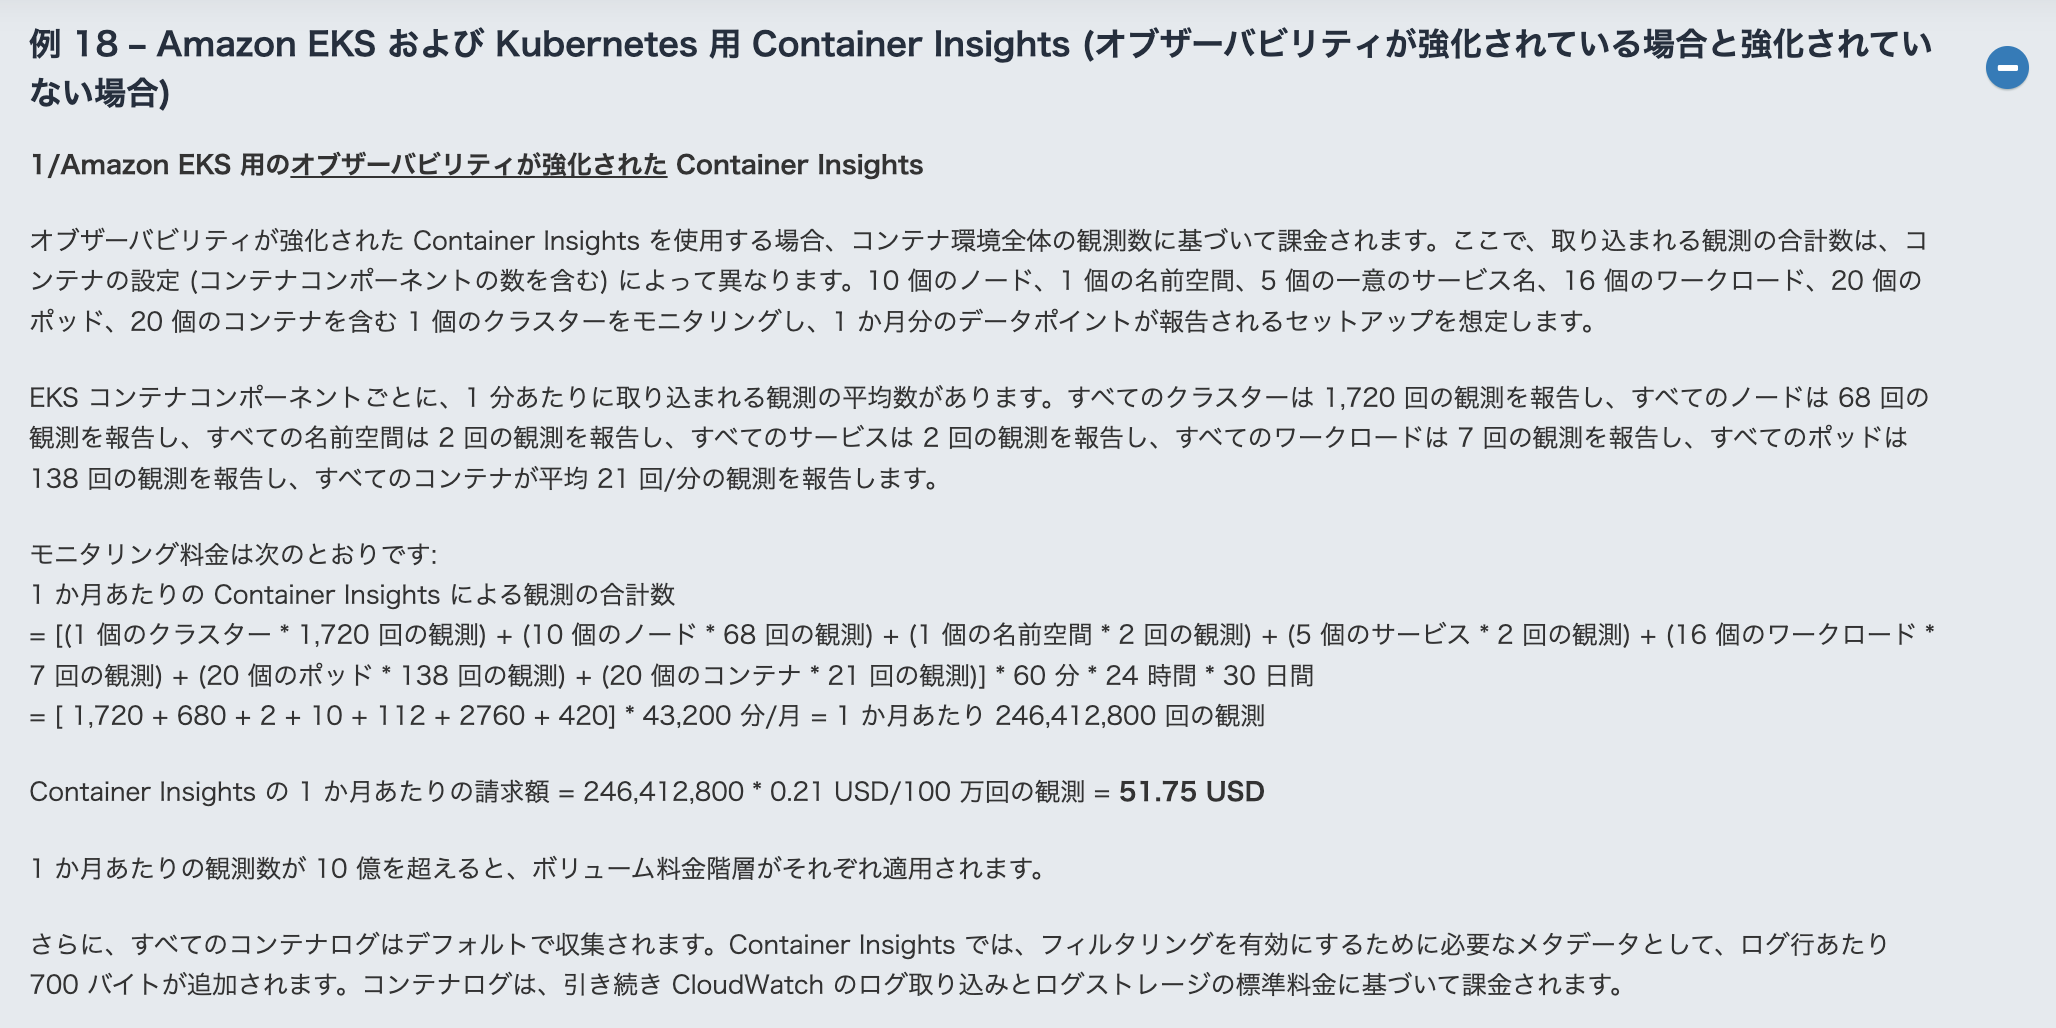
| 料金モデル | カスタムメトリクス課金 + CloudWatch ログの取り込み料金 | データポイント課金 (メトリクスに関する料金とログの取り込み料金がバンドルされる) | Preview 期間中は無料(GA 後の料金は未定) |
| PromQL サポート | なし | なし | あり(CloudWatch Query Studio) |
今回追加された OTel Container Insights はあくまで Container Insights with enhanced observability を OpenTelemetry ベースで実現したものであることに注意が必要です。
EKS on Fargate では Container Insights with enhanced observability を利用できない制約がありますが、EKS on Fargate + ADOT でも Container Insights with enhanced observability 相当のビューが使えるようになったわけではありません。
あくまで CloudWatch エージェントに依存した仕組みの中で OpenTelemetry ベースのアーキテクチャになっています。
Container Insights の進化
EKS on Fargate だと Enhanced Container Insights が利用できないとか、Enhanced Container Insights だとそもそも料金体系が違うという話はありますが、機能的には Enhanced Container Insights で強化され、OTel Container Insights でさらに強化されたと考えて良さそうです。
Enhanced Container Insights(2023年11月〜)
- コンテナレベルのメトリクスが追加され、より細かい粒度で監視可能になった
- GPU(NVIDIA)、Trainium/Inferentia、EFA など特殊なコンピューティング環境用のメトリクスが追加された
- API Server / etcd のコントロールプレーンメトリクスを収集可能になった
- メトリクス料金とログ料金がバンドルされ、コストを試算しやすくなった
OTel Container Insights(2026年4月〜)
- OTLP エンドポイントを利用した、より OpenTelemetry の標準的な仕様に即したメトリクス収集方式になった
- CloudWatch Query Studio で PromQL クエリが利用可能になった
- メトリクスごとに最大150のラベル(Kubernetes メタデータ、カスタムラベル、OTel セマンティック規約属性)を付与できるようになった
試してみる
Auto Mode を有効化した、バージョン 1.35 の EKS クラスターを作成して試してみます。
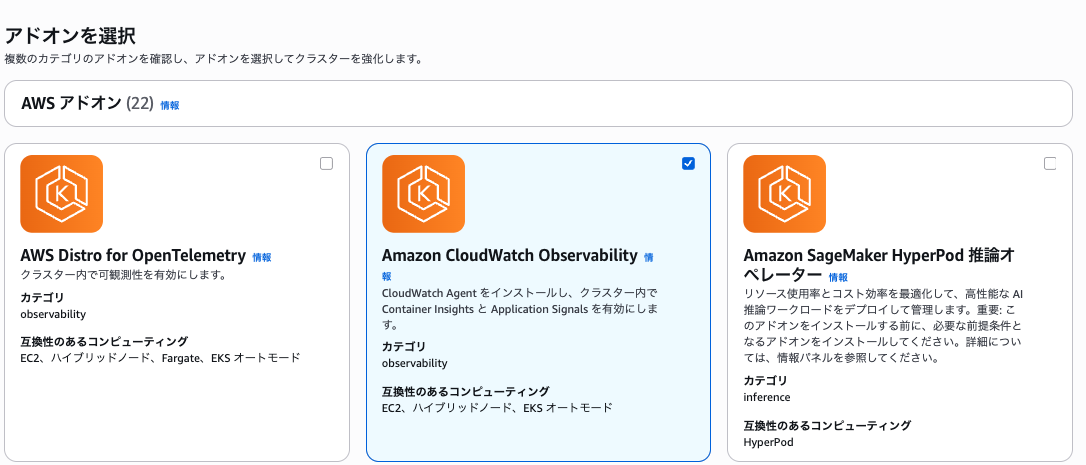
アドオンの追加
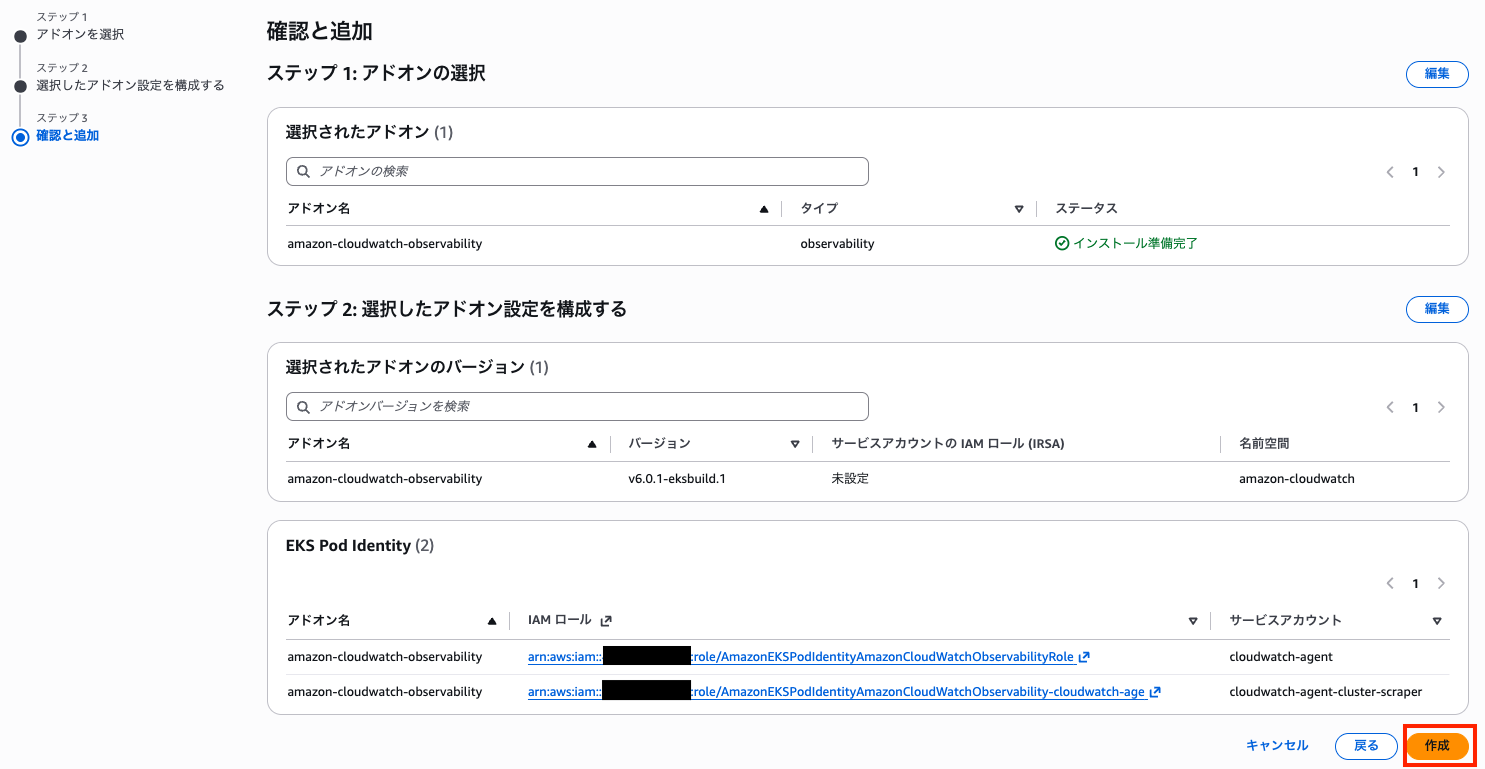
アドオンを追加します。
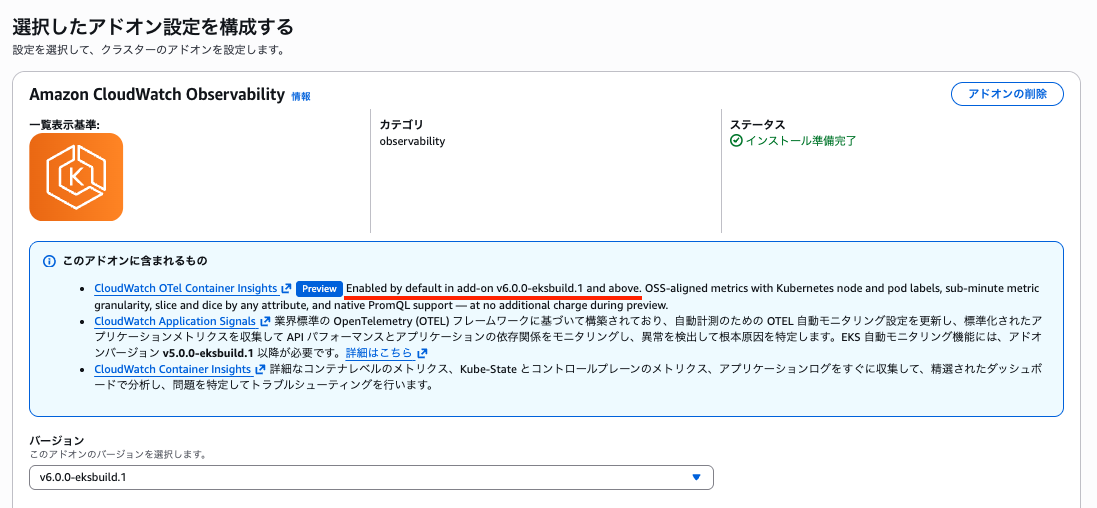
Amazon CloudWatch Observability EKS アドオンを選択します。
アドオンバージョンですが、ドキュメントには、v6.0.1-eksbuild.1 以降のバージョンが必要と書かれています。
To use Container Insights with OpenTelemetry metrics, install the Amazon CloudWatch Observability EKS add-on version v6.0.1-eksbuild.1 or later.
https://docs.aws.amazon.com/AmazonCloudWatch/latest/monitoring/deploy-container-insights-EKS.html
ただし、実際には v6 系以降のバージョンであれば利用できるようです。
アカウントに存在しない場合は、「推奨ロールを作成」をクリックして作成します。
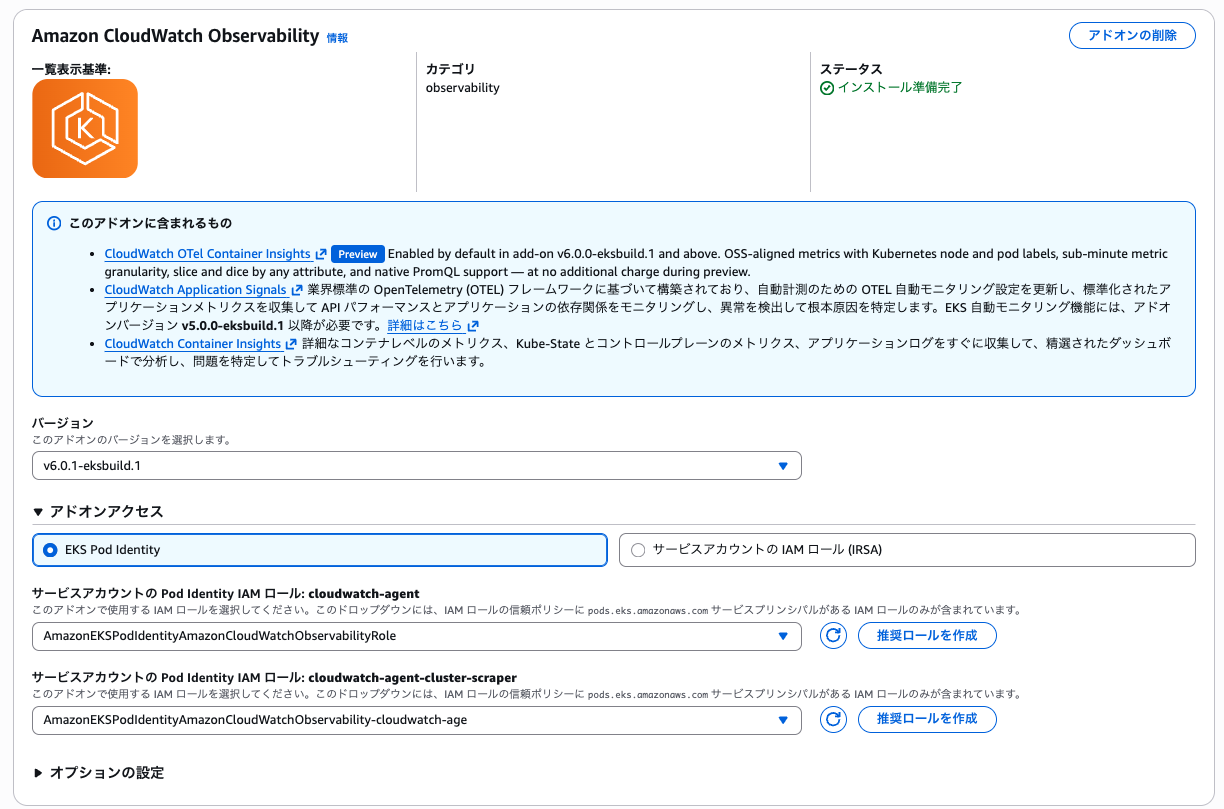
v6.x.x になってから、下記 2 つのリソースが追加されるようになりました。
- cloudwatch-agent (各ノードに DaemonSet として展開される)
- cloudwatch-agent-cluster-scraper (クラスター単位のメトリクスを取得するために Deployment として展開される)
それぞれ IAM ロールを設定できますが、権限はどちらも CloudWatchAgentServerPolicy - AWS 管理ポリシー を付与すれば問題ありません。
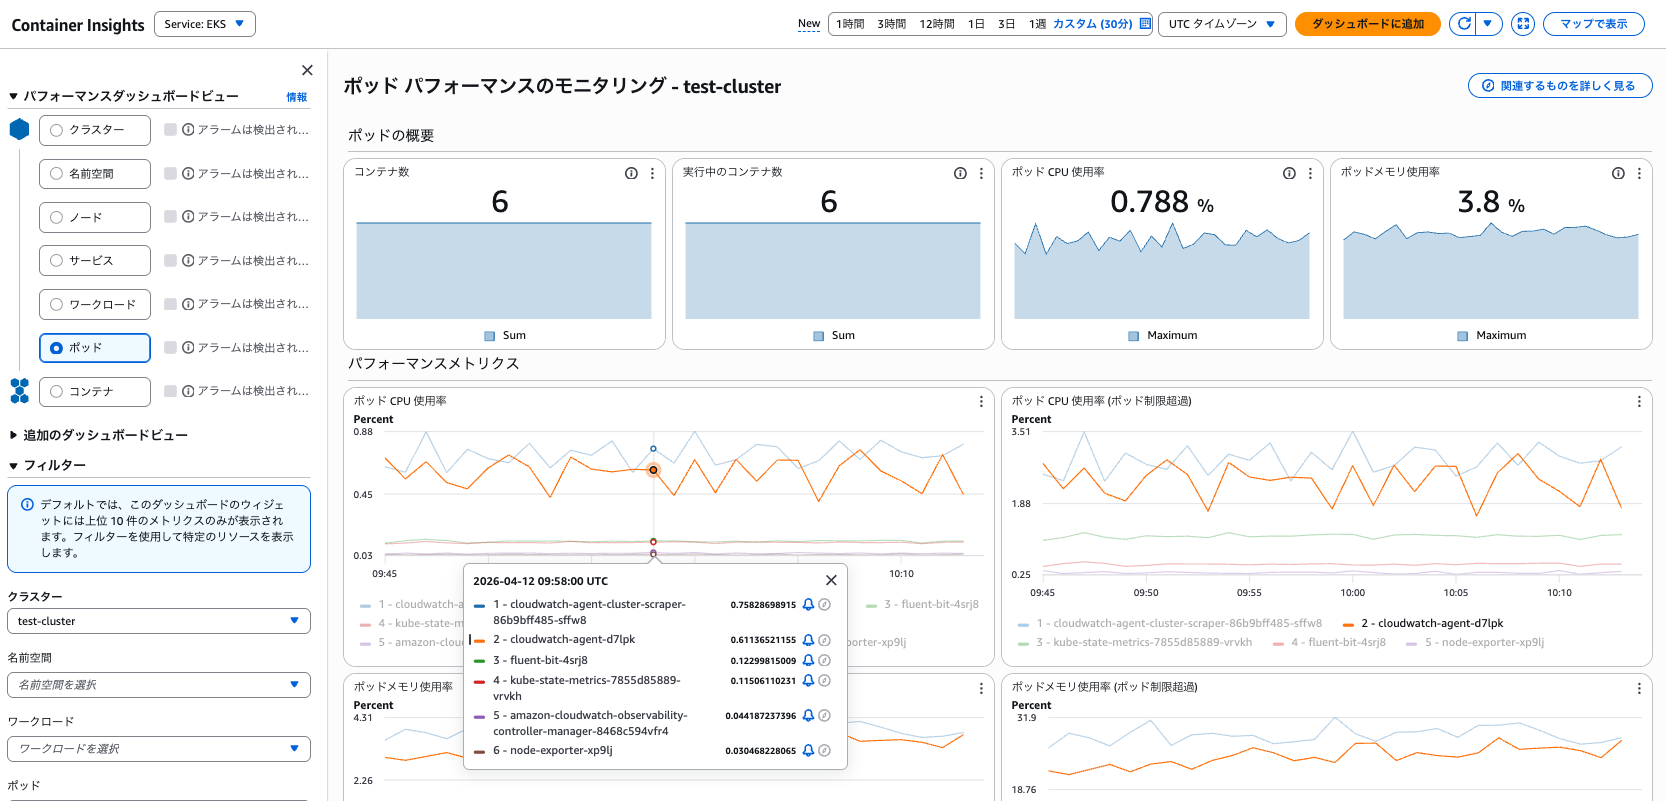
メトリクスの確認
インストールが完了すると、各種メトリクスが CloudWatch に連携されるようになります。
この辺りは Container Insights with enhanced observability と同じです。
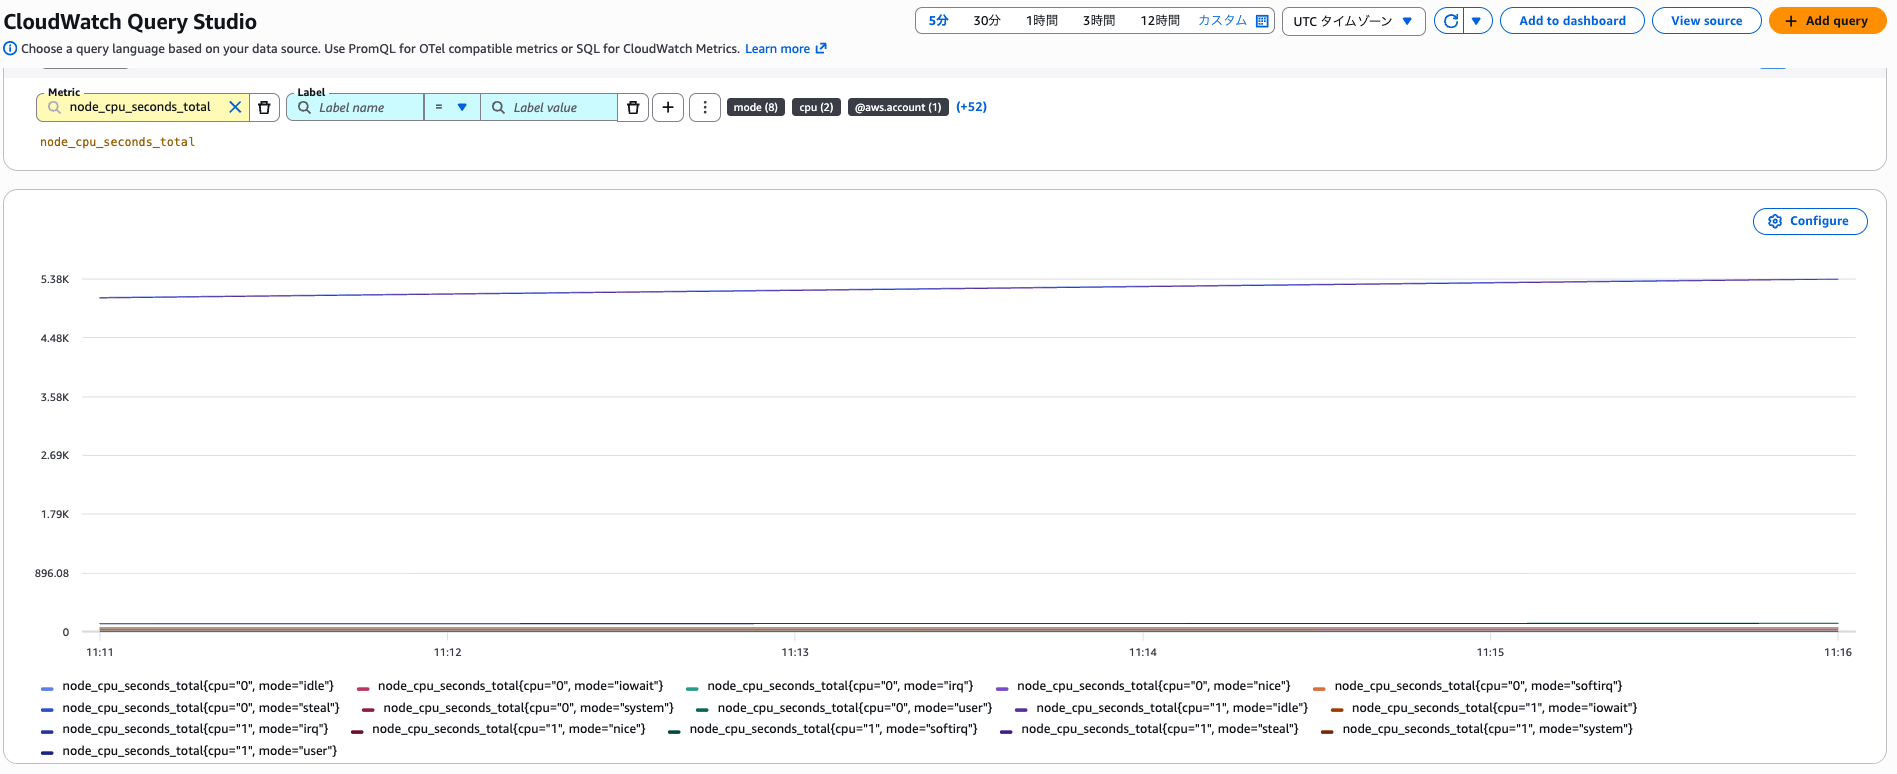
また、CloudWatch Query Studio から Prom QL でメトリクスを確認できるようになりました。
インストールされたコンポーネントの確認
v 5.x.x の CloudWatch Observability EKS アドオンを利用している場合、下記のような Kubernetes リソースが追加されます。
% kubectl get pod -A
NAMESPACE           NAME                                                              READY   STATUS    RESTARTS   AGE
amazon-cloudwatch   amazon-cloudwatch-observability-controller-manager-7d7b569t5bb6   1/1     Running   0          2m31s
amazon-cloudwatch   cloudwatch-agent-cf45k                                            1/1     Running   0          2m23s
amazon-cloudwatch   cloudwatch-agent-glksl                                            1/1     Running   0          2m24s
amazon-cloudwatch   fluent-bit-l2295                                                  1/1     Running   0          2m31s
amazon-cloudwatch   fluent-bit-tbsvq                                                  1/1     Running   0          2m31s
kube-system
v6.x.x の CloudWatch Observability EKS アドオンを利用している場合、下記のような Kubernetes リソースが追加されます。
% kubectl get pod -A
NAMESPACE           NAME                                                              READY   STATUS    RESTARTS   AGE
amazon-cloudwatch   amazon-cloudwatch-observability-controller-manager-5d76f674n5mc   1/1     Running   0          4h33m
amazon-cloudwatch   cloudwatch-agent-cluster-scraper-86b9bff485-wfngh                 1/1     Running   0          4h32m
amazon-cloudwatch   cloudwatch-agent-fvkh6                                            1/1     Running   0          4h32m
amazon-cloudwatch   fluent-bit-xbv7j                                                  1/1     Running   0          4h33m
amazon-cloudwatch   kube-state-metrics-7655bb7df5-z55k4                               1/1     Running   0          4h33m
amazon-cloudwatch   node-exporter-p9h2g                                               1/1     Running   0          4h33m
v6.x.x の CloudWatch Observability EKS アドオンを利用している場合、下記 3 種類のリソースが増えていることがわかります。
- node-exporter
- kube-state-metrics
- cloudwatch-agent-cluster-scraper
node-exporter や kube-state-metrics については、従来 CloudWatch エージェントが OS レベルのメトリクスを直接収集したり、API Server 経由で取得していた所を、Kubernetes エコシステム標準のメトリクス収集方式へと移行したと考えて良さそうです。
cloudwatch-agent-cluster-scraper は 602401143452.dkr.ecr.us-east-1.amazonaws.com/eks/observability/cloudwatch-agent:1.300066.0b1367 を利用した単なる CloudWatch エージェントでした。
クラスター単位のメトリクスを取得する際、DaemonSet として展開されている cloudwatch-agent が各ノードから重複してスクレイピングすることを防ぐため、クラスタ全体で1回だけ収集すべきものを担当しているようです。
cloudwatch-agent-cluster-scraper の Pod 情報
% kubectl describe pod cloudwatch-agent-cluster-scraper-86b9bff485-wfngh -n amazon-cloudwatch
Name:                 cloudwatch-agent-cluster-scraper-86b9bff485-wfngh
Namespace:            amazon-cloudwatch
Priority:             2000001000
Priority Class Name:  system-node-critical
Service Account:      cloudwatch-agent
Node:                 i-059a422b6465310a9/10.0.100.23
Start Time:           Sat, 18 Apr 2026 14:57:59 +0900
Labels:               app.kubernetes.io/component=amazon-cloudwatch-agent
                      app.kubernetes.io/instance=amazon-cloudwatch.cloudwatch-agent-cluster-scraper
                      app.kubernetes.io/managed-by=amazon-cloudwatch-agent-operator
                      app.kubernetes.io/name=cloudwatch-agent-cluster-scraper
                      app.kubernetes.io/part-of=amazon-cloudwatch-agent
                      app.kubernetes.io/version=1.300066.0b1367
                      pod-template-hash=86b9bff485
                      topology.kubernetes.io/region=us-east-1
                      topology.kubernetes.io/zone=us-east-1a
Annotations:          amazon-cloudwatch-agent-operator-config/sha256: a08d38b4a834ea3b4a24dc066b3f8b24000c66737bb3a515d18ab8c4575f1a51
Status:               Running
IP:                   10.0.100.23
IPs:
  IP:           10.0.100.23
Controlled By:  ReplicaSet/cloudwatch-agent-cluster-scraper-86b9bff485
Containers:
  otc-container:
    Container ID:   containerd://5208d99b8946e0f94b46ac6a167e24e9da55d6febd9f97fead7d8229735b07f9
    Image:          602401143452.dkr.ecr.us-east-1.amazonaws.com/eks/observability/cloudwatch-agent:1.300066.0b1367
    Image ID:       602401143452.dkr.ecr.us-east-1.amazonaws.com/eks/observability/cloudwatch-agent@sha256:522d36eb276e7764b5cab0c2c5e620ac0f2bb76c9fea99d4543cf2621625f824
    Port:           <none>
    Host Port:      <none>
    State:          Running
      Started:      Sat, 18 Apr 2026 14:58:01 +0900
    Ready:          True
    Restart Count:  0
    Limits:
      cpu:     500m
      memory:  512Mi
    Requests:
      cpu:     250m
      memory:  128Mi
    Environment:
      K8S_NODE_NAME:                            (v1:spec.nodeName)
      HOST_IP:                                  (v1:status.hostIP)
      HOST_NAME:                                (v1:spec.nodeName)
      K8S_NAMESPACE:                           amazon-cloudwatch (v1:metadata.namespace)
      K8S_CLUSTER_NAME:                        test-cluster
      POD_NAME:                                cloudwatch-agent-cluster-scraper-86b9bff485-wfngh (v1:metadata.name)
      AWS_STS_REGIONAL_ENDPOINTS:              regional
      AWS_DEFAULT_REGION:                      us-east-1
      AWS_REGION:                              us-east-1
      AWS_CONTAINER_CREDENTIALS_FULL_URI:      http://169.254.170.23/v1/credentials
      AWS_CONTAINER_AUTHORIZATION_TOKEN_FILE:  /var/run/secrets/pods.eks.amazonaws.com/serviceaccount/eks-pod-identity-token
    Mounts:
      /dev/disk from devdisk (ro)
      /etc/amazon-cloudwatch-observability-agent-cert from agenttls (ro)
      /etc/amazon-cloudwatch-observability-agent-client-cert from agentclienttls (ro)
      /etc/amazon-cloudwatch-observability-agent-server-cert from agentservertls (ro)
      /etc/amazon-cloudwatch-observability-agent-ta-client-cert from agenttaclienttls (ro)
      /etc/cwagentconfig from otc-internal (rw)
      /rootfs from rootfs (ro)
      /run/containerd/containerd.sock from containerdsock (rw)
      /sys from sys (ro)
      /var/lib/containers from criocontainer (ro)
      /var/lib/docker from varlibdocker (ro)
      /var/lib/kubelet/pod-resources from kubelet-podresources (rw)
      /var/log/pods from criologs (ro)
      /var/run/crio/crio.sock from criosock (ro)
      /var/run/docker.sock from dockersock (ro)
      /var/run/secrets/kubernetes.io/serviceaccount from kube-api-access-m6k2b (ro)
      /var/run/secrets/pods.eks.amazonaws.com/serviceaccount from eks-pod-identity-token (ro)
Conditions:
  Type                        Status
  PodReadyToStartContainers   True
  Initialized                 True
  Ready                       True
  ContainersReady             True
  PodScheduled                True
Volumes:
  eks-pod-identity-token:
    Type:                    Projected (a volume that contains injected data from multiple sources)
    TokenExpirationSeconds:  83157
  otc-internal:
    Type:      ConfigMap (a volume populated by a ConfigMap)
    Name:      cloudwatch-agent-cluster-scraper
    Optional:  false
  kubelet-podresources:
    Type:          HostPath (bare host directory volume)
    Path:          /var/lib/kubelet/pod-resources
    HostPathType:  Directory
  rootfs:
    Type:          HostPath (bare host directory volume)
    Path:          /
    HostPathType:
  dockersock:
    Type:          HostPath (bare host directory volume)
    Path:          /var/run/docker.sock
    HostPathType:
  varlibdocker:
    Type:          HostPath (bare host directory volume)
    Path:          /var/lib/docker
    HostPathType:
  containerdsock:
    Type:          HostPath (bare host directory volume)
    Path:          /run/containerd/containerd.sock
    HostPathType:
  criosock:
    Type:          HostPath (bare host directory volume)
    Path:          /var/run/crio/crio.sock
    HostPathType:
  criocontainer:
    Type:          HostPath (bare host directory volume)
    Path:          /var/lib/containers
    HostPathType:
  criologs:
    Type:          HostPath (bare host directory volume)
    Path:          /var/log/pods
    HostPathType:
  sys:
    Type:          HostPath (bare host directory volume)
    Path:          /sys
    HostPathType:
  devdisk:
    Type:          HostPath (bare host directory volume)
    Path:          /dev/disk/
    HostPathType:
  agenttls:
    Type:        Secret (a volume populated by a Secret)
    SecretName:  amazon-cloudwatch-observability-agent-cert
    Optional:    false
  agentclienttls:
    Type:        Secret (a volume populated by a Secret)
    SecretName:  amazon-cloudwatch-observability-agent-client-cert
    Optional:    false
  agentservertls:
    Type:        Secret (a volume populated by a Secret)
    SecretName:  amazon-cloudwatch-observability-agent-server-cert
    Optional:    false
  agenttaclienttls:
    Type:        Secret (a volume populated by a Secret)
    SecretName:  amazon-cloudwatch-observability-agent-ta-client-cert
    Optional:    false
  kube-api-access-m6k2b:
    Type:                    Projected (a volume that contains injected data from multiple sources)
    TokenExpirationSeconds:  3607
    ConfigMapName:           kube-root-ca.crt
    ConfigMapOptional:       <nil>
    DownwardAPI:             true
QoS Class:                   Burstable
Node-Selectors:              kubernetes.io/os=linux
Tolerations:                 op=Exists
Events:                      <none>
CloudWatch エージェントの設定となる ConfigMap を確認しても、kube-state-metrics や API Server からメトリクスを読み取って、CloudWatch のOTLP メトリクスエンドポイントに送信していることがわかります。
exporters:
  otlphttp/cw_k8s_ci_v0_cwotel:
    auth:
      authenticator: sigv4auth/cw_k8s_ci_v0_cwotel
    endpoint: https://monitoring.us-east-1.amazonaws.com:443
    tls:
      insecure: false
cloudwatch-agent-cluster-scraper の 設定
% kubectl describe cm cloudwatch-agent-cluster-scraper -n amazon-cloudwatch
Name:         cloudwatch-agent-cluster-scraper
Namespace:    amazon-cloudwatch
Labels:       app.kubernetes.io/component=amazon-cloudwatch-agent
              app.kubernetes.io/instance=amazon-cloudwatch.cloudwatch-agent-cluster-scraper
              app.kubernetes.io/managed-by=amazon-cloudwatch-agent-operator
              app.kubernetes.io/name=cloudwatch-agent-cluster-scraper
              app.kubernetes.io/part-of=amazon-cloudwatch-agent
              app.kubernetes.io/version=1.300066.0b1367
Annotations:  <none>

Data
====
cwagentconfig.json:
----
{"agent":{"region":"us-east-1"}}

cwagentotelconfig.yaml:
----
exporters:
  otlphttp/cw_k8s_ci_v0_cwotel:
    auth:
      authenticator: sigv4auth/cw_k8s_ci_v0_cwotel
    endpoint: https://monitoring.us-east-1.amazonaws.com:443
    tls:
      insecure: false
extensions:
  sigv4auth/cw_k8s_ci_v0_cwotel:
    region: us-east-1
    service: monitoring
processors:
  awsattributelimit/cw_k8s_ci_v0:
    max_total_attributes: 150
  batch/cw_k8s_ci_v0_cwotel:
    send_batch_max_size: 500
    send_batch_size: 500
    timeout: 10s
  filter/cw_k8s_ci_v0_apiserver_build_info:
    error_mode: ignore
    metrics:
      metric:
      - name == "kubernetes_build_info"
  filter/cw_k8s_ci_v0_scrape_metadata:
    error_mode: ignore
    metrics:
      metric:
      - IsMatch(name, "^(up|scrape_duration_seconds|scrape_samples_scraped|scrape_samples_post_metric_relabeling|scrape_series_added)$")
  groupbyattrs/cw_k8s_ci_v0_ksm:
    keys:
    - pod
    - namespace
    - uid
    - node
    - container
    - owner_name
    - owner_kind
  k8sattributes/cw_k8s_ci_v0_node:
    auth_type: serviceAccount
    extract:
      labels:
      - from: node
        key_regex: (.*)
        tag_name: k8s.node.label.$$$1
      metadata:
      - k8s.node.name
    passthrough: false
    pod_association:
    - sources:
      - from: resource_attribute
        name: k8s.node.name
  metricstarttime/cw_k8s_ci_v0: {}
  resourcedetection/cw_k8s_ci_v0:
    detectors:
    - ec2
    - eks
    ec2:
      resource_attributes:
        cloud.account.id:
          enabled: true
        cloud.availability_zone:
          enabled: true
        cloud.platform:
          enabled: true
        cloud.provider:
          enabled: true
        cloud.region:
          enabled: true
        host.id:
          enabled: false
        host.image.id:
          enabled: false
        host.name:
          enabled: false
        host.type:
          enabled: false
  transform/cw_k8s_ci_v0_apiserver_cleanup_version:
    error_mode: ignore
    metric_statements:
    - context: resource
      statements:
      - delete_key(attributes, "k8s.apiserver.version") where attributes["k8s.apiserver.version"]
        != nil
  transform/cw_k8s_ci_v0_apiserver_extract_version:
    error_mode: ignore
    metric_statements:
    - context: datapoint
      statements:
      - set(resource.attributes["k8s.apiserver.version"], attributes["git_version"])
        where attributes["git_version"] != nil and attributes["git_version"] != ""
  transform/cw_k8s_ci_v0_clear_schema_url:
    error_mode: ignore
    metric_statements:
    - context: resource
      statements:
      - set(resource.schema_url, "")
  transform/cw_k8s_ci_v0_ksm_clean_resource:
    error_mode: ignore
    metric_statements:
    - context: resource
      statements:
      - delete_key(attributes, "k8s.pod.name")
      - delete_key(attributes, "k8s.pod.uid")
      - delete_key(attributes, "k8s.namespace.name")
      - delete_key(attributes, "k8s.node.name")
      - delete_key(attributes, "k8s.container.name")
      - delete_key(attributes, "k8s.deployment.name")
      - delete_key(attributes, "k8s.replicaset.name")
      - delete_key(attributes, "k8s.workload.name")
      - delete_key(attributes, "k8s.workload.type")
      - delete_key(attributes, "host.id")
      - delete_key(attributes, "host.name")
      - delete_key(attributes, "host.type")
      - delete_key(attributes, "host.image.id")
  transform/cw_k8s_ci_v0_ksm_promote:
    error_mode: ignore
    metric_statements:
    - context: resource
      statements:
      - set(attributes["k8s.pod.name"], attributes["pod"]) where attributes["pod"]
        != nil
      - delete_key(attributes, "pod") where attributes["pod"] != nil
      - set(attributes["k8s.namespace.name"], attributes["namespace"]) where attributes["namespace"]
        != nil
      - delete_key(attributes, "namespace") where attributes["namespace"] != nil
      - set(attributes["k8s.node.name"], attributes["node"]) where attributes["node"]
        != nil
      - delete_key(attributes, "node") where attributes["node"] != nil
      - set(attributes["k8s.pod.uid"], attributes["uid"]) where attributes["uid"]
        != nil
      - delete_key(attributes, "uid") where attributes["uid"] != nil
      - set(attributes["k8s.container.name"], attributes["container"]) where attributes["container"]
        != nil
      - delete_key(attributes, "container") where attributes["container"] != nil
      - set(attributes["k8s.workload.name"], attributes["owner_name"]) where attributes["owner_name"]
        != nil
      - set(attributes["k8s.workload.type"], attributes["owner_kind"]) where attributes["owner_kind"]
        != nil
      - delete_key(attributes, "owner_name") where attributes["owner_name"] != nil
      - delete_key(attributes, "owner_kind") where attributes["owner_kind"] != nil
  transform/cw_k8s_ci_v0_promote_component:
    error_mode: ignore
    metric_statements:
    - context: datapoint
      statements:
      - set(resource.attributes["k8s.component.name"], attributes["component"])
  transform/cw_k8s_ci_v0_set_cloud_resource_id:
    error_mode: ignore
    metric_statements:
    - context: resource
      statements:
      - set(resource.attributes["cloud.resource_id"], Concat(["arn:aws:eks:", resource.attributes["cloud.region"],
        ":", resource.attributes["cloud.account.id"], ":cluster/", resource.attributes["k8s.cluster.name"]],
        "")) where resource.attributes["cloud.region"] != nil and resource.attributes["cloud.account.id"]
        != nil and resource.attributes["k8s.cluster.name"] != nil
  transform/cw_k8s_ci_v0_set_cluster_name:
    error_mode: ignore
    metric_statements:
    - context: datapoint
      statements:
      - set(resource.attributes["k8s.cluster.name"], "test-cluster")
  transform/cw_k8s_ci_v0_set_component:
    error_mode: ignore
    metric_statements:
    - context: datapoint
      statements:
      - set(attributes["component"], "apiserver")
  transform/cw_k8s_ci_v0_set_scope_apiserver:
    error_mode: ignore
    metric_statements:
    - context: scope
      statements:
      - set(scope.version, resource.attributes["k8s.apiserver.version"]) where resource.attributes["k8s.apiserver.version"]
        != nil
      - set(scope.schema_url, "")
      - set(attributes["cloudwatch.source"], "cloudwatch-agent")
      - set(attributes["cloudwatch.solution"], "k8s-otel-container-insights")
      - set(attributes["cloudwatch.pipeline"], "apiserver")
  transform/cw_k8s_ci_v0_set_scope_kube_state_metrics:
    error_mode: ignore
    metric_statements:
    - context: scope
      statements:
      - set(scope.name, "github.com/kubernetes/kube-state-metrics")
      - set(scope.version, "v2.18.0-eksbuild.1")
      - set(scope.schema_url, "")
      - set(attributes["cloudwatch.source"], "cloudwatch-agent")
      - set(attributes["cloudwatch.solution"], "k8s-otel-container-insights")
      - set(attributes["cloudwatch.pipeline"], "kube-state-metrics")
  transform/cw_k8s_ci_v0_set_unit:
    error_mode: ignore
    metric_statements:
    - context: metric
      statements:
      - set(unit, "s") where IsMatch(name, ".*_seconds(_total)?$")
      - set(unit, "ms") where IsMatch(name, ".*_milliseconds(_total)?$")
      - set(unit, "us") where IsMatch(name, ".*_microseconds(_total)?$")
      - set(unit, "ns") where IsMatch(name, ".*_nanoseconds(_total)?$")
      - set(unit, "By") where IsMatch(name, ".*_bytes(_total)?$")
      - set(unit, "KBy") where IsMatch(name, ".*_kilobytes(_total)?$")
      - set(unit, "MBy") where IsMatch(name, ".*_megabytes(_total)?$")
      - set(unit, "GBy") where IsMatch(name, ".*_gigabytes(_total)?$")
      - set(unit, "KiBy") where IsMatch(name, ".*_kibibytes(_total)?$")
      - set(unit, "MiBy") where IsMatch(name, ".*_mebibytes(_total)?$")
      - set(unit, "GiBy") where IsMatch(name, ".*_gibibytes(_total)?$")
      - set(unit, "Cel") where IsMatch(name, ".*_celsius$")
      - set(unit, "Hz") where IsMatch(name, ".*_hertz$")
      - set(unit, "1") where IsMatch(name, ".*_ratio$")
      - set(unit, "%") where IsMatch(name, ".*_percent$")
      - set(unit, "V") where IsMatch(name, ".*_volts$")
      - set(unit, "W") where IsMatch(name, ".*_watts$")
      - set(unit, "J") where IsMatch(name, ".*_joules$")
      - set(unit, "A") where IsMatch(name, ".*_amperes$")
      - set(unit, "m") where IsMatch(name, ".*_meters(_total)?$")
      - set(unit, "1") where unit == "" and IsMatch(name, ".*_total$")
receivers:
  prometheus/cw_k8s_ci_v0_apiserver:
    config:
      scrape_configs:
      - bearer_token_file: /var/run/secrets/kubernetes.io/serviceaccount/token
        job_name: kubernetes-apiserver
        kubernetes_sd_configs:
        - namespaces:
            names:
            - default
          role: endpoints
        relabel_configs:
        - action: keep
          regex: kubernetes
          source_labels:
          - __meta_kubernetes_service_name
        - action: keep
          regex: https
          source_labels:
          - __meta_kubernetes_endpoint_port_name
        - replacement: /metrics
          target_label: __metrics_path__
        scheme: https
        scrape_interval: 30s
        scrape_timeout: 10s
        tls_config:
          ca_file: /var/run/secrets/kubernetes.io/serviceaccount/ca.crt
          insecure_skip_verify: false
  prometheus/cw_k8s_ci_v0_kube_state_metrics:
    config:
      scrape_configs:
      - job_name: kube-state-metrics
        scheme: https
        scrape_interval: 30s
        scrape_timeout: 10s
        static_configs:
        - targets:
          - kube-state-metrics.amazon-cloudwatch.svc:8443
        tls_config:
          ca_file: /etc/amazon-cloudwatch-observability-agent-cert/tls-ca.crt
service:
  extensions:
  - sigv4auth/cw_k8s_ci_v0_cwotel
  pipelines:
    metrics/cw_k8s_ci_v0_apiserver:
      exporters:
      - otlphttp/cw_k8s_ci_v0_cwotel
      processors:
      - filter/cw_k8s_ci_v0_scrape_metadata
      - transform/cw_k8s_ci_v0_set_unit
      - metricstarttime/cw_k8s_ci_v0
      - transform/cw_k8s_ci_v0_apiserver_extract_version
      - filter/cw_k8s_ci_v0_apiserver_build_info
      - transform/cw_k8s_ci_v0_set_scope_apiserver
      - transform/cw_k8s_ci_v0_apiserver_cleanup_version
      - transform/cw_k8s_ci_v0_set_cluster_name
      - transform/cw_k8s_ci_v0_set_component
      - transform/cw_k8s_ci_v0_promote_component
      - resourcedetection/cw_k8s_ci_v0
      - transform/cw_k8s_ci_v0_clear_schema_url
      - transform/cw_k8s_ci_v0_set_cloud_resource_id
      - awsattributelimit/cw_k8s_ci_v0
      - batch/cw_k8s_ci_v0_cwotel
      receivers:
      - prometheus/cw_k8s_ci_v0_apiserver
    metrics/cw_k8s_ci_v0_kube_state_metrics:
      exporters:
      - otlphttp/cw_k8s_ci_v0_cwotel
      processors:
      - filter/cw_k8s_ci_v0_scrape_metadata
      - transform/cw_k8s_ci_v0_set_unit
      - metricstarttime/cw_k8s_ci_v0
      - transform/cw_k8s_ci_v0_set_scope_kube_state_metrics
      - transform/cw_k8s_ci_v0_set_cluster_name
      - transform/cw_k8s_ci_v0_ksm_clean_resource
      - groupbyattrs/cw_k8s_ci_v0_ksm
      - transform/cw_k8s_ci_v0_ksm_promote
      - k8sattributes/cw_k8s_ci_v0_node
      - resourcedetection/cw_k8s_ci_v0
      - transform/cw_k8s_ci_v0_clear_schema_url
      - transform/cw_k8s_ci_v0_set_cloud_resource_id
      - awsattributelimit/cw_k8s_ci_v0
      - batch/cw_k8s_ci_v0_cwotel
      receivers:
      - prometheus/cw_k8s_ci_v0_kube_state_metrics


BinaryData
====

Events:  <none>
取得できるメトリクスについて
OTel Container Insights で収集されるメトリクスは下表の通りです。
| ソース | メトリクスカテゴリリ | 前提条件 |
|---|---|---|
| cAdvisor | CPU | なし |
| cAdvisor | メモリ | なし |
| cAdvisor | ネットワーク | なし |
| cAdvisor | ディスク・ファイルシステム | なし |
| Prometheus Node Exporter | CPU | なし |
| Prometheus Node Exporter | メモリ | なし |
| Prometheus Node Exporter | ディスク | なし |
| Prometheus Node Exporter | ファイルシステム | なし |
| Prometheus Node Exporter | ネットワーク | なし |
| Prometheus Node Exporter | システム | なし |
| Prometheus Node Exporter | VMStat | なし |
| Prometheus Node Exporter | Netstat・ソケット | なし |
| NVIDIA DCGM | GPU 利用率・性能 | NVIDIA device plugin / container toolkit が必要 |
| NVIDIA DCGM | GPU メモリ | 同上 |
| NVIDIA DCGM | GPU 電力・温度 | 同上 |
| NVIDIA DCGM | GPU スロットリング | 同上 |
| NVIDIA DCGM | GPU エラー・信頼性 | 同上 |
| NVIDIA DCGM | GPU NVLink | 同上 |
| NVIDIA DCGM | GPU 情報系 | 同上 |
| AWS Neuron Monitor | NeuronCore | Neuron driver / device plugin が必要 |
| AWS Neuron Monitor | NeuronDevice | 同上 |
| AWS Neuron Monitor | Neuron システム | 同上 |
| AWS Elastic Fabric Adapter | EFA メトリクス | EFA device plugin が必要 |
| NVMe | NVMe SMART | なし |
| Kube State Metrics | Pod / node / Deployment / DaemonSet / StatefulSet / ReplicaSet / Job / CronJob / Service / Namespace / PersistentVolume / PersistentVolumeClaim 関連 | なし |
| Kubernetes API server | API サーバーおよび etcd | なし |
Container Insights with OpenTelemetry metrics for Amazon EKS | Amazon CloudWatch
基本的には Container Insights with enhanced observability で取得できるメトリクスと同じです。
ただし、SageMaker AI HyperPod 関連のメトリクスが消えていることには注意が必要です。
CloudWatch Observability EKS アドオンからカスタム Prometheus スクレイプターゲットを追加して PromQL でクエリしてみる
CloudWatch Observability EKS アドオンでは、カスタム Prometheus スクレイプターゲットを追加することができます。
OTel Container Insights でも同様のことができると思われるので試してみます。
まず、nginx-exporter を含めた Nginx をデプロイします。
Nginx の設定
apiVersion: apps/v1
kind: Deployment
metadata:
  namespace: default
  name: nginx
  labels:
    app.kubernetes.io/name: nginx
spec:
  selector:
    matchLabels:
      app.kubernetes.io/name: nginx
  replicas: 1
  template:
    metadata:
      labels:
        app.kubernetes.io/name: nginx
      annotations:
        prometheus.io/scrape: "true"
        prometheus.io/port: "9113"
        prometheus.io/path: "/metrics"
    spec:
      containers:
        - image: nginx
          imagePullPolicy: Always
          name: nginx
          ports:
            - containerPort: 80
          volumeMounts:
            - name: nginx-config
              mountPath: /etc/nginx/conf.d
        - name: nginx-exporter
          image: nginx/nginx-prometheus-exporter:0.11.0
          args:
            - -nginx.scrape-uri=http://127.0.0.1/nginx_status
          ports:
            - containerPort: 9113
              name: metrics
      volumes:
        - name: nginx-config
          configMap:
            name: nginx-config
---
apiVersion: v1
kind: ConfigMap
metadata:
  namespace: default
  name: nginx-config
data:
  default.conf: |
    server {
        listen 80;
        server_name localhost;

        location / {
            root /usr/share/nginx/html;
            index index.html index.htm;
        }

        # nginx status endpoint for prometheus exporter
        location /nginx_status {
            stub_status on;
            access_log off;
            allow 127.0.0.1;
            deny all;
        }
    }
---
apiVersion: v1
kind: Service
metadata:
  namespace: default
  name: nginx-service
  labels:
    app.kubernetes.io/name: nginx
  annotations:
    prometheus.io/scrape: "true"
    prometheus.io/port: "9113"
    prometheus.io/path: "/metrics"
spec:
  selector:
    app.kubernetes.io/name: nginx
  ports:
    - name: http
      port: 80
      targetPort: 80
    - name: metrics
      port: 9113
      targetPort: 9113
  type: ClusterIP
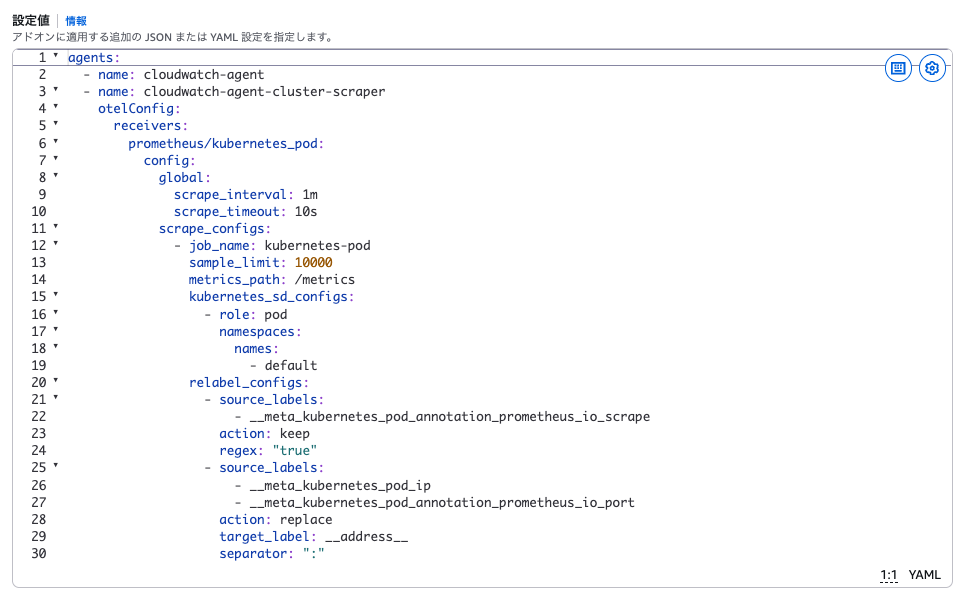
続いて、CloudWatch Observability EKS アドオンで下記追加設定を行います。
agents:
  - name: cloudwatch-agent
  - name: cloudwatch-agent-cluster-scraper
    otelConfig:
      receivers:
        prometheus/kubernetes_pod:
          config:
            global:
              scrape_interval: 1m
              scrape_timeout: 10s
            scrape_configs:
              - job_name: kubernetes-pod
                sample_limit: 10000
                metrics_path: /metrics
                kubernetes_sd_configs:
                  - role: pod
                    namespaces:
                      names:
                        - default
                relabel_configs:
                  - source_labels:
                      - __meta_kubernetes_pod_annotation_prometheus_io_scrape
                    action: keep
                    regex: "true"
                  - source_labels:
                      - __meta_kubernetes_pod_ip
                      - __meta_kubernetes_pod_annotation_prometheus_io_port
                    action: replace
                    target_label: __address__
                    separator: ":"
                  - source_labels:
                      - __meta_kubernetes_pod_annotation_prometheus_io_path
                    action: replace
                    target_label: __metrics_path__
                    regex: (.+)
                  - source_labels:
                      - __meta_kubernetes_namespace
                    action: replace
                    target_label: Namespace
                  - source_labels:
                      - __meta_kubernetes_pod_name
                    action: replace
                    target_label: pod_name
                  - source_labels:
                      - __meta_kubernetes_pod_container_name
                    action: replace
                    target_label: container_name
                  - source_labels:
                      - __meta_kubernetes_pod_label_app_kubernetes_io_name
                    action: replace
                    target_label: app
      service:
        pipelines:
          metrics/kubernetes_pod:
            receivers:
              - prometheus/kubernetes_pod
            exporters:
              - otlphttp/cw_k8s_ci_v0_cwotel
今回は default 名前空間で prometheus.io/scrape: "true" ラベルを付与した Pod を全てスクレイピング対象にしています。
また、名前空間やラベルでフィルタリングしつつ、クラスター全体でスクレイピングしたいのでcloudwatch-agent-cluster-scraper を利用しています。
この際、cloudwatch-agent 側に意図せず設定が入ってしまいエラーになってしまったので、追加設定無しで下記行を追加しています。
- name: cloudwatch-agent
既存の exporters 経由でメトリクスを転送できるよう、pipelines 設定も忘れずに行う必要があります。
マネジメントコンソールから追加設定を行い、更新します。
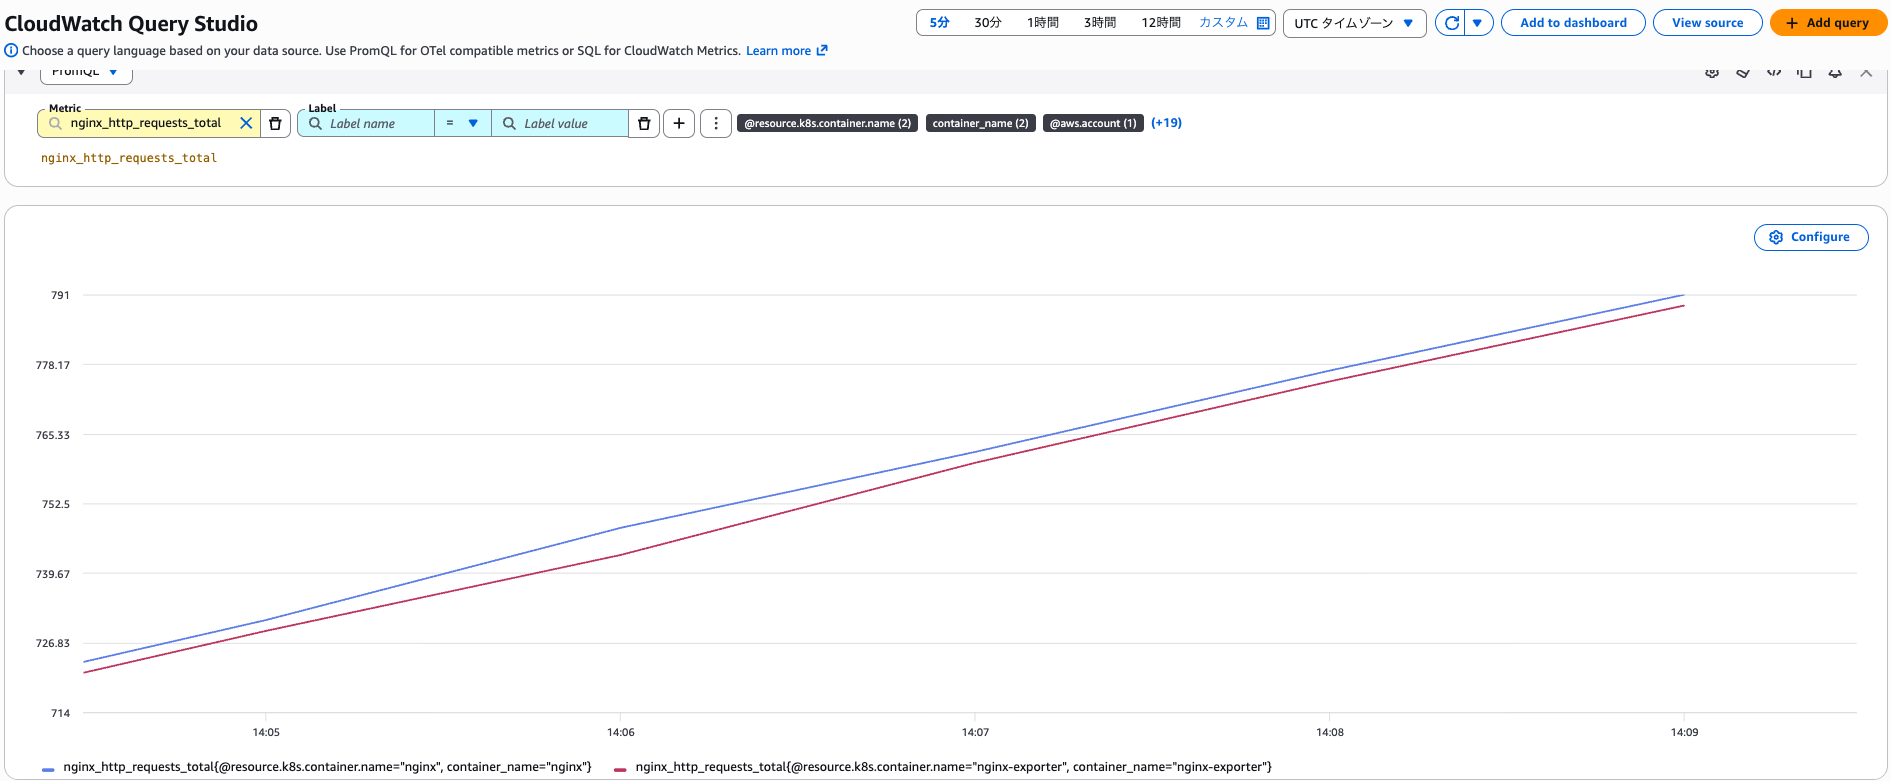
しばらく待った後、CloudWatch Query Studio から PromQL でクエリを行うと、Nginx のメトリクスが取得できました。
Amazon Managed Service for Prometheus (AMP) との比較
CloudWatch が OpenTelemetry メトリクスに対応してくると、Amazon Managed Service for Prometheus (AMP) との違いが気になります。
ざっと挙げると下記のような違いがあります。
- OTel Container Insights は CloudWatch Observability EKS アドオンか CloudWatch エージェントが必須
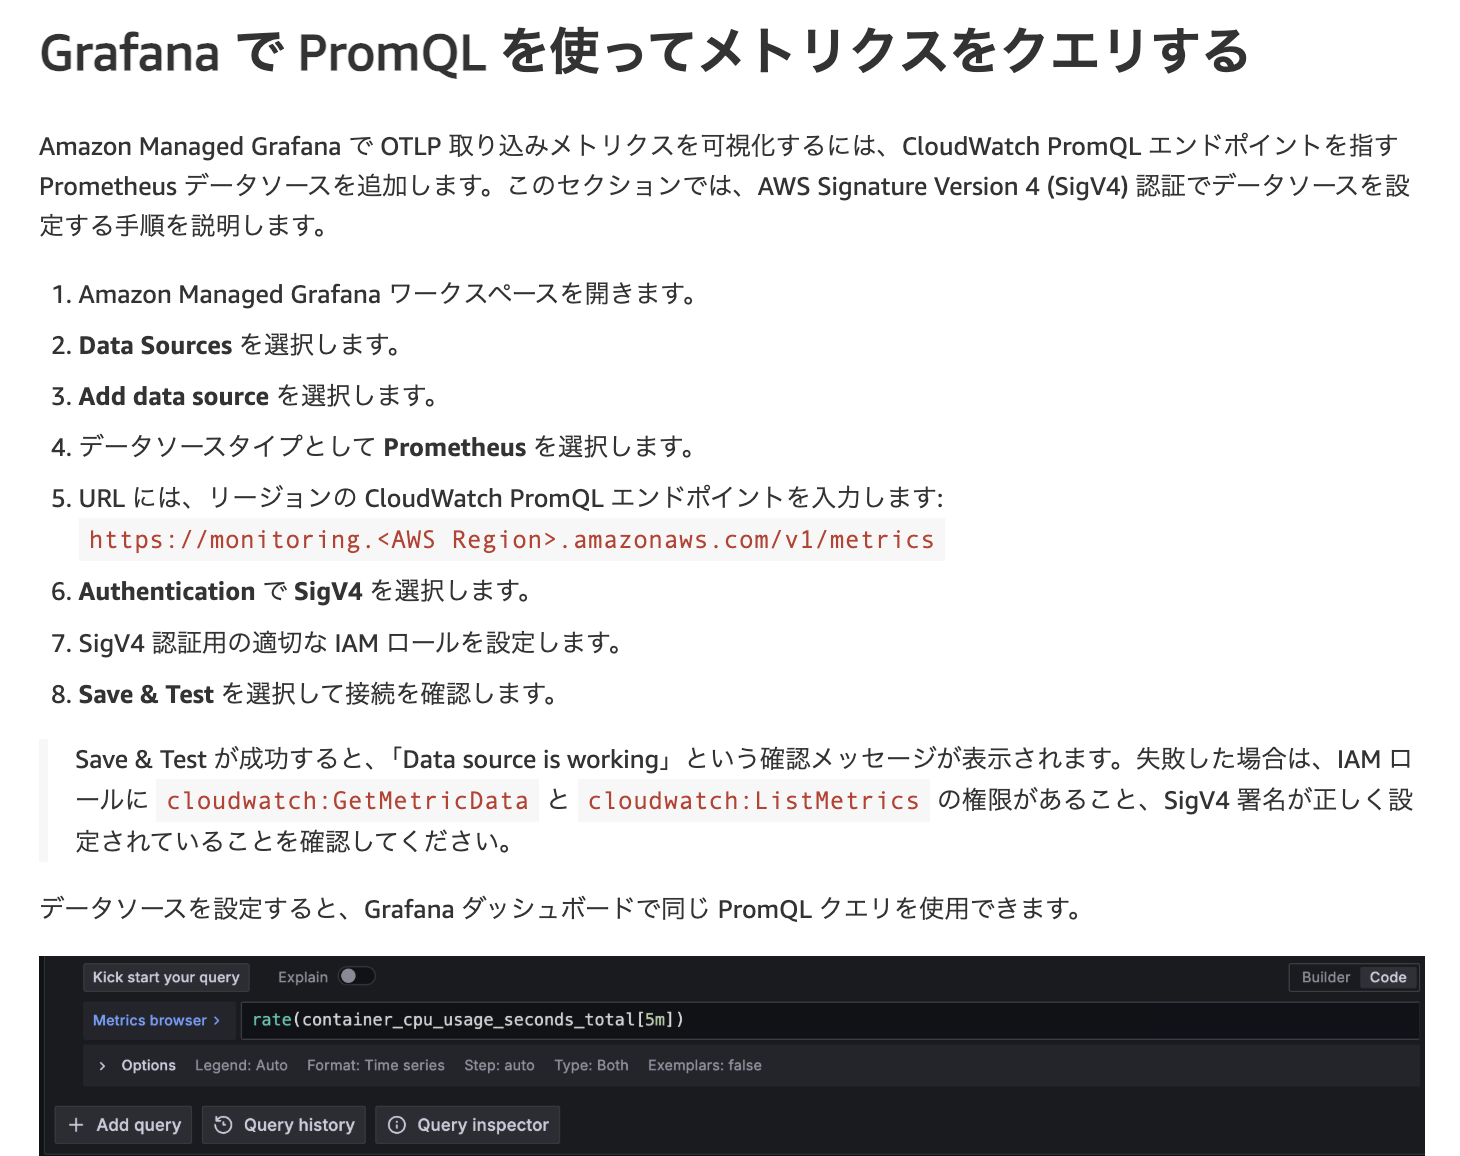
- OTel Container Insights は標準でダッシュボードが用意されており、必要に応じて PromQL エンドポイント経由で Grafana から可視化することも可能
- Amazon Managed Prometheus はデータの保持期間が最大 1095 日
- Amazon Managed Prometheus はマネージドコレクター (EKS に Prometheus エージェントをインストールせずにスクレイピングする機能) を利用できる
- OTel Container Insights は 1 分間隔のメトリクスしか収集できない。Amazon Managed Prometheus だとスクレイピング間隔を自由に設定でき、より高い解像度でメトリクスを収集できる。
現状 CloudWatch で OpenTelemetry メトリクスを扱う際の料金が不明なので、大事な判断基準であるコスト観点の比較ができません。
とはいえ、Container Insights with enhanced observability の料金感とそこまで乖離しないのではないかと思っています。
それぞれの方式で試算して決めるケースもあると思いますが、スクレイピング間隔を細かく設定したい等の要件が無ければ、セットアップコストが低い CloudWatch を利用した方が良いケースが多くなりそうな気がします。
最後に
OTel Container Insights が利用できるようになり、より OpenTelemetry の標準的な仕様に近い形でメトリクスを収集できるようになりました。
合わせて CloudWatch が PromQL でクエリを行えるようになっており、今後の AMP との棲み分けも気になる所です。
コストが高すぎる等が無ければ、既に Enhanced Container Insights を利用しているケースはもちろん、AMP + AMG を利用しているケースからの移行も考えられます。
今から GA が待ち遠しいですね!