I tried to make a Google Sheets chart about smartphone sales in Japan by making use of Bing AI
この記事は公開されてから1年以上経過しています。情報が古い可能性がありますので、ご注意ください。
Introduction
Hemanth of Alliance Department here. In this blog, I tried to create chart in Google sheet about Smartphone sales In Japan using Bing.
Bing AI
A chatbot created by Microsoft. It is based on the OpenAI GPT-4 foundational large language model (LLM). It may be used as a conversation tool, compose many kinds of material, including poetry, songs, novels, and reports, give the user information and insights about the page presently open in the browser, and utilize its image creator to create a logo, drawing, piece of art, or other image based on text.
Google Sheets
The online spreadsheet editor, Google Sheets is a component of Google Workspace. Real-time spreadsheet creation and collaboration are made possible from any device. Google Sheets may be used to create charts, analyze data, create algorithms, and more. Google Slides, Docs, Gmail, and Meet1 are just a few other Google products that are simple to link with Google Sheets.
Demo
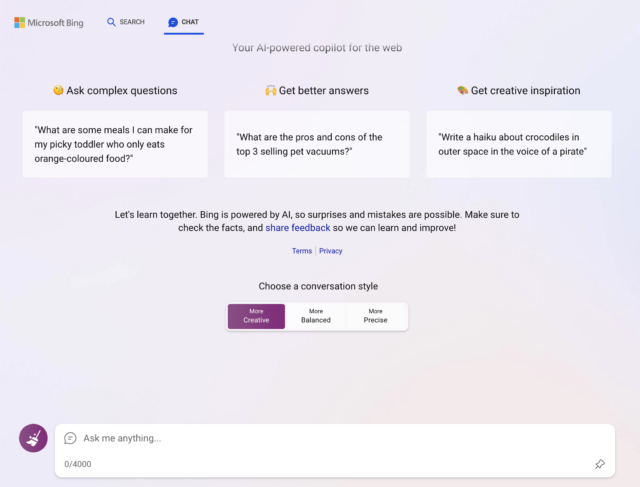
Go to bing and click on creative mode
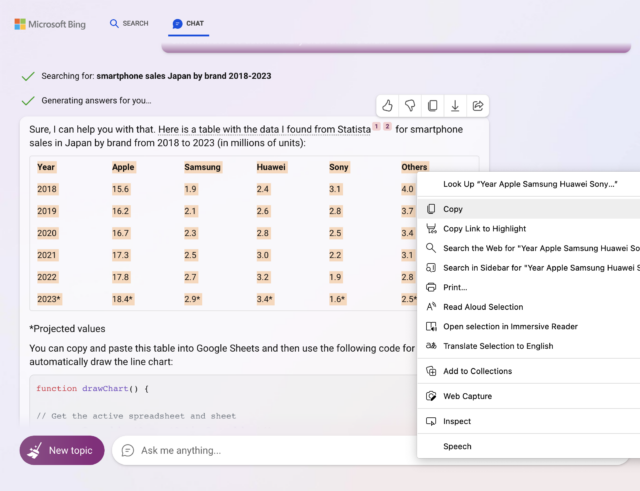
 Now enter the following prompt
 Copy the data
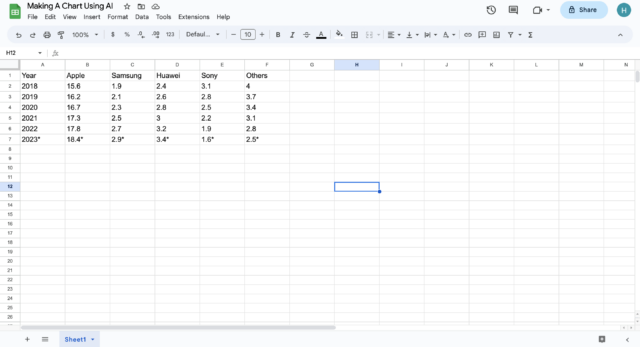
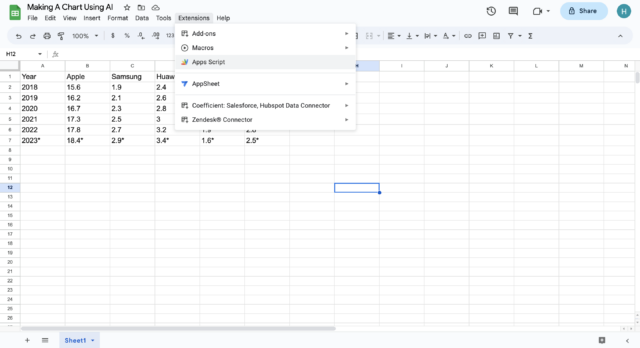
 Paste the data into google sheets
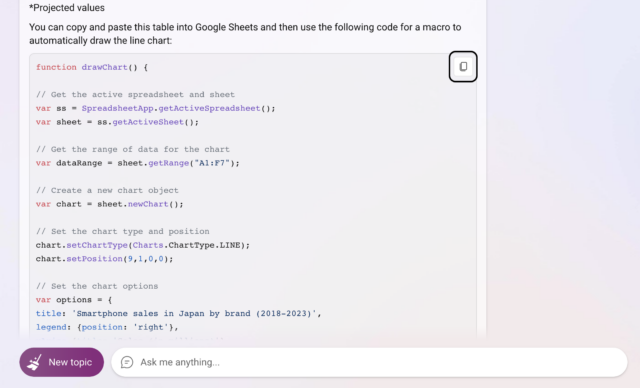
 Copy the code
 In extensions click on app script
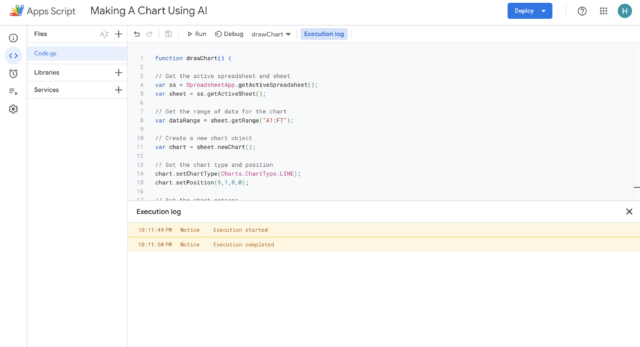
 paste the copied code, save it and click on run
 Give it necessary permissions and code should execute
 [In case of error put it back in BingAI and it'll solve it]
Chart is created successfully
[In case of error put it back in BingAI and it'll solve it]
Chart is created successfully
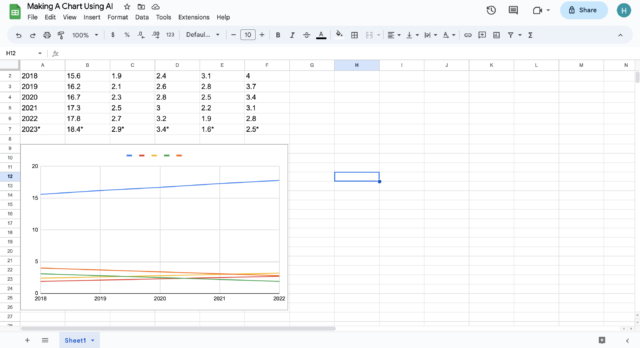 If you click on edit chart, you can create other charts as well


Conclusion
Hope with this you get an idea of how to make a Google Sheets chart about smartphone sales in Japan by making use of Bing. Thank you for seeing the blog till the end.